Visual dual dot immunoassay for the simultaneous detection of kanamycin and streptomycin in milk†
Dali
Wei
,
Hui
Meng
,
Kun
Zeng
 * and
Zhe
Huang
School of the Environment and Safety Engineering, Jiangsu University, Zhenjiang, Jiangsu 212013, China. E-mail: kjj80116@163.com; Tel: +86-511-88780955
First published on 26th November 2018
Abstract
Aminoglycoside (AG) antibiotics such as kanamycin (KAN) and streptomycin (STR) are widely used against bacterial infections in animals. Our aim was to develop a multiplex paper-based visual method to monitor the residues of KAN and STR in milk with the features of cost-effectiveness and visual readout. In this study, monoclonal antibodies (mAbs) against STR were developed and used. The most sensitive mAb, named 6H3D5, displayed enhanced cross-reactivity to dihydrostreptomycin (101.62%) and no cross-reactivity to other related antibiotics. Additionally, a new dual dot enzyme-linked immunosorbent assay (ELISA) was established for the simultaneous detection of KAN and STR in milk. All the experiments were performed in triplicate. The limit of detection (LOD) with the naked eye was 2.7 ng mL−1 for KAN and 12.5 ng mL−1 for STR. The quantitative detection ranges of KAN and STR were 0.38–38.66 and 2.47–31.90 ng mL−1, with LODs at 0.09 and 1.37 ng mL−1, respectively. Good correlations between the dual dot-ELISA and UPLC-MS/MS were observed for the detection of KAN (R = 0.911) and STR (R = 0.902). For quantitative analysis, the recovery rates for KAN and STR were 84.2–119.8% and 93.3–124.5% respectively. In commercial milk samples, KAN was found to be present up to a concentration of 1.47 ng mL−1, whereas STR was below the LOD. This dual dot-ELISA provides a new model for multi-compound analysis in a single assay enabling effective monitoring of food quality.
Introduction
Aminoglycoside (AG) antibiotics usually consist of two or more amino sugars participating in a glycoside linkage to an aminocyclitol component. AGs have a broad antibacterial spectrum for a variety of Gram-positive and Gram-negative bacteria. Therefore, they are widely used for the treatment of some parasites and bacterial infections in animals. In recent years, AGs have been favored by animal husbandry and veterinary medicine as growth promoters and feed additives.1 However, extensive use of AGs may cause ototoxicity and nephrotoxicity through the food chain.2 AGs such as kanamycin (KAN) and streptomycin (STR) are monitored in milk at the maximum residue limit (MRL) of 150 and 200 ng mL−1, respectively, by the European Union.3 Chromatography methods, including gas chromatography,4 high-performance liquid chromatography (HPLC),5,6 HPLC with evaporative light scattering detection,7 microbiological assays,8 and immunoassays have been used to analyze AGs in animal-origin food. However, AGs need to be derivatized prior to liquid chromatography analysis because they do not have chromophores and fluorophores in their structures. The tedious sample preparation procedure and complex operations hinder the use of chromatography methods in screening AGs in milk. Consequently, it is necessary to develop convenient and robust analytical methods for the detection and monitoring of AG antibiotics in milk to ensure animal food safety.In the past two decades, immunodiagnostic methods based on antigen–antibody specific recognition have become the most effective and widely used methods for the detection of antibiotics, heavy metals, and pesticides in food safety analysis.9–11 Paper-based visual detection methods have attracted the attention of researchers in many fields, including medical testing, food analysis, and environmental monitoring, because of their portability, low cost, and easy-to-interpret visual readout.12–14 Lateral flow assay (LFA)15–17 and dot enzyme-linked immunosorbent assay (ELISA) are the most widely used formats, in which an antibody or antigen is immobilized on nitrocellulose membranes (NCMs) as lines or spots and the change of color is related to the concentration of the target. Paper-based visual assays in other formats have also been investigated and developed. Our group has developed a filtration immunoassay using carbon nanotubes as a solid support to detect antibiotics in milk, which allowed detection of gentamicin at 0.1 ng mL−1 with the naked eye.18
To improve the efficiency of analytical methods, detection of multiple analytes in a single assay has been tested in some studies. There are two strategies to achieve this goal: the use of broad-spectrum binders and formats designed for multiple compounds. Guo et al. have developed a gold nanoparticle-based paper sensor to simultaneously detect 11 benzimidazoles with one monoclonal antibody.19 However, it is very difficult to obtain an antibody that would recognize many compounds, especially those with significant differences in the structure. Therefore, well-designed multi-channel formats may be more effective and easier to implement for the analysis of multiple analytes in one assay. For example, different antibodies could be labeled with different labels with different physical or chemical properties to detect multiple analytes, including quantum dots with different emission peaks, latexes with different colors, and so on. Besides, biochips have enabled new applications for the analysis of dozens of targets in one assay.20,21 Special antibodies are arrayed on one small chip, targets are captured, and digital signals such as fluorescence22,23 are acquired and analyzed. However, the need for special readout equipment for output digital signals, and expensive chips make this methodology unsuitable for screening in the food industry. In paper-based visual LFA, several analytes can be distinguished. Wang et al.24 have developed an immunochromatographic strip for the simultaneous detection of five staphylococcal enterotoxins (A, B, C, D, and E). LFAs for KAN or STR have been reported25,26 and are commercially available, but the multiplex test for the two targets has not been established yet. And, to our knowledge, a multiplex test by dot-ELISA has been rarely developed to detect and distinguish between the multiple targets, which displays a potential for multiplex analysis with visual readout.
Here, we present a novel format of a dual dot-ELISA for the detection of KAN and/or STR in milk. The developed method was evaluated using UPLC-MS/MS, and the effectiveness of this assay was assessed for the detection of KAN and STR in commercial cow milk samples.
Materials and methods
Reagents and materials
Kanamycin sulfate, streptomycin sulfate, gentamicin sulfate, ribose neomycin sulfate, tobramycin sulfate, amikacin sulfate, neomycin B sulfate, tetramethylbenzidine (TMB), 3-amino-9-ethylcarbazole (AEC), 1-ethyl-3-(3-dimethylaminopropyl) carbodiimide hydrochloride (EDC), goat anti-mouse antibody (GAM), bovine serum albumin (BSA), ovalbumin (OVA), and gelatin were provided by Sigma-Aldrich (St Louis, MO, USA). A monoclonal antibody against KAN (mAb-KAN 4G1E5) was prepared in our laboratory.27 Round NCMs with a diameter of 13 mm (0.22 μm) were purchased from Sinopharm Chemical Reagent Beijing Co., Ltd (Beijing, China). Absorbance measurements were made with a microplate reader (BioTek Instruments, Inc., Winooski, VT, USA). The ImmunoPure® monoclonal antibody isotyping kit was purchased from Pierce (Rockford, IL, USA).Production of a monoclonal antibody against STR
To generate an immunogen, 10 mg of STR was mixed in 5 mL of phosphate-buffered saline (PBS, 0.01 mol L−1, pH 7.4) with 5 mg of BSA, and then 25 mg of EDC in 2 mL of PBS was added dropwise into the mixture. The solutions were stirred overnight at 4 °C and dialyzed against PBS for 2 days and the conjugates obtained (BSA-STR) were stored at −20 °C. For the development of coating antigen, 5 mg of STR, 20 mg of OVA, and 10 mg of EDC were dissolved in 5 mL PBS and stirred overnight at 4 °C. The coating antigen (OVA-STR) was dialyzed and stored as described above. The immunization process and development of the hybridoma were described in detail by Zeng et al.28 Cross-reactivity of the antibodies was tested by indirect competitive ELISA (icELISA). The antibody class and subclass determinations were performed according to the protocol for the ImmunoPure® monoclonal antibody isotyping kit.Dot-ELISA procedure for the detection of STR or KAN
In this experiment, NCMs were used as solid supports and all reactions were carried out in 24-well polystyrene plates. One microliter each of diluted antigens (OVA-KAN or OVA-STR) was manually loaded onto NCMs at four spots as quadruplicate. NCMs in 24-well plates were incubated at 4 °C overnight, and then the air-dried strips were incubated with 2% skim milk (200 μL) at 37 °C for 1 h. Diluted mAb-KAN or mAb-STR (100 μL) was added onto NCMs with different concentrations of KAN or STR standards (100 μL in PBS). NCMs immersed in the mixtures were incubated at 37 °C for 30 min and the solutions were discarded using a pipette. Washing buffer (500 μL; 0.05% Tween 20 in 0.01 mol L−1 PBS, pH 7.4, PSBT) was added into the 24-well plate and the plate was shaken slightly for 1 min. Then, the liquid in the 24-well plate was aspirated and the washing procedure was repeated three times. Furthermore, NCMs were incubated with 200 μL of horseradish peroxidase (HRP)-conjugated GAM (1![[thin space (1/6-em)]](https://www.rsc.org/images/entities/char_2009.gif) :
:![[thin space (1/6-em)]](https://www.rsc.org/images/entities/char_2009.gif) 5000 dilutions in 0.01 mol L−1 PBS) at 37 °C for 30 min. After washing as described above, NCMs were immersed in 200 μL of HRP substrate color solution containing 0.05% AEC and 0.03% H2O2 in 0.05 mol L−1 sodium acetate buffer (pH 5.5) at 37 °C for 10 min. The reaction was terminated by washing NCMs with distilled water. Finally, NCMs were air-dried and photographed using a digital camera. For quantitative measurements, the color density of the test dot was quantified using the ImageJ software.
5000 dilutions in 0.01 mol L−1 PBS) at 37 °C for 30 min. After washing as described above, NCMs were immersed in 200 μL of HRP substrate color solution containing 0.05% AEC and 0.03% H2O2 in 0.05 mol L−1 sodium acetate buffer (pH 5.5) at 37 °C for 10 min. The reaction was terminated by washing NCMs with distilled water. Finally, NCMs were air-dried and photographed using a digital camera. For quantitative measurements, the color density of the test dot was quantified using the ImageJ software.
Optimization of dot-ELISA
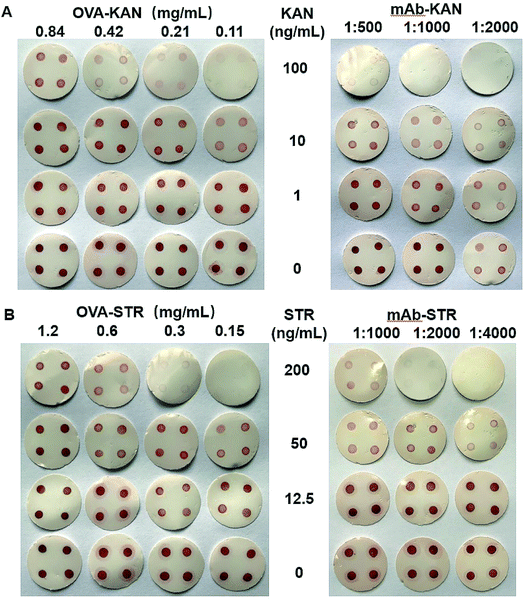
To optimize the performance of dot-ELISA, blocking buffers with different concentrations of gelatin, BSA, and skim milk (2%, 5%, and 8%) were assessed for better blocking of the background signal. Concentrations of OVA-KAN (0.84, 0.42, 0.21, and 0.11 mg mL−1) and mAb-KAN (1![[thin space (1/6-em)]](https://www.rsc.org/images/entities/char_2009.gif) :
:![[thin space (1/6-em)]](https://www.rsc.org/images/entities/char_2009.gif) 500, 1
500, 1![[thin space (1/6-em)]](https://www.rsc.org/images/entities/char_2009.gif) :
:![[thin space (1/6-em)]](https://www.rsc.org/images/entities/char_2009.gif) 1,000, and 1
1,000, and 1![[thin space (1/6-em)]](https://www.rsc.org/images/entities/char_2009.gif) :
:![[thin space (1/6-em)]](https://www.rsc.org/images/entities/char_2009.gif) 2000 dilutions) were evaluated at different concentrations of KAN (0, 1, 10, and 100 ng mL−1). Concentrations of OVA-STR (1.2, 0.6, 0.3, and 0.15 mg mL−1) and mAb-STR (1
2000 dilutions) were evaluated at different concentrations of KAN (0, 1, 10, and 100 ng mL−1). Concentrations of OVA-STR (1.2, 0.6, 0.3, and 0.15 mg mL−1) and mAb-STR (1![[thin space (1/6-em)]](https://www.rsc.org/images/entities/char_2009.gif) :
:![[thin space (1/6-em)]](https://www.rsc.org/images/entities/char_2009.gif) 1,000, 1
1,000, 1![[thin space (1/6-em)]](https://www.rsc.org/images/entities/char_2009.gif) :
:![[thin space (1/6-em)]](https://www.rsc.org/images/entities/char_2009.gif) 2,000, and 1
2,000, and 1![[thin space (1/6-em)]](https://www.rsc.org/images/entities/char_2009.gif) :
:![[thin space (1/6-em)]](https://www.rsc.org/images/entities/char_2009.gif) 4000 dilutions) were evaluated at different concentrations of STR (0, 50, 200, and 500 ng mL−1). The concentrations of mAb-KAN and mAb-STR were 2.24 and 3.42 mg mL−1, respectively. When optimizing the concentrations of the coating antigens and antibodies, all measurements were performed in quadruplicate on one NCM.
4000 dilutions) were evaluated at different concentrations of STR (0, 50, 200, and 500 ng mL−1). The concentrations of mAb-KAN and mAb-STR were 2.24 and 3.42 mg mL−1, respectively. When optimizing the concentrations of the coating antigens and antibodies, all measurements were performed in quadruplicate on one NCM.
Dual dot-ELISA procedure for the detection of KAN and STR
The spots on NCMs were arranged as shown in Fig. 1, of which the two left dots were for testing KAN and STR and the right dots were the positive control (PC) and negative control (NC). In the PC, GAM was immobilized to capture the antibody, while PBS was used as the NC. One microliter of diluted OVA-KAN, OVA-STR, GAM, and PBS was manually loaded onto NCMs at four spots. After incubation at 4 °C overnight, the dipsticks were incubated with 2% skim milk (200 μL) at 37 °C for 1 h. For the simultaneous detection of KAN and STR, diluted mAb-KAN and mAb-STR were added onto NCMs in 24-well plates with different concentrations of the KAN and STR standards in PBS. In the mixtures, the volume of the four reagents was 50 μL each. Then, NCMs in 24-well plates were washed with PBST three times as before. GAM-HRP (200 μL; 1![[thin space (1/6-em)]](https://www.rsc.org/images/entities/char_2009.gif) :
:![[thin space (1/6-em)]](https://www.rsc.org/images/entities/char_2009.gif) 5000 dilutions in 0.01 mol L−1 PBS) was added onto NCMs in 24-well plates and incubated at 37 °C for 30 min. After washing three times with PBST, the color was developed by adding 200 μL of an AEC substrate color solution onto the NCMs at 37 °C for 10 min. The results of dipsticks were recorded using a digital camera.
5000 dilutions in 0.01 mol L−1 PBS) was added onto NCMs in 24-well plates and incubated at 37 °C for 30 min. After washing three times with PBST, the color was developed by adding 200 μL of an AEC substrate color solution onto the NCMs at 37 °C for 10 min. The results of dipsticks were recorded using a digital camera.
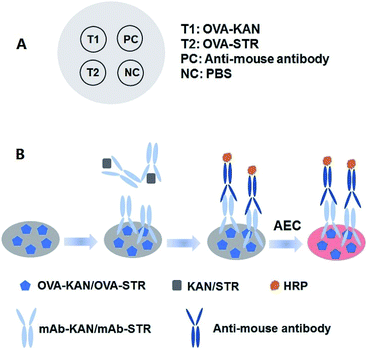 | ||
| Fig. 1 Schematic diagram of dot-ELISA for KAN and STR. (A) Diagram of the sampling location. (B) Procedure for dot-ELISA on NCMs. | ||
Analysis of bovine milk samples
For testing, bovine milk samples were centrifuged at 5000 × g for 10 min, and the middle layers were diluted with PBS to reduce the matrix effect of proteins or other components present in the sample matrixes. The diluted bovine milk samples were used to prepare the KAN/STR standards to generate the standard curves. To evaluate the concentration of KAN/STR in real bovine milk, five samples of commercially available milk from local markets (Zhenjiang, China) were analyzed by the developed method.Dual dot-ELISA validation
Validation studies were performed by (1) determining the inter-assay variation with each concentration of KAN/STR; (2) evaluating the recovery rate fortified with varying KAN/STR concentrations; (3) comparing the results with those measured by UHPLC/MS according to previous studies.23 All these experiments were performed in triplicate.Results and discussion
Principle and design of dual dot-ELISA
Dual dot-ELISA was designed in a multi-channel format using NCMs as the solid support for the multiplex analysis. Two factors were considered for the design of this new method. The first was the arrangement of spots on NCMs, with two test dots for the multiplex immunoassays and two control dots. The presence of a visible dot in the PC position was used to confirm the efficacy of the assay; in its absence, the assay was considered invalid. NC dots were used to assess the background, since an enzyme–substrate colorimetric method was used to obtain output signals. The second factor was the choice of a chromogenic substrate. For HRP, there are many chromogenic substrates such as TMB, O-phenylenediamine (OPD), AEC, and diaminobenzidine (DAB), which have been widely used for color reactions in immunoassays. TMB and OPD have been adopted in ELISAs owing to the solubility of their products, while the products of AEC and DAB are insoluble, making them suitable for displaying results on paper, as in western blotting. According to the pretest, the dots in paper using AEC were deeper and more significant than while using DAB (Fig. S1†). Therefore, AEC was chosen as a chromogenic substrate in the subsequent experiments.Hybridoma production and antibody characterization
Among 10 immunized mice, the mouse with the highest titer and sensitivity was used for cell fusion. After four rounds of subcloning, six hybridomas with high sensitivity were reserved; all of these were determined to be of an IgG1 isotype with a kappa light chain. The hybridoma named 6H3D5 showed the highest sensitivity among all hybridomas and was used for further experiments. The 50% inhibitory concentration (IC50) of mAb-STR 6H3D5 was 8.41 ng mL−1, which was comparable with the data from other reports.29,30 mAb-STR 6H3D5 showed higher cross-reactivity with dihydrostreptomycin (101.62%), with negligible cross-reactivity with other AGs (<1%) (Table 1). Consistent with previous reports, all antibodies against STR showed high cross-reactivity (75–150%) between STR and dihydrostreptomycin.31,32| Antibiotics | IC50 (ng mL−1) | Cross-reactivity (%) |
|---|---|---|
| Streptomycin | 8.15 | 100 |
| Dihydrostreptomycin | 8.02 | 101.62 |
| Tobramycin | >20![[thin space (1/6-em)]](https://www.rsc.org/images/entities/char_2009.gif) 000 000 |
<0.01 |
| Neomycin | >20![[thin space (1/6-em)]](https://www.rsc.org/images/entities/char_2009.gif) 000 000 |
<0.01 |
| Amikacin | >20![[thin space (1/6-em)]](https://www.rsc.org/images/entities/char_2009.gif) 000 000 |
<0.01 |
| Kanamycin | >20![[thin space (1/6-em)]](https://www.rsc.org/images/entities/char_2009.gif) 000 000 |
<0.01 |
| Gentamicin | >20![[thin space (1/6-em)]](https://www.rsc.org/images/entities/char_2009.gif) 000 000 |
<0.01 |
Optimization of dot-ELISA for KAN or STR
To achieve an optimal analytical performance, experimental conditions, including blocking solutions and concentrations of the coating antigens and antibodies, were examined. Gelatin, BSA, and skim milk were chosen as the blocking agents, and different concentrations were examined (Fig. S2†). Significant non-specific binding was observed when gelatin or BSA was used, while skim milk effectively eliminated non-specific binding, even at low concentrations. Therefore, 2% skim milk was used as the blocking solution. The optimal duration for blocking was found to be 1 h or longer based on the clear background achieved (Fig. S3†). Therefore, blocking with skim milk was performed for 1 h in the subsequent experiments.When developing a dot-ELISA, the concentrations of the coating antigen and antibody are important factors influencing the sensitivity of the immunoassay. The optimized conditions were evaluated using two criteria: the sensitivity and color density of the spots without standards. Sensitivity is the most important parameter to assess the performance of analytical methods, in which higher sensitivity means better properties. At the same time, appropriate color density at the test spots is necessary for an optimal read out. Intense deep color at the spots always implies a loss of sensitivity, while faint color may lead to difficulty in distinguishing the difference between the serial concentrations by the naked eye. As shown in Fig. 2, when OVA-KAN concentration exceeded 0.21 mg mL−1, the red dots were significantly observed at 100 ng mL−1 of KAN, while the red points almost disappeared at 0.11 mg mL−1 of OVA-KAN. Hence, it was considered that 0.11 mg mL−1 OVA-KAN was the optimum condition for detection. Higher concentrations of mAb-KAN could result in the loss of sensitivity, and hence a dilution of 1![[thin space (1/6-em)]](https://www.rsc.org/images/entities/char_2009.gif) :
:![[thin space (1/6-em)]](https://www.rsc.org/images/entities/char_2009.gif) 1000 was chosen. The optimum conditions for STR were determined in a similar manner and were found to be 0.15 mg mL−1 OVA-STR and a dilution of 1
1000 was chosen. The optimum conditions for STR were determined in a similar manner and were found to be 0.15 mg mL−1 OVA-STR and a dilution of 1![[thin space (1/6-em)]](https://www.rsc.org/images/entities/char_2009.gif) :
:![[thin space (1/6-em)]](https://www.rsc.org/images/entities/char_2009.gif) 4000 for mAb-STR. The concentration of GAM in PC was optimized at 10 μg mL−1 to match the intensity of the test dots (Fig. S4†).
4000 for mAb-STR. The concentration of GAM in PC was optimized at 10 μg mL−1 to match the intensity of the test dots (Fig. S4†).
Performance of dot-ELISA
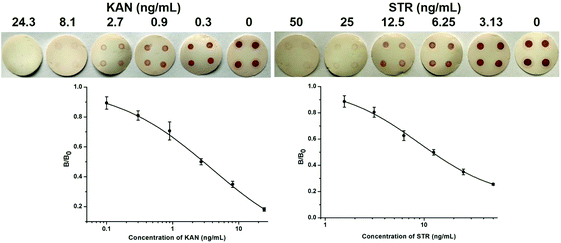
Based on the optimized conditions, singleplex dot-ELISAs were established first. The intensity of the dots gradually decreased with increasing concentrations of KAN/STR standards, and the dots almost disappeared at 24.3 ng mL−1 KAN and 50 ng mL−1 STR (Fig. 3). Compared with the intensity of dots without standards, significant differences could be detected with the naked eye at 0.9 ng mL−1 KAN and 6.25 ng mL−1 STR, which were set as the limits of detection (LODs) for qualitative analysis and could satisfy the regulatory demands of the EU standards. For the visual detection of KAN, Liu et al.25 have developed a lateral flow strip using KAN-specific aptamer-modified gold nanoparticles, and the visual limit was reached at 35 nM (20.39 ng mL−1). Xu et al.33 have established a visual gel-ELISA to detect KAN in milk, for which the sensitivity was 2 ng mL−1 in PBS and 5 ng mL−1 in milk. The newly developed dot-ELISA showed the same level of sensitivity for KAN as in the Xu et al. report and was more sensitive than the Liu et al. method. For the visual detection of STR, several lateral flow strips based on gold nanoparticles have been introduced, and the LODs were 2 ng mL−1,34 30 ng mL−1,35 and 160 ng mL−1,26 respectively, i.e., comparable to that of our method.To quantify the results further, the ImageJ software was used to analyze the dot blots, and the results were used to generate the calibration curves for KAN and STR (Fig. 3). The detection range for KAN was 0.38–38.66 ng mL−1, with LOD at 0.09 ng mL−1 and IC50 at 3.83 ng mL−1. For STR, the detection range was 2.47–31.90 ng mL−1, with LOD at 1.37 ng mL−1 and IC50 at 8.88 ng mL−1. These parameters were consistent with the results reported for previous ELISA methods,36–39 in which LODs were at the level of several ng mL−1. However, the sensitivities were lower than those of electrochemical methods, which had LODs at pg mL−1.40,41
Dual dot-ELISA for KAN and STR
Referring to the format of biochips, we attempted to develop a multiplex platform on paper with low cost and visual readout. To achieve multi-compound analysis in one assay, OVA-KAN and OVA-STR were immobilized on one NCM at different positions, and the absence of cross-reactivity between the two antigen–antibody pairs was evaluated. It had been confirmed that mAb-KAN/mAb-STR had no cross-reactivity with STR/KAN respectively (Table 1 and S1†). As shown in Fig. 4A and B, no cross-reactivity was observed in dot-ELISA when either mAb-KAN or mAb-STR was added, which suggested the feasibility of developing a dual dot-ELISA using these reagents. Representative dual dot-ELISA results for KAN and STR are displayed in Fig. 4C. Because of the convenience and high efficiency, multiplex assays in one test, especially, visible multiplex assays, have gained the attention of analysts. The dual dot-ELISA provides a new model for detecting two targets and can be expanded for more than two targets by increasing the test channels on NCMs for more effective detection. Thus, the distinct feature of the dual dot-ELISA is its multiplex capability, which makes it different from the conventional LFA.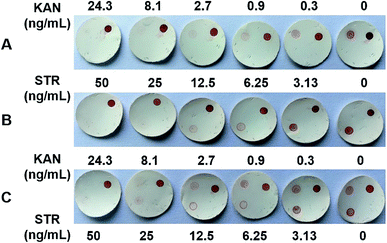 | ||
| Fig. 4 Dual dot-ELISA for KAN and/or STR: (A) only mAb-KAN was added; (B) only mAb-STR was added; (C) mAb-KAN and mAb-STR were added. | ||
Preparation of bovine milk sample
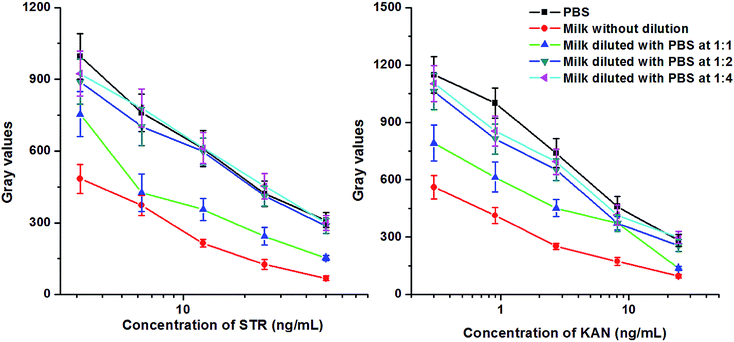
It is well known that bovine milk samples contain many kinds of proteins, fat, and other constituents, which would interfere with the binding between an antigen and antibody. Therefore, the matrix effects were evaluated after centrifugation of samples and dilution with PBS. It was observed that the gray values of the test dots were significantly reduced, and the curves were flattening when milk samples were added without dilution or diluted at 1![[thin space (1/6-em)]](https://www.rsc.org/images/entities/char_2009.gif) :
:![[thin space (1/6-em)]](https://www.rsc.org/images/entities/char_2009.gif) 1, which indicates the loss of sensitivity (Fig. 5). When the dilution ratio was 1
1, which indicates the loss of sensitivity (Fig. 5). When the dilution ratio was 1![[thin space (1/6-em)]](https://www.rsc.org/images/entities/char_2009.gif) :
:![[thin space (1/6-em)]](https://www.rsc.org/images/entities/char_2009.gif) 2 and 1
2 and 1![[thin space (1/6-em)]](https://www.rsc.org/images/entities/char_2009.gif) :
:![[thin space (1/6-em)]](https://www.rsc.org/images/entities/char_2009.gif) 4, the intensity of the color was almost the same as that in the control experiment. In the subsequent experiment, all milk samples were diluted 1
4, the intensity of the color was almost the same as that in the control experiment. In the subsequent experiment, all milk samples were diluted 1![[thin space (1/6-em)]](https://www.rsc.org/images/entities/char_2009.gif) :
:![[thin space (1/6-em)]](https://www.rsc.org/images/entities/char_2009.gif) 2 with PBS.
2 with PBS.
Assay validation
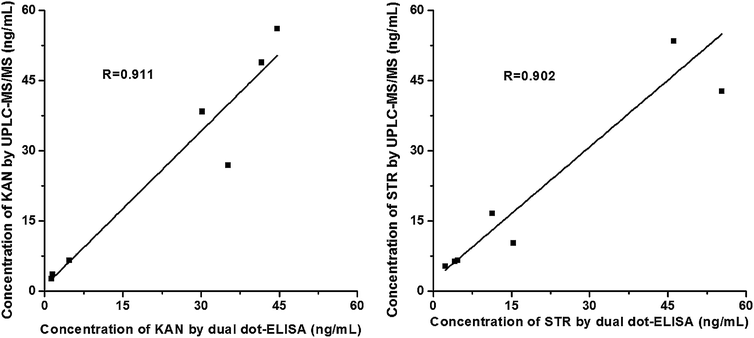
Milk samples spiked with four different concentrations of KAN or STR were analyzed using the dual dot-ELISA. After simple preparation by centrifugation and dilution, the recovery rates for KAN were between 84.2% and 119.8%, whereas those for STR ranged from 93.3% to 124.5% (Table 2). To validate the utility of this newly developed method, UPLC-MS/MS was used to compare the results obtained with the dual dot-ELISA. A negative milk sample, in which the concentrations of KAN and STR were below the LODs of UPLC-MS/MS, was adopted to spike randomly with different concentrations of both AGs because of the lack of confirmed positive samples. These spiked samples were evaluated by UPLC-MS/MS and dual dot-ELISA simultaneously (Table S2†). The results showed that there was a good correlation between the two methods for the detection of KAN (R = 0.911) and STR (R = 0.902) (Fig. 6), which indicated that the developed assay could be used for KAN and STR detection in bovine milk samples.| KAN | STR | ||||
|---|---|---|---|---|---|
| Spiked (ng mL−1) | Detected (ng mL−1) | Recovery rate (%) | Spiked (ng mL−1) | Detected (ng mL−1) | Recovery rate (%) |
| 0 | 0.47 ± 0.04 | — | 0 | 1.47 ± 0.18 | — |
| 0.5 | 0.89 ± 0.04 | 84.2% | 5 | 6.12 ± 0.41 | 93.3% |
| 2 | 2.84 ± 0.17 | 118.5% | 10 | 13.92 ± 1.21 | 124.5% |
| 10 | 12.45 ± 0.78 | 119.8% | 25 | 29.67 ± 3.67 | 112.8% |
Detection of KAN and STR in real bovine milk samples
Five milk samples from local markets (Zhenjiang, China) were analyzed using the dual dot-ELISA method (Table 3). KAN was found to be present up to a concentration of 1.47 ng mL−1, whereas the concentrations of STR were below the LOD of the dual dot-ELISA, all of which were significantly lower than the established MRL. Comparing with commercial LFA products for one target, the dual dot-ELISA would improve the efficiency and reduce the cost with the feature of multiplex analysis.| Samples | Dual dot-ELISA | UPLC-MS/MS | |||
|---|---|---|---|---|---|
| KAN (ng mL−1) | STR (ng mL−1) | KAN (ng mL−1) | STR (ng mL−1) | ||
| a ND: not detected. | |||||
| 1 |

|
ND | ND | ND | ND |
| 2 |

|
0.51 | ND | ND | ND |
| 3 |

|
ND | ND | ND | ND |
| 4 |

|
1.47 | ND | ND | ND |
| 5 |

|
ND | ND | ND | ND |
Conclusions
In summary, a highly sensitive mAb against STR was developed, and this was shown to have 101.62% cross-reactivity with dihydrostreptomycin. A new format of visual dual dot-ELISA for the simultaneous detection of KAN and STR in milk is described here. The newly developed system is capable of selectively differentiating the targets and provides a new platform for further development of multiplexed paper-based immunoassays.Conflicts of interest
There are no conflicts to declare.Acknowledgements
This work was supported financially by the National Natural Science Foundation of China (31502118 and 31502114), the Scientific Research Funds in Jiangsu University (13JDG016), and the Jiangsu Collaborative Innovation Center of Technology and Material of Water Treatment. Ethical approval: this article does not contain any studies with human participants performed by any of the authors. All mice used for the experiments were obtained from the Comparative Medicine Center, Yangzhou University, China (Certificate No. SCXK (SU) 2007-0007). All experimental procedures were conducted in accordance with the principle of laboratory animal care and approved by the Jiangsu University Committee on Animal Care and Use (Certificate No. SYXK (SU) 2013-0035).References
- B. Shaikh and E. H. Allen, J. - Assoc. Off. Anal. Chem., 1985, 68, 1007 CAS.
- C. H. Clark, Mod. Vet. Pract., 1977, 58, 751 CAS.
- European Commission, COMMISSION REGULATION (EU) No 37/2010 of 22 December 2009 on pharmacologically active substances and their classification regarding maximum residue limits in foodstuffs of animal origin, Official Journal of the European Union, L. Legislation, English Edition, 2010, 15, 1–72, http://ec.europa.eu/health/files/eudralex/vol-5/reg_2010_37/reg_2010_37_en.pdf.
- M. Preu, D. Guyot and M. Petz, J. Chromatogr. A, 1998, 818, 95 CrossRef CAS.
- A. Kaufmann and K. Maden, J. AOAC Int., 2005, 88, 1118 CAS.
- R. Oertel, V. Neumeister and W. Kirch, J. Chromatogr. A, 2004, 1058, 197 CrossRef CAS.
- Q. Liu, J. Li, X. Song, M. Zhang, E. Li, F. Gao and L. He, RSC Adv., 2017, 7, 1251 RSC.
- A. Rosner and H. Aviv, J. Antibiot., 1980, 33, 600 CrossRef CAS.
- Z. Wang, R. C. Beier and J. Shen, Trends Anal. Chem., 2017, 92, 42 CrossRef CAS.
- Y. Li, Y. Sun, R. C. Beier, H. Lei, S. Gee, B. D. Hammock, H. Wang, Z. Wang, X. Sun, Y. Shen, J. Yang and Z. Xu, Trends Anal. Chem., 2017, 88, 25 CrossRef CAS.
- D. Mukunzi, J. Isanga, S. Suryoprabowo, L. Liu and H. Kuang, Food Agric. Immunol., 2017, 28, 1 CrossRef.
- B. B. Dzantiev, N. A. Byzova, A. E. Urusov and A. V. Zherdev, Trends Anal. Chem., 2014, 55, 81 CrossRef CAS.
- B. Ngom, Y. Guo, X. Wang and D. Bi, Anal. Bioanal. Chem., 2010, 397, 1113 CrossRef CAS.
- S. Wang, Y. Wei, H. Jin, C. Li and H. Du, Anal. Lett., 2009, 42, 2807 CrossRef CAS.
- L. Liu, L. Xu, S. Suryoprabowo, S. Song and H. Kuang, Food Agric. Immunol., 2017, 29, 358 CrossRef.
- X. Lei, L. Xu, S. Song, L. Liu and H. Kuang, Food Agric. Immunol., 2017, 29, 254 CrossRef.
- J. Isanga, D. Mukunzi, Y. Chen, S. Suryoprabowo, L. Liu and H. Kuang, Food Agric. Immunol., 2017, 28, 668 CrossRef CAS.
- K. Zeng, W. Wei, L. Jiang, F. Zhu and D. Du, J. Agric. Food Chem., 2016, 64, 7874 CrossRef CAS.
- L. Guo, X. Wu, L. Liu L, H. Kuang and C. L. Xu, Small, 2018, 14, 1701782 CrossRef.
- C. Maercker, Biosci. Rep., 2005, 25, 57 CrossRef CAS.
- A. Qureshi, Y. Gurbuz and J. H. Niazi, Sens. Actuators, B, 2012, 171–172, 62 CrossRef CAS.
- K. Wutz, R. Niessner and M. Seidel, Microchim. Acta, 2011, 173, 1 CrossRef CAS.
- S. Chen, T. Laroche, D. Hamelinck, D. Bergsma, D. Brenner, D. Simeone, R. E. Brand and B. B. Haab, Nat. Methods, 2007, 4, 437 CrossRef CAS.
- W. Wang, L. Liu, L. Xu, H. Kuang, J. Zhu and C. Xu, Part. Part. Syst. Charact., 2016, 33, 388 CrossRef CAS.
- J. Liu, J. Zeng, Y. Tian and N. Zhou, Analyst, 2018, 143, 182 RSC.
- R. Verheijen, I. K. Osswald, R. Dietrich and W. Haasnoot, Food Agric. Immunol., 2000, 12, 31 CrossRef CAS.
- L. Jiang, D. Wei, K. Zeng, J. Shao, F. Zhu and D. Du, Food Anal. Methods, 2018, 11, 2066 CrossRef.
- K. Zeng, T. Yang, P. Zhong, L. Qu, S. Zhou, J. He and Z. Jiang, Hybridoma, 2005, 24, 298 CrossRef CAS.
- J. Wu, S. Zhang and X. Zhou, J. Zhejiang Univ., Sci., B, 2010, 11, 52 CrossRef CAS.
- X. Xi, J. Mu, Y. Gong, Z. Chen, J. Fang, W. Wang and M. Zhang, Food Sci., 2013, 34, 181 Search PubMed.
- P. Hammer, H. Kirchhoff and G. Hahn, Anal. Chim. Acta, 1993, 275, 313 CrossRef CAS.
- J. Samsonova, M. Bashkurov, N. Ivanova, M. Y. Rubtsova and A. Egorov, Food Agric. Immunol., 2005, 16, 47 CrossRef CAS.
- F. Xu, J. Li, J. Zhou, M. Liu, Y. Liu, J. Wang, X. Ding and X. Li, Chin. J. Anal. Chem., 2015, 43, 881 CAS.
- P. Schnappinger, E. Usleber, E. Märtlbauer and G. Terplan, Food Agric. Immunol., 1993, 5, 67 CrossRef CAS.
- P. Schnappinger, E. Schneider, E. Märtlbauer and G. Terplan, Food Agric. Immunol., 1996, 8, 269 CrossRef CAS.
- C. Li, Y. Zhang, S. A. Eremin, O. Yakup, G. Yao and X. Zhang, Food Chem., 2017, 227, 48 CrossRef CAS.
- J. He, Y. Wang and X. Zhang, Food Anal. Methods, 2016, 9, 744 CrossRef.
- R. A. Abuknesha and C. Luk, Analyst, 2005, 130, 964 RSC.
- W. Heering, E. Usleber, R. Dietrich and E. Märtlbauer, Analyst, 1998, 123, 2759 RSC.
- S. Yu, Q. Wei, B. Du, D. Wu, H. Li, L. Yan, H. Ma and Y. Zhang, Biosens. Bioelectron., 2013, 48, 224 CrossRef CAS.
- B. Liu, B. Zhang, Y. Cui, H. Chen, Z. Gao and D. Tang, ACS Appl. Mater. Interfaces, 2011, 3, 4668 CrossRef CAS.
Footnote |
| † Electronic supplementary information (ESI) available. See DOI: 10.1039/c8ay02006j |
| This journal is © The Royal Society of Chemistry 2019 |

