Why do we need the uncertainty factor?
Analytical Methods Committee AMCTB No. 88
First published on 27th March 2019
Abstract
The uncertainty factor is a new way to express measurement uncertainty. It is especially applicable when the uncertainty is large (e.g., expanded relative uncertainty > 20%), which occurs in some analytical methods, and also when the uncertainty includes that arising from the primary sampling of highly heterogeneous materials. The upper and lower confidence limits of the uncertainty interval are calculated by multiplying and dividing the measurement result by the uncertainty factor, rather than adding and subtracting the traditional uncertainty value.
Background
The recognition that all measurement results in analytical science are uncertain, is now well established. Informally and historically, the uncertainty of a measurement result gives ‘an estimate attached to a test result which characterizes the range of values within which the true value is asserted to lie’.1 The accepted way to express this measurement uncertainty is as some multiple (k) of either the standard uncertainty, expressed in the units of measured concentration, or of the relative uncertainty, expressed as a percentage of the concentration value. Why then, you may ask, do we need the uncertainty factor as yet another way of expressing uncertainty?Standard uncertainty is always quantified as a standard deviation, but this assumes that the frequency distribution that it describes is approximately Gaussian (i.e., normal). However, experimental evidence shows that in some situations, the distribution of repeated measurements is not normal but heavily skewed with a substantial proportion of values much higher than the mode. This observation invalidates the assumption of normality. It also suggests that the range of the uncertainty, rather than being symmetrical about the measured value, is asymmetric with a larger range above than below the measured value. The situations where this asymmetry is likely to arise are when the values of relative uncertainty are high (e.g., > 20%), which occurs in some purely analytical systems, but also when the dominant source of the measurement uncertainty is from the primary sampling of a highly heterogeneous sampling target.
A common solution to restoring the validity of the uncertainty estimation in this situation, is to take logarithms of the measurement values, before calculating the standard deviation. Analytical chemists are familiar with logarithms (to the base ten) as a way to express the hydrogen ion activity when using pH units. The pH value is simply the power to which ten must be raised to obtain the H+ activity, with the sign reversed for convenience of use. Expressing activity in this ‘log-domain’ has several advantages, including being able to express an enormous range very concisely (common laboratory values of H+ activity cover a range of 1014). However, in considerations of uncertainty, natural logarithms (i.e., logarithms to the base ‘e’) are more appropriate, as explained in an example below.
For the situation of uncertainty estimation in circumstances of marked asymmetry, this log-transformation has the benefit of often giving an approximately normal distribution which conforms better to the underlying assumptions required. Furthermore, where the standard uncertainty increases in proportion to concentration, the log-transformation also makes all of the differences from the mean value comparable (i.e., it makes the measurement variance homoscedastic), even when the range of concentration values used in the uncertainty estimation is substantial. However, a drawback in this use of transformation, is that the units of the standard deviation that are calculated on the log-transformed measurements (sL), are no longer in the linear units of analyte concentration, but in the log-domain. The way to overcome this drawback is to express the uncertainty as an ‘uncertainty factor’, as will be explained by the use of the following example.
Example of the benefits of using the uncertainty factor
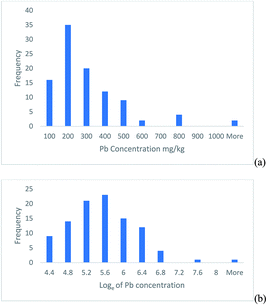
This example is based on the determination of lead in soil samples from 100 sampling targets within a heavily contaminated 30 ha site.2 The histogram of the frequency distribution of the measurement values shows a positively skewed distribution (Fig. 1a), but when natural logarithms of the measurements are taken, the distribution becomes approximately normal (Fig. 1b). | ||
| Fig. 1 Histograms of the Pb concentration measured in 100 soil targets shown on, (a) the original linear scale, (b) after natural logarithms were taken. | ||
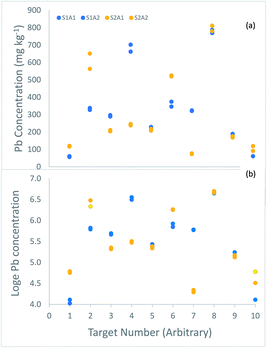
The uncertainty of each of these measurements was estimated using the ‘duplicate method’, in which duplicated analytical measurements are taken on duplicated samples taken at 10 of these 100 targets1 (Fig. 2).
 | ||
| Fig. 2 Measurements of the concentration (mg kg−1) of lead made on duplicated samples from 10 of the 100 targets in a survey of contaminated land, shown in, (a) original concentration units, (b) loge transformed. The duplicate samples (labelled S1 in blue, and S2 in orange) generally differ by more than the duplicate analyses (labelled A1 and A2 in the same colour). (a) Four targets (2, 4, 6 and 7) have particularly large difference between duplicate samples, suggesting a positively skewed distribution for sampling uncertainty, like that between the targets (Fig. 1a). In the log-transformed values (b), these differences are generally much smaller, and more similar across the range of concentration. | ||
The estimate of the expanded relative measurement uncertainty, made using analysis of variance (ANOVA) on the original measurements,2 was 83.9%. However, inspection of the differences between the 10 duplicate samples (Fig. 2a) reveals evidence of the same positive skew seen for the 100 targets (Fig. 1a), with a substantial proportion of large differences (4/10 by a factor of ≥1.5). The implication is that the nature of the heterogeneity between the targets is similar to that between the sample duplicates within a target, which affects the frequency distribution of the uncertainty from sampling. To overcome this problem, the ANOVA was applied to the natural logarithms of the 40 measurements made on the 10 duplicated samples (Fig. 2b).
The initial estimate of uncertainty of the log-transformed measurement (sL) is still ‘in log space’; that is, expressed on the same logarithmic scale as the log-transformed data. To make the resultant estimate of the measurement uncertainty useful in the linear domain, it can be expressed as a (standard) uncertainty factor (Fu), for the 68% confidence interval.3
| Fu = exp(sL) | (1) |
For the more usual 95% confidence, this is expressed as an expanded uncertainty factor (FU). The value of FU can be calculated, either by multiplying sL by the coverage factor of two (k = 2) in the log-domain or, equivalently, by raising Fu to the power of k.
| FU = exp(k × sL) = (Fu)k | (2) |
To use the uncertainty factor, the lower 95% confidence limit is calculated by dividing the measurement value by FU, and the upper limit by multiplying the measurement value by FU.
For this example, the value of sL is 0.48, Fu is calculated as 1.62 using eqn (1), and FU is 2.62 using eqn (2).4 For a typical measured lead concentration value of 300 mg kg−1, the lower 95% confidence limit is 115 mg kg−1 (i.e., 300/2.62) and the upper confidence limit is 784 mg kg−1 (i.e., 300 × 2.62).
This confidence interval is from 115 to 784 mg kg−1, which is from −185 to +484 mg kg−1 away from the measurement value. This interval is clearly asymmetric and reflects the positive skew seen in the original measurements (Fig. 1a).
A further advantage of the uncertainty factor, is that it always gives positive values for the confidence limits of an uncertainty estimate. This contrasts with naïve approaches to high relative uncertainty, which can easily imply an expanded uncertainty extending well below zero.
An apparent complication can arise when the measurement uncertainty from the chemical analysis is expressed as relative uncertainty, but that from the sampling is expressed as an uncertainty factor. However, two solutions to this issue of combining uncertainty expressed in two different ways have been identified.4 One option is to also express the uncertainty from chemical analysis as an uncertainty factor, to match that from the sampling. This option enables a valid combination of the two uncertainties to be made in the usual way, but in log space, producing a combined uncertainty factor for the whole measurement process.
Conclusions
The uncertainty factor is a new way to both calculate and express measurement uncertainty, which we need for situations where, (1) the frequency distribution is approximately log-normal, or (2) when the range of the measured concentration values used is high, or (3) where expanded relative uncertainty is high (> 20%). The limits of the uncertainty interval using the uncertainty factor are calculated by multiplying and dividing the measurement value by the factor. This contrasts with the approach of adding and subtracting the uncertainty value from the measurement value, for the Gaussian (normal) situation. The uncertainty factor is particularly applicable to higher levels of uncertainty, and it also allows for the increase of standard uncertainty as a function of concentration.Further reading
- ISO 3534-1 (1993a), Statistics – vocabulary and symbols, International Organization for Standardization, Geneva..
- Eurachem/EUROLAB/CITAC/Nordtest/AMC Guide: Measurement uncertainty arising from sampling: a guide to methods and approaches Eurachem, ed. M. H. Ramsey and S. L. R. Ellison, 2007, p. 40, ISBN 978 0 948926 26 6, Example A2 Search PubMed.
- M. H. Ramsey and S. L. R. Ellison, Uncertainty Factor: an alternative way to express measurement uncertainty in chemical measurement, Accredit. Qual. Assur., 2015, 20(2), 153–155, DOI:10.1007/s00769-015-1115-6.
- M. H. Ramsey and S. L. R. Ellison, Combined uncertainty factor for sampling and analysis, Accredit. Qual. Assur., 2017, 22(4), 187–189, DOI:10.1007/s00769-017-1271-y
.
This Technical Brief was prepared for the Analytical Methods Committee, with contributions from members of both the AMC Statistics and Sampling Uncertainty Expert Working Groups and approved on 13 March 2019.
| This journal is © The Royal Society of Chemistry 2019 |


