An innovative peptide with high affinity to GPC3 for hepatocellular carcinoma diagnosis†
Qi
Zhang‡
 a,
Zhihao
Han‡
 a,
Ji
Tao
 a,
Menglu
Zhao
 a,
Wancun
Zhang
 a,
Ping
Li
 a,
Liping
Tang
 b and
Yueqing
Gu
 *a
*a
aState Key Laboratory of Natural Medicines, Department of Biomedical Engineering, School of Engineering, China Pharmaceutical University, 24 Tongjia Xiang, Nanjing, Gulou District 210009, China. E-mail: guengineering@cpu.edu.cn
bDepartment of Bioengineering, University of Texas at Arlington, Box 19138, Arlington, TX 76019-0138, USA
First published on 25th October 2018
Abstract
Glypican-3 (GPC3) is a key biomarker for early diagnosis of human hepatocellular carcinoma (HCC) due to its overexpression in most HCC tumor tissues. Recently, peptides with high affinity to GPC3 have attracted more attention because of their high biocompatibility, non-immunogenicity, fast clearing and easy modification. Herein, we have designed an innovative GPC3 targeting peptide (sequence: DYEMHLWWGTEL, denoted as IPA) by using structure-based virtual simulation. The higher binding abilities of IPA over the reported peptide (YP) were displayed on different cell lines, showing a positive correlation with GPC3 expressions, which were further verified by the GPC3 protein binding assay. The GPC3 targeting specificity of IPA was proved by peptide blocking and siRNA experiment. The localized anchor of peptide IPA on the cell membranes of HepG2 and Huh-7 with GPC3 overexpression confirmed the GPC3 binding capacity. By connecting a near-infrared dye MPA, the in vivo identification ability of IPA to GPC3 was also demonstrated on GPC3-positive (HepG2) and GPC3-negative (U87) xenograft-bearing mice. These results indicated that the designed IPA presented desirable GPC3 targeting ability, showing promising prospects in detecting the expression of GPC3 for HCC targeting imaging.
1. Introduction
Hepatocellular carcinoma (HCC) is the most common form of liver malignancy with increasing incidence over the last several decades, and it is the third leading cause of cancer-related mortality worldwide.1 Nowadays, the differential diagnosis of HCC without a pathological diagnosis mainly depends on methods that determine the serum α-fetoprotein (AFP) levels and diagnostic imaging, such as an abdominal computerized tomography (CT) scan and magnetic resonance imaging (MRI).2 Unfortunately, the prognosis of patients suffering from HCC is clinically very poor with a 5-year survival rate since most of them are diagnosed with advanced HCC stage.3 The reason behind this is that AFP lacks sufficient sensitivity and specificity, especially in small, well-differentiated HCC; also, CT/MRI imaging is limited to the spatial resolution and lack of tissue specificity.4 Hence, there is a need for more precise identification for improving HCC early diagnosis and targeted therapy.5,6More recently, Glypican-3 (GPC3) has been acknowledged as a sensitive and specific biomarker for HCC diagnosis.7 GPC3 is a 70 kDa protein anchored to the cell surface by glycosyl-phosphatidylinositol (GPI). The protein can be cleaved by furin into two subunits: a 40 kDa amino (N) terminal protein and a 30 kDa GPI-anchored membrane-bound carboxyl (C) terminal protein harboring two heparin sulphate side chains.8 GPC3 expression is not detected in normal, cirrhotic liver or non-neoplastic liver lesions of adults but conversely overexpressed in most HCC tumor tissues.9 Identification of soluble NH2-terminal fragment is reliable in serological examination with excellent sensitivity (40%–60%) and specificity (>90%) for early stage HCC.10 After positioning in cell membrane, GPC3 is also endowed with great prospects for accurate HCC imaging diagnosis. Thus, GPC3 might be more promising than AFP for HCC early diagnosis.
Advances in HCC imaging techniques can visualize the location of pathological changes and reduce the need for liver biopsy.11 Generally, contrast agent-based imaging is designed to recognize the lesion site mainly based on targeting materials.12 The current reported GPC3 targeting materials for potential HCC imaging mainly include peptides (TJ12P1,13 L5,14,15 GBP16), aptamer (AP613-117,18), and antibodies (1G12,19 αGPC3-F(ab′)2,20 GC33,21 YP7,22 HN323).
For HCC targeted imaging, anti-GPC3 antibodies, such as the commercially available antibody 1G12, are the common agents labeled with tracers.19 Sham et al. have developed 89Zr PET imaging of HCC conjugated with GPC3 mAb or F(ab′)2 fragments to distinguish from normal liver tissues.20 However, in the liver tissue, background signals derived from antibody-based agent can still be non-negligible since the liver is a largely metabolic organ for antibody clearance.24 The clinical utility of antibodies has also been mainly limited to their long circulation time, insufficient penetration depth, elevated immunogenicity and extensive optimization required for antibody-tracer.25
Numerous receptor-targeting peptides have been discovered and functionally designed for targeted molecular imaging such as somatostatin (SST) peptide, mesenchymal-epithelial transition factor (MET) peptide, Arg-Gly-Asp (RGD) peptide, matrix metalloproteinase (MMP) peptide, and bombesin/gastrin-releasing peptide (BBN/GRP).26 Compared with antibodies, targeting peptides possess many advantages for extensive applications, including reduced background signal, shorter half-life, superior tissue penetration, low immunogenicity, structural simplicity, and low cost.27 An increasing number of radiolabeled peptides have been translated into clinical practices with impressive diagnostic accuracy and sensitivity.28 The reported GPC3 targeting peptides have been used for NIR, PET imaging or fluorescent staining (Table S1†).
At present, the phage display platform has been used to identify new peptides binding specifically to target molecules but with complicated screening process,29 including TJ12P1 and GBP. In this study, we aim to utilize structure-based virtual simulation strategy to obtain a targeting peptide for identifying GPC3. We have noticed that the humanized antibody GC33 of high affinity, which recognizes the C-terminal of GPC3, is currently being evaluated in preclinical or clinical development for liver cancer therapy.23 By analyzing heavy-chain variable (VH) domain of GC33, here, we originally proposed a novel GPC3 C-terminal targeting peptide with a sequence of DYEMHLWWGTEL (denoted as IPA). The reported GPC3-targeting peptide TJ12P1 with a sequence of DHLASLWWGTEL (denoted as YP) was used as a positive control.13 The conformation of free peptide under the simulation was consistent with the binding state of 3D conformation, which highlighted the rationality and feasibility of the structural-based design. By linking with different tracers, we confirmed that this innovative peptide IPA could bind specifically to GPC3 with better affinity than YP in vitro and in vivo. Our results indicate that the peptide IPA, with excellent targeting, tissue penetration and biocompatibility, has great practical significance in HCC detection.
2. Experimental section
2.1 Materials and animals
The peptide YP with the sequence of DHLASLWWGTEL and the peptide IPA with the sequence of DYEMHLWWGTEL were synthesized and labeled with fluorescein FITC (purity ≥ 95%) by Karebay Biochem Ltd Ningbo, China (Fig. S1†). We also used GPC3 mAb (Sigma Aldrich), recombinant human GPC3 protein (Biolegend), Epic 384-well biosensor microplates (Corning), and Bradford protein assay (Bio-Rad). Other antibodies were purchased from Cell Signaling Technology (CST). The near-infrared dye MPA (Mw: 995) was prepared in our laboratory. All animals were purchased from Qinglongshan animal breeding grounds (Nanjing, China). All animal experiments were carried out in compliance with the Animal Management Rules of the Ministry of Health of the People's Republic of China (document no. 55, 2001) and the guidelines for the Care and Use of Laboratory Animals of China Pharmaceutical University. All the animals involved were treated in accordance with protocols evaluated and approved by the Ethical Committee of China Pharmaceutical University.2.2 Structure-based molecular docking and simulation
The GPC3 protein sequence was submitted to the Swiss-model website (http://www.swissmodel.expasy.org/) to select the appropriate template for the homologous modeling. So far, structure-based molecular docking had been considered as one of the important methods for drug discovery and enhancing the efficiency in lead optimization. To investigate the detailed intermolecular interactions, the molecular operating environment (MOE) program was used to perform various steps involved in docking simulation. GPC3 model was used as a protein molecule template. Hydrogens were added, solvent molecules were removed, Gasteiger partial charges were computed and energy minimization was carried out using the Merck Molecular Force Field 94× (MMFF94×) force field. The peptides were docked into the active site by means of the default triangle matcher algorithm from PEP-SiteFinder website. The peptides with the best conformation and low energy were taken for the molecular dynamic (MD) simulation analysis. MD simulation was performed with a GROMACS-5.0.7 package with GROMOS 96 43a1 force field in dodecahedron box of a simple point charge. Three Cl− ions were replaced with solvent molecules to attain system neutrality. Energy minimization was carried out with the steepest descent of 100![[thin space (1/6-em)]](https://www.rsc.org/images/entities/char_2009.gif) 000 steps. To extend the equilibrium, the system was subjected to position-restrained dynamic simulation (NVT and NPT) with 100
000 steps. To extend the equilibrium, the system was subjected to position-restrained dynamic simulation (NVT and NPT) with 100![[thin space (1/6-em)]](https://www.rsc.org/images/entities/char_2009.gif) 000 steps at 300 K temperature. Finally, MD was performed at 300 K temperature for 100 ns.
000 steps at 300 K temperature. Finally, MD was performed at 300 K temperature for 100 ns.
2.3 Cell culture
All the cell lines, including HepG2, Huh-7, U87, HUVEC and L-02, were purchased from American Type Culture Collection (ATCC, USA). All cells were cultured in DMEM or RPMI-1640 medium supplemented with 10% (v/v) fetal bovine serum, maintaining a humidified atmosphere containing 5% CO2 at 37 °C.2.4 Protein expression of GPC3 by western blot
The cells were lysed in RIPA buffer and the protein concentration was measured by Bradford protein assay. Next, 20 μg of extracted proteins were separated and electroblotted onto PVDF membranes. Membranes were blocked in 5% non-fat milk in TBST for about 1 h, incubated with primary anti-GPC3 antibodies overnight (1![[thin space (1/6-em)]](https://www.rsc.org/images/entities/char_2009.gif) :
:![[thin space (1/6-em)]](https://www.rsc.org/images/entities/char_2009.gif) 500), and then washed thrice with TBST. Finally, the membranes were incubated with the secondary HRP conjugated secondary antibodies. Protein bands were detected using an ECL system. GPC3 expressions in the different cell lines were calculated in relation to β-actin expression.
500), and then washed thrice with TBST. Finally, the membranes were incubated with the secondary HRP conjugated secondary antibodies. Protein bands were detected using an ECL system. GPC3 expressions in the different cell lines were calculated in relation to β-actin expression.
2.5 GPC3 binding assay on cells
All the cell lines were seeded in six-well plates at a density of 1 × 10⁶ cells per mL. After 24 h of cultivation, the medium was replaced by 2 mL fresh medium containing YP-FITC or IPA-FITC (0.5 μM) and incubated separately for 4 h. The cells were washed thrice with PBS to remove the unbound peptides. Then, the cells were detached by trypsin solution, gently resuspended in 300 μL PBS and stored in the dark in BD falcon tubes on ice for flow cytometry analysis excited at 488 nm (FL1). The raw flow data analysis was presented as the mean fluorescence intensity (MFI) using FlowJo software and GraphPad Prism 6.0 software.2.6 Dynamic mass redistribution (DMR) assay
The HepG2 cells were directly seeded onto 384-well Epic sensor microplates in 40 μL DMEM medium and cultured for 24 h to obtain confluent monolayers. After removal of medium, cells were washed with HBSS containing 20 mM HEPES. Then, a 2 min baseline was established and the peptide YP or IPA at a fixed dose (from 0 μM to 160 μM) was added immediately. The cells were kept in the Epic reader at a constant temperature of 28 °C for 2 h to obtain the responses (pm). EC50 values were determined by the nonlinear regression analysis using GraphPad Prism 6.0 software.2.7 Fluorescent polarization (FP) assay
This assay was developed in a 384-well plate in three independent experiments. After determination of the lowest concentration of YP-FITC or IPA-FITC that gave a consistent FP value, this concentration (10 nM) was fixed and increasing amounts of rGPC3 protein (0 to 1080 nM) were added for 30 min incubation. The values (mP) of FP were measured at 485 nm excitation and 535 nm emission. The percentage binding at each concentration point was determined by using equation % inhibition = (P − Pmin)/(Pmax − Pmin). The values of P, Pmin and Pmax correspond to the polarization containing the rGPC3 protein at a range of concentrations, the polarization of the free protein and the polarization of protein saturation.2.8 Peptide blocking assay
The HepG2 cells seeded in six-well plates were blocked with IPA at different concentrations (0, 2.5, 5, 10 and 20 μM) for 4 h. Then, IPA-FITC (0.5 μM) was added and cultured for another 4 h. Cells were detached from flasks and gently resuspended in 300 μL of PBS at a density of 105 cells per mL for flow cytometry analysis.2.9 siRNA transfection
Briefly, the HepG2 cells were plated into six-well plates and were treated with negative control (NC, scrambled sequence) or GPC3 siRNA. The sequence for GPC3 siRNA was 5′-GGC UCU GAA UCU UGG AAU Utt-3′. After transfection, IPA-FITC (0.5 μM) was added for 4 h incubation. The untransfected HepG2 cells with FITC or IPA-FITC incubation were used as a control.2.10 Cell imaging
To observe the cellular location of peptide-FITC, HepG2, U87, Huh-7 or L-02 cells were all seeded on confocal petri dishes at a density of 3 × 10⁵ cells per well and grown for 24 h at 37 °C in 5% CO2. Then, the HepG2 cells were incubated with IPA-FITC (0.5 μM) for different incubation times (0, 1, 2, 4 and 6 h), and other cells were incubated for 4 h. The nucleus was stained with 100 μL Hoechst 33342 solution for 30 min. For specificity exploration, the HepG2 cells were pretreated with transfecting siRNA or peptide IPA (10 μM) followed by incubation with IPA-FITC and Hoechst 33342. After incubation, cells were washed thrice with PBS (pH 7.4). The fluorescence images were obtained using a confocal laser scanning microscope (CLSM, Olympus FV1000).2.11 Synthesis of peptides–MPA conjugates
First, MPA (5.0 mg) was activated with EDC and NHS (molar ratio of MPA![[thin space (1/6-em)]](https://www.rsc.org/images/entities/char_2009.gif) :
:![[thin space (1/6-em)]](https://www.rsc.org/images/entities/char_2009.gif) EDC
EDC![[thin space (1/6-em)]](https://www.rsc.org/images/entities/char_2009.gif) :
:![[thin space (1/6-em)]](https://www.rsc.org/images/entities/char_2009.gif) NHS was 1
NHS was 1![[thin space (1/6-em)]](https://www.rsc.org/images/entities/char_2009.gif) :
:![[thin space (1/6-em)]](https://www.rsc.org/images/entities/char_2009.gif) 1.2
1.2![[thin space (1/6-em)]](https://www.rsc.org/images/entities/char_2009.gif) :
:![[thin space (1/6-em)]](https://www.rsc.org/images/entities/char_2009.gif) 1.5) dissolved in ultrapure water. The mixture was left at room temperature in the dark for 4 h. Then, the solution was mixed with peptide YP or IPA (1 mg) and stirred overnight. Subsequently, the crude product was purified by Sephadex G25 column with ultrapure water. At last, the final product was concentrated by drying on a rotary evaporator. The absorption and fluorescence spectra of IPA-MPA and YP-MPA were detected.
1.5) dissolved in ultrapure water. The mixture was left at room temperature in the dark for 4 h. Then, the solution was mixed with peptide YP or IPA (1 mg) and stirred overnight. Subsequently, the crude product was purified by Sephadex G25 column with ultrapure water. At last, the final product was concentrated by drying on a rotary evaporator. The absorption and fluorescence spectra of IPA-MPA and YP-MPA were detected.
2.12 Animal imaging experiments
The mice bearing HepG2 or U87 tumors were divided into three groups, which were respectively injected with the equivalent solutions (150 μL, 5 mM) of MPA, YP-MPA or IPA-MPA via the tail vein. Bilateral tumor model was injected with equivalent IPA-MPA. The mice were monitored by using a near-infrared (NIR) fluorescence imaging system made in our laboratory at scheduled time points (1, 2, 4, 6, 8, 10, 12, 24 h). The background image of the mice was taken prior to the injection (defined as 0 h). Signal in tumor to normal tissue contrast ratios (T/N) at different times were calculated using ROI functions with Scion Image software. The major organs including heart, liver, spleen, lung, kidney, and tumor were collected for ex vivo fluorescence imaging at 6 h post-injection. These tissues were also embedded in OCT compound for examination of frozen sections with a thickness of 10 μm. The white-light and fluorescent pictures of sections were obtained by using a fluorescence microscope (Leica DM 4000 B) at 780 nm excitation.2.13 Statistical analysis
Statistical analysis was performed using GraphPad Prism 6.0 software and results were expressed as mean ± SD. Two-tailed paired and unpaired Student's t-tests were used to test differences within groups and between groups, respectively. Differences of P < 0.05 were determined statistically significant.3. Results and discussion
3.1 Structure-based simulation
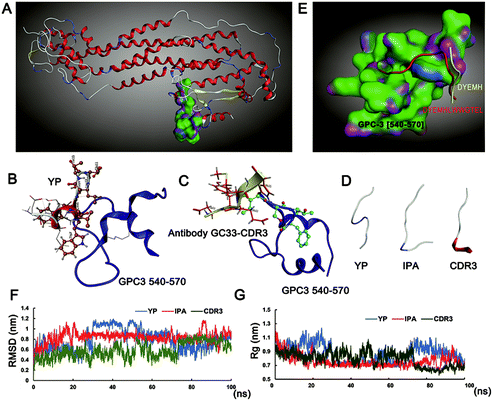
The Swiss-model was used to build the model of the GPC3 protein by piecewise homology (Fig. 1A). The important residues of peptide YP and antibody GC33-CDR3 (complementarity determining region) are shown in Fig. 1B and C, respectively. After rational design and fusion, the peptide IPA's conformation was allowed to fold freely during the simulation times, and the conformations of YP, IPA, CDR3 are shown in Fig. 1D. The docking of antibody-GC33-CDR3 (DYEMH) and peptide YP with the C-terminal binding region of GPC3 protein was carried out, and their binding modes are quoted in Fig. 1E. The docked complexes were subjected to 100 ns MD simulation in aqueous solution; the stability and compactness of system were calculated by root mean square deviation (RMSD) and radius of gyration (Rg), respectively. The RMSD and Rg values observed for the complexes showed that the system was well converged (Fig. 1F and G). These results illustrated that IPA possessed good GPC3 binding ability according to our design on reasonable residue and conformation.3.2 Binding affinity of peptides
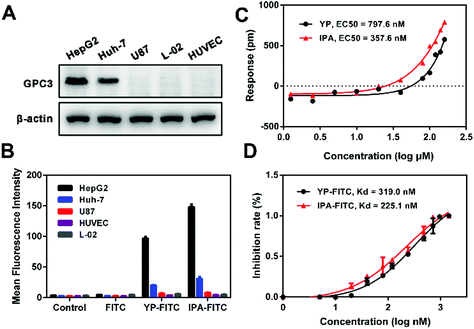
First, western blot showed high expression levels of GPC3 in HCC cell lines (HepG2 > Huh-7), whereas minimal expressions in U87, HUVEC and L-02 cells were observed (Fig. 2A). Incubation of the cells with FITC-labeled peptides resulted in changes in MFI compared with that in control or FITC incubation (Fig. S2†). On HepG2 and Huh-7 cells, the MFI values of IPA-FITC were 151 and 28, and the MFI values of YP-FITC were 106 and 23 respectively; also, the MFI values of two probes were all less than 10 on U87, HUVEC and L-02 cells (Fig. 2B). Thus, there was a strong correlation between the fluorescence signal and the expression level of GPC3. These results potentially suggested that the probe of IPA-FITC could specifically bind to GPC3 on tumor cell membranes.The dynamic mass redistribution (DMR) assay is a label-free screening method for the determination of direct biomolecular interactions.30 The DMR concentration–response curves showed that both YP and IPA triggered a gradually increasing trend on HepG2 cells in a dose-dependent manner (Fig. S3†). The EC50 value was 797.6 nM for YP and 357.6 nM for IPA (Fig. 2C). Then, we examined the binding affinity with purified GPC3 protein by fluorescent polarization (FP) assay, which showed that IPA-FITC possessed greater affinity (Kd = 225.1 nM) than YP-FITC (Kd = 319.0 nM) (Fig. 2D). The GPC3 protein binding Kd of IPA was also lower than that of GBP (Table S1†). These experiments together indicated that the designed peptide IPA possessed better GPC3 binding affinity compared with the reported peptide YP.
3.3 The binding specificity
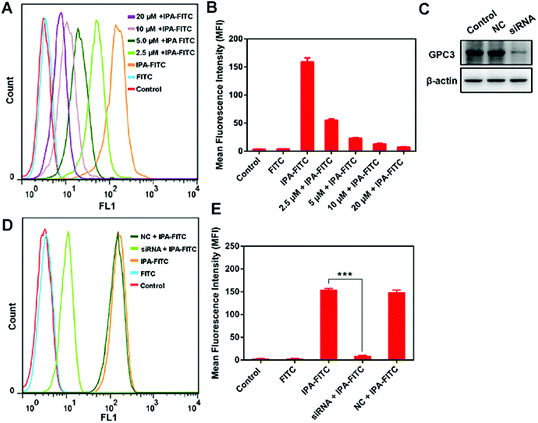
To exclude the existence of non-specific binding of IPA, we carried out peptide blocking assay and siRNA assay. In blocking experiment, HepG2 cells were pre-incubated with varying levels of IPA followed by the addition of IPA-FITC. MFI was gradually weakened with the increase in IPA in group IPA-FITC (Fig. 3A and B). This was probably because the binding sites of existing GPC3 were occupied by IPA, leading to reduced combination of subsequent IPA-FITC. The GPC3 siRNA transfection significantly attenuated the expression level of GPC3 ( Fig. 3C). MFI in group siRNA + IPA-FITC was significantly reduced compared with that in IPA-FITC group (p = 0.000) (Fig. 3D and E). The transfection assay also verified the binding specificity of IPA for GPC3.3.4 Cellular imaging of targeted localization
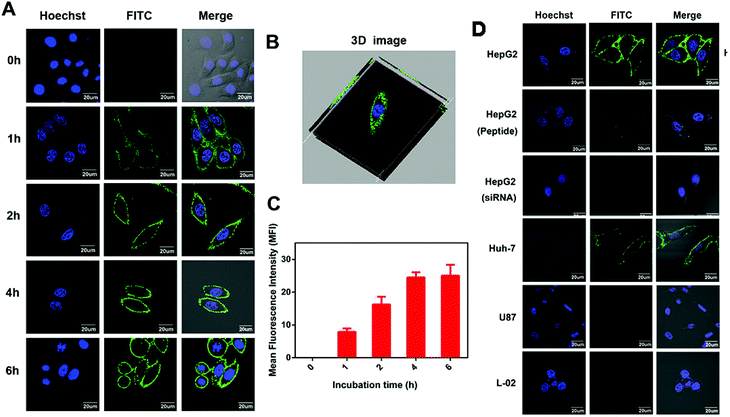
Next, to investigate the cellular localization, we performed confocal imaging of IPA-FITC on GPC3-positive HepG2 cells in time gradient. The intense fluorescence of IPA-FITC appeared distinctly on the cell membrane, which is seen more clearly in the 3D image (Fig. 4A and B). After fluorescence quantification, MFI gradually increased with the incubation time and reached a plateau at 4 h (Fig. 4C). When HepG2 cells were pre-treated with IPA or siRNA interference, slight fluorescence was present in the membrane (Fig. 4D). Additionally, we also found that IPA-FITC was only attached to the membrane of GPC3-positive Huh-7 cells but not U87 or L-02 cells (Fig. 4D). This was in accordance with the flow cytometry results that the targeting ability was correlated with GPC3 expression. Cellular imaging results further validated that IPA-FITC could label the tumor cell membrane through the GPC3 targeting ability. These motivated us to use IPA for the identification of HCC xenograft in vivo.3.5 Biosafety evaluation in vitro and in vivo
It was well-known that GPC3 can promote the growth of HCC by stimulating canonical Wnt/β-catenin signaling pathway and regulating the survival-associated Erk and Akt.31 The results showed that IPA exhibited indistinctive influence on the phosphorylation and total protein level of β-catenin, Erk and Akt at the used concentration (Fig. S4†). Consequently, peptide IPA might possess slight pharmacological effect in activating or inhibiting the downstream signaling pathway. In the MTT assay, all the three cell lines incubated with IPA still retained a high survival rate of more than 80% at all predetermined concentrations, showing the low cytotoxicity of IPA (Fig. S5†). Corresponding to the confocal imaging, all the cellular morphologies did not change significantly due to nontoxicity.Moreover, acute toxicity was investigated to determine the potential side effects of IPA. The IPA treatment exhibited negligible influence on the concentration of alanine aminotransferase (ALT), aspartate aminotransferase (AST), blood urea nitrogen (BUN), and creatinine (CRE) in comparison with those of PBS control group (Fig. S6A and B†). H&E staining indicated that IPA also caused unclear pathological damages in all the major organs (Fig. S6C†). The biosafety evaluation consistently demonstrated that IPA might possess good biocompatibility for further application in vivo.
3.6 In vivo tumor targeting ability
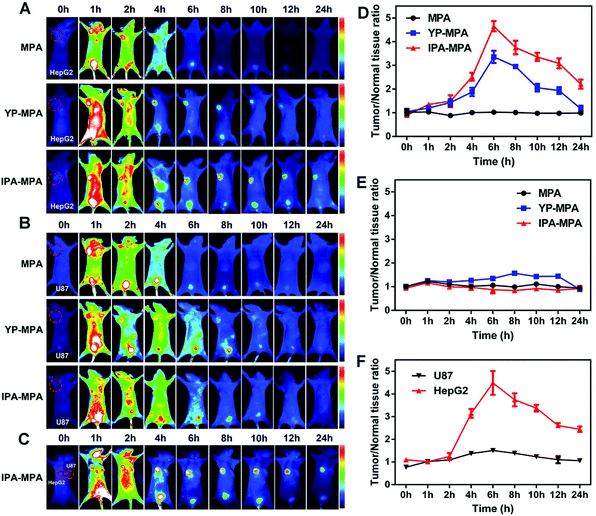
To analyze the in vivo selective targeting ability, peptide YP or IPA was conjugated with an NIR fluorescence dye MPA to construct probes named as YP-MPA or IPA-MPA, respectively, with emission wavelength at about 830 nm (Fig. S7 and S9†). In GPC3-positive HepG2 tumor, the fluorescence signals in both YP-MPA and IPA-MPA groups were distributed all over the body at 1 h post-injection. The tumors could be accurately identified from the surrounding normal tissues at about 4 h post-injection. In particular, the fluorescence signals in the above groups reached peak intensity at 6 h post-injection and gradually weakened to 24 h (Fig. 5A). The maximum of T/N was 3.5 for YP-MPA and 4.8 for IPA-MPA at 6 h. The results preliminarily proved that IPA-MPA exhibited more distinguishing ability in vivo than YP-MPA from 4 h to 24 h (P = 0.006) (Fig. 5D).On the contrary, there was no clear fluorescence signal in GPC3-negative U87 tumor injected with MPA, YP-MPA or IPA-MPA within 24 h (Fig. 5B and E). In addition, fluorescence barely appeared in the tumor site in free MPA-treated HepG2 or U87 tumor model. Furthermore, in bilateral tumor model injected with IPA-MPA, intense fluorescence only appeared in HepG2 tumor rather than in U87 tumor, also illustrating the targeting specificity (Fig. 5C and F).
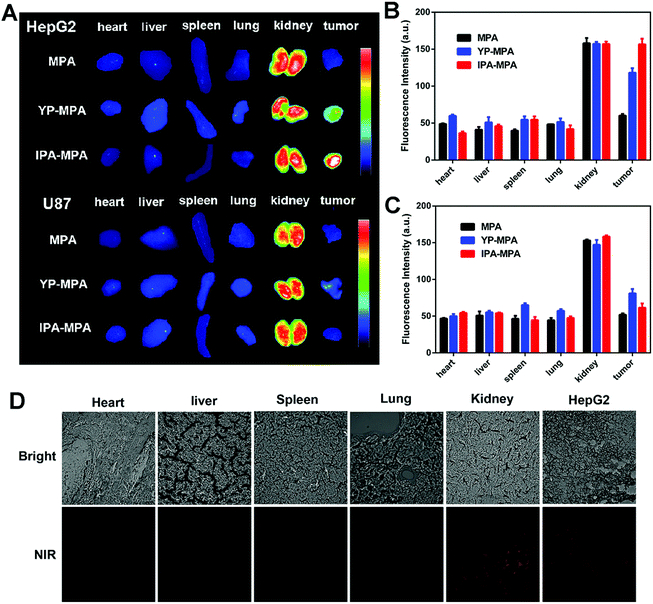
Subsequently, HepG2 and U87 tumor-bearing mice were excised for ex vivo imaging at 6 h post-injection. Compared with YP-MPA, IPA-MPA group showed stronger fluorescence in HepG2 tumor (P = 0.001), whereas negligible fluorescence in U87 tumor was observed (Fig. 6A–C). The fluorescence was observed in the kidney in all groups, confirming the elimination of IPA–MPA by kidney metabolism (Fig. 6A). Besides, only kidney and HepG2 tumors displayed intense fluorescence in frozen section slices, which were consistent with the above results of organ biodistribution (Fig. 6D). Also, IPA showed satisfactory serum stability in rat plasma over 24 hours for reaching its diagnostic abundance (Fig. S10†). Together, the in vivo results indicated that IPA–MPA exhibited higher targeting ability for visualization in tumor with GPC3 expression.
4. Conclusion
In recent years, GPC3 has been clinically validated and applied as a promising indicator for diagnosis and treatment of HCC.32 Peptide-based molecular probes have been rapidly evolving for their potentially high significance for clinical translation.33 Thus, GPC3 targeting peptide for peptide-based imaging approaches is not only convenient for early diagnosis of HCC but also provides useful insights into the driving oncogenesis.34In this study, we have designed an innovative GPC3 targeting peptide for HCC diagnosis. We choose C-terminal domain as the recognition site because the C-terminal subunit is invariably anchored to the cell membrane by disulfide bonds for better targeting as compared with the partially hydrolyzed N-terminal domain. Compared with YP-FITC, IPA-FITC was more efficient to distinguish the GPC3-positive HCC cells (HepG2 and Huh-7) from the cell lines with minimal GPC3 expression by flow cytometry analysis. IPA showed better affinity than YP by DMR and FP assays. More importantly, the specificity of IPA was further verified by blocking or down-regulating GPC3. Especially, the probe IPA-FITC was visualized to specifically anchor on GPC3-positive tumor cell membrane. In the aspect of biocompatibility, the peptide IPA showed negligible cytotoxicity or animal toxicity. These superior characteristics of IPA encouraged us to explore its in vivo targeting ability. The NIR probe IPA–MPA exhibited higher imaging ability for detecting GPC3-positive HepG2 tumor xenografts than YP-MPA, which was consistent with the results of ex vivo analyses of major organs and tumors. This targeting ability was specific as negligible fluorescence was observed in GPC3-negative U87 xenografts. Besides, the physicochemical properties of reported peptides were predicted by using an online server HLP (Table S2†). The results show that peptide IPA has optimal relative stability, polarity and heat capacity.
In summary, this study demonstrates that the designed peptide IPA exhibits improved GPC3 binding ability compared with reported YP. The peptide IPA possesses desirable properties of targeting ability, stability, low immunogenicity and toxicity for imaging-guided diagnosis, which further validated the feasibility of our design method. Ongoing basic research still needs to be performed for complete evaluation of IPA for clinical validation studies. We anticipate that this peptide will promote the development of peptide-based probes and drugs for early HCC theranostics.
Conflicts of interest
There are no conflicts to declare.Acknowledgements
We acknowledge financial support from the National Natural Science Foundation of China (NSFC 81220108012, 61335007, 81371684, 81000666, 81171395, 81328012 and 81729002).Notes and references
- L. A. Torre, F. Bray, R. L. Siegel, J. Ferlay, J. Lortet-tieulent and A. Jemal, CA-Cancer J. Clin., 2015, 65, 87–108 CrossRef PubMed.
- C. Schraml, S. Kaufmann, H. Rempp, R. Syha, D. Ketelsen, M. Notohamiprodjo and K. Nikolaou, Diagnostics, 2015, 5, 513–545 CrossRef CAS PubMed.
- M. Ho and H. Kim, Eur. J. Cancer, 2011, 47, 333–338 CrossRef CAS PubMed.
- H. F. Ahmed Mohammed and L. R. Roberts, Curr. Hepatol. Rep., 2017, 16, 137–145 CrossRef PubMed.
- H. Cheng, Z. Wu, C. Wu, X. Wang, S. S. Liow, Z. Li and Y. L. Wu, Mater. Sci. Eng., C, 2018, 83, 210–217 CrossRef CAS PubMed.
- X. Chen, Z. Chen, B. Hu, P. Cai, S. Wang, S. Xiao, Y.-L. Wu and X. Chen, Small, 2018, 14, 1703164 CrossRef PubMed.
- L. Di Tommaso, A. Destro, J. Y. Seok, E. Balladore, L. Terracciano, A. Sangiovanni, M. Iavarone, M. Colombo, J. J. Jang, E. Yu, S. Y. Jin, E. Morenghi, Y. N. Park and M. Roncalli, J. Hepatol., 2009, 50, 746–754 CrossRef CAS PubMed.
- Y. Haruyama and H. Kataoka, World J. Gastroenterol., 2016, 22, 275–283 CrossRef CAS PubMed.
- I. P. Chen, S. I. Ariizumi, M. Nakano and M. Yamamoto, J. Gastroenterol., 2014, 49, 117–125 CrossRef CAS PubMed.
- M. Capurro, I. R. Wanless, M. Sherman, G. Deboer, W. Shi, E. Miyoshi and J. Filmus, Gastroenterology, 2003, 125, 89–97 CrossRef CAS.
- E. B. Tapper and A. S.-F. Lok, N. Engl. J. Med., 2017, 377, 756–768 CrossRef PubMed.
- B. R. Smith and S. S. Gambhir, Chem. Rev., 2017, 117, 901–986 CrossRef CAS PubMed.
- D. Zhu, Y. Qin, J. Wang, L. Zhang, S. Zou, X. Zhu and L. Zhu, Bioconjugate Chem., 2016, 27, 831–839 CrossRef CAS PubMed.
- Z. Wang, Y.-J. Han, S. Huang, M. Wang, W.-L. Zhou, H.-S. Li, Q.-S. Wang and H.-B. Wu, Amino Acids, 2018, 50, 309–320 CrossRef CAS PubMed.
- Y. La Lee, B. C. Ahn, Y. Lee, S. W. Lee, J. Y. Cho and J. Lee, J. Pept. Sci., 2011, 17, 763–769 CrossRef PubMed.
- Z. Qin, J. Wang, Y. Wang, G. Wang, X. Wang, Z. Zhou, G. Liu, S. Gao and L. Zhu, Macromol. Biosci., 2017, 17, 1600335 CrossRef PubMed.
- M. Zhao, Z. Liu, L. Dong, H. Zhou, S. Yang, W. Wu and J. Lin, Int. J. Nanomed., 2018, 13, 4433–4443 CrossRef PubMed.
- M. Zhao, L. Dong, Z. Liu, S. Yang, W. Wu and J. Lin, Quant. Imaging Med. Surg., 2018, 8, 151–160 CrossRef PubMed.
- X. Yang, H. Liu, C. K. Sun, A. Natarajan, X. Hu, X. Wang, M. Allegretta, R. D. Guttmann, S. S. Gambhir, M. S. Chua, Z. Cheng and S. K. So, Biomaterials, 2014, 35, 6964–6971 CrossRef CAS PubMed.
- J. G. Sham, F. M. Kievit, J. R. Grierson, R. S. Miyaoka, M. M. Yeh, M. Zhang, R. S. Yeung, S. Minoshima and J. O. Park, J. Nucl. Med., 2014, 55, 799–804 CrossRef CAS PubMed.
- T. Ishiguro, M. Sugimoto, Y. Kinoshita, Y. Miyazaki, K. Nakano, H. Tsunoda, I. Sugo, I. Ohizumi, H. Aburatani, T. Hamakubo, T. Kodama, M. Tsuchiya and H. Yamada-Okabe, Cancer Res., 2008, 68, 9832–9838 CrossRef CAS PubMed.
- Y. Phung, W. Gao, Y. Man, S. Nagata and M. Ho, mAbs, 2012, 4, 592–599 CrossRef PubMed.
- M. Feng, W. Gao, R. Wang, W. Chen, Y.-G. Man, W. D. Figg, X. W. Wang, D. S. Dimitrov and M. Ho, Proc. Natl. Acad. Sci. U. S. A., 2013, 110, E1083–E1091 CrossRef CAS PubMed.
- S. Kaur, G. Venktaraman, M. Jain, S. Senapati, P. K. Garg and S. K. Batra, Cancer Lett., 2012, 315, 97–111 CrossRef CAS PubMed.
- T. Olafsen and A. M. Wu, Semin. Nucl. Med., 2010, 40, 167–181 CrossRef PubMed.
- X. Sun, Y. Li, T. Liu, Z. Li, X. Zhang and X. Chen, Adv. Drug Delivery Rev., 2017, 110–111, 38–51 CrossRef CAS PubMed.
- H. Cui and X. Chen, Adv. Drug Delivery Rev., 2017, 110–111, 1–2 CrossRef CAS PubMed.
- K. Chen and P. S. Conti, Adv. Drug Delivery Rev., 2010, 62, 1005–1022 CrossRef CAS PubMed.
- C.-H. Wu, I.-J. Liu, R.-M. Lu and H.-C. Wu, J. Biomed. Sci., 2016, 23, 8 CrossRef PubMed.
- Y. Nazirizadeh, V. Behrends, A. Prósz, N. Orgovan, R. Horvath, A. M. Ferrie, Y. Fang, C. Selhuber-Unkel and M. Gerken, Sci. Rep., 2016, 6, 24685 CrossRef CAS PubMed.
- W. Gao, Z. Tang, Y. Zhang, M. Feng, M. Qian, D. S. Dimitrov and M. Ho, Nat. Commun., 2015, 6, 6536 CrossRef CAS PubMed.
- C. Chen, X. Huang, Z. Ying, D. Wu, Y. Yu, X. Wang and C. Chen, Clin. Transl. Med., 2017, 6, 18 CrossRef PubMed.
- S. Lee, J. Xie and X. Chen, Biochemistry, 2010, 49, 1364–1376 CrossRef CAS PubMed.
- M. Montalbano, J. Georgiadis, A. L. Masterson, J. T. McGuire, J. Prajapati, A. Shirafkan, C. Rastellini and L. Cicalese, Oncol. Rep., 2017, 37, 1291–1300 CrossRef CAS PubMed.
Footnotes |
| † Electronic supplementary information (ESI) available. See DOI: 10.1039/c8bm01016a |
| ‡ These authors contributed equally to this work. |
| This journal is © The Royal Society of Chemistry 2019 |

