Organic semiconducting nanoprobe with redox-activatable NIR-II fluorescence for in vivo real-time monitoring of drug toxicity†
Yufu
Tang‡§
a,
Yuanyuan
Li‡
a,
Zhen
Wang
a,
Feng
Pei
b,
Xiaoming
Hu
a,
Yu
Ji
a,
Xiang
Li
a,
Hui
Zhao
a,
Wenbo
Hu
 a,
Xiaomei
Lu
b,
Quli
Fan
 *a and
Wei
Huang
abc
aKey Laboratory for Organic Electronics and Information Displays & Jiangsu Key Laboratory for Biosensors, Institute of Advanced Materials (IAM), Jiangsu National Synergetic Innovation Center for Advanced Materials (SICAM), Nanjing University of Posts & Telecommunications (NUPT), Nanjing 210023, China. E-mail: iamqlfan@njupt.edu.cn
bKey Laboratory of Flexible Electronics (KLOFE), Institute of Advanced Materials (IAM), Jiangsu National Synergetic Innovation Center for Advanced Materials (SICAM), Nanjing Tech University (Nanjing Tech), Nanjing 211816, China
cShaanxi Institute of Flexible Electronics (SIFE), Northwestern Polytechnical University (NPU), Xi’an 710072, China
First published on 13th November 2018
Abstract
An activatable organic semiconducting nanoprobe that specifically turns on its second near-infrared window fluorescence upon being exposed to nitric oxide stimuli was developed for in vivo, in situ, real-time and high-spatial-resolution mapping of drug-induced hepatotoxicity.
Drug toxicity is one of the most common concerns for most practitioners of modern medicine.1 The liver, whose central role is to transform and clear exogenous and endogenous xenobiotics in the human body, is often the organ most affected by drug toxicity, and its failure can result in death. Drug-induced hepatotoxicity is a critical factor causing the rejection of drug marketing license applications.1 Thus, innovative preclinical screening methods for drug-induced hepatotoxicity hold great promise for reducing hepatotoxicity, improving patient safety, and increasing the therapeutic effect. Currently, the screening methods mainly rely on using chemiluminescence and near-infrared (NIR-I, 400–900 nm) fluorescence to image the biomarker used for evaluating drug-induced hepatotoxicity.1,2 Although promising, chemiluminescence is not suitable for persistent observation. NIR-I fluorescence suffers from the general limitations of the strong autofluorescence in the liver and limited light penetration depth in vivo. These problems make these techniques relatively poor at imaging the liver in vivo. In contrast to NIR-I fluorescence imaging, in vivo fluorescence imaging within the second near-infrared window (NIR-II, 1000–1700 nm) holds great promise for providing deeper tissue penetration and higher spatial resolution owing to its diminished tissue autofluorescence, photon scattering and absorption.3
Although NIR-II fluorescence imaging is now the most effective and in fact unparalleled optical technique for monitoring drug-induced hepatotoxicity, the visualization of hepatotoxicity-related biomarkers in the liver of a living organism is still difficult. The main reason for this difficulty lies in the lack of an effective probe for identifying exactly the biomarker in the complex and dynamic pathological environment of drug-induced hepatotoxicity. Despite the development of various NIR-II fluorescent probes such as carbon nanotubes,4 quantum dots,5 small molecules,6 polymers,7 and rare-earth nanoparticles,8 most of them are “always-on” probes that emit signals regardless of whether they reach the target site. Their biomarker detection mechanism completely relies on a receptor on the probe surface to bind the biomarker to provide an increased signal-to-noise ratio.9 Thus these “always-on” probes suffer from the general limitations of an extremely high background, making it difficult to detect the biomarker in the liver, in particular because the liver is the main organ that would accumulate and clear an exogenous probe.10 By contrast, activatable probes that are initially in the “off” state and that only emit signals under biomarker stimulation are especially preferable and important for achieving low background and high sensitivity for biomarker detection in the liver.11 However, the development of activatable NIR-II fluorescent probes is still in its infancy, not to mention the development of such probes suitable for monitoring hepatotoxicity.
Nitric oxide (NO), a specific redox species, has been proposed to be an early unifying, direct and vital biomarker for drug-induced hepatotoxicity.1,12 Herein, we designed and synthesized an activatable organic semiconducting nanoprobe (AOSNP) that specifically turns on its NIR-II fluorescence upon being stimulated with NO for in vivo, in situ, real-time and non-invasive monitoring of drug-induced hepatotoxicity (Fig. 1). The AOSNP was designed to contain an NO-sensitive organic semiconducting group (FTBD) as the primary sensing component that can transform its energy acceptor units (benzo[c][1,2,5]thiadiazole-5,6-diamine) into stronger acceptors (benzotriazole derivatives) in the presence of NO, and thus shift its fluorescence from the NIR-I region to the NIR-II region. The nanoprobe allowed superior passive targeting of the liver,10 permitting in situ, real-time and non-invasive NIR-II fluorescence mapping of dose-dependent NO activity resulting from hepatotoxicity caused by a commonly used anti-pain/fever drug, acetaminophen (APAP), in live mice.
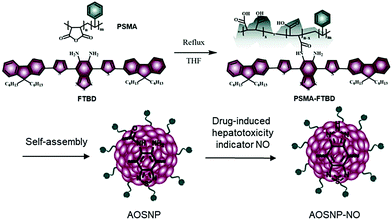 | ||
| Fig. 1 Design and synthesis of the activatable organic semiconducting nanoprobes (AOSNP) used for NIR-II fluorescence imaging of the NO mechanism. | ||
The AOSNP was synthesized from FTBD and a poly(styrene-co-maleic anhydride) (PSMA) polymer by carrying out an amidation reaction (details in the ESI†). The PSMA was used to endow the probes with good water solubility. The AOSNP particles were all of similar dimensions, on average about 28 nm as shown by dynamic light scattering (DLS) (Fig. 2a) and transmission electron microscopy (TEM) (Fig. 2a inset). The AOSNP particle size did not change much after being stored either in phosphate buffered saline (PBS) or fetal bovine serum (FBS) for 3 days, indicating its good structure stability (Fig. 2b).
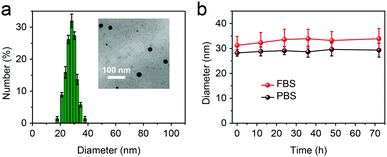 | ||
| Fig. 2 (a) DLS results and TEM image (inset) of the AOSNP. (b) The AOSNP particle size did not change much after being stored either in PBS or FBS for 3 days. | ||
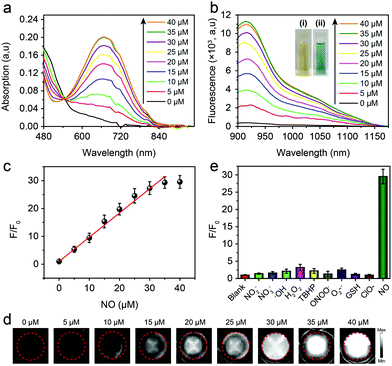
The optical properties of the AOSNP toward NO were first investigated. In the absence of NO, the AOSNP showed negligible absorption of light of a wavelength of 808 nm (Fig. 3a) and a negligible NIR-II fluorescence emission (Fig. 3b). By contrast, upon addition of NO, the intensity of the absorption of wavelengths shorter than 540 nm by the AOSNP gradually decreased, and a new maximum peak at 680 nm gradually appeared (Fig. 3a). Concomitantly, the color of the solution also changed from yellow to blue-green (Fig. 3b inset). And the NIR-II fluorescence emission of the AOSNP gradually increased (Fig. 3b). The areas under the curves in the emission spectra (1000–1700 nm) indicated that the NIR-II fluorescence intensity increased about 35-fold after addition of NO (40 µM) (Fig. 3b). Such large emission enhancement may be attributed to the energy acceptor unit (benzo[c][1,2,5]thiadiazole-5,6-diamine) in FTBD transforming into a stronger acceptor (benzotriazole derivatives) in the presence of NO (Fig. 1). Next, we recorded the corresponding NIR-II fluorescence images of the AOSNP in the presence of various concentrations of NO, and the images are shown in pseudo white in Fig. 3d. The NIR-II fluorescence (white signals) in the images showed a gradual increase in intensity, and eventually reached a point of saturation, as the concentration of NO was increased. The fluorescence intensity ratio F/F0 (where F0 indicates the fluorescence intensity of the AOSNP without NO and F is the fluorescence intensity in the presence of the indicated concentration of NO) showed an excellent linear relationship (R2 = 0.9961) with NO concentration over a wide range of NO concentrations, namely 0–35 µM (Fig. 3c). The detection limit (3σ/slope) of the AOSNP for NO was determined to be as low as 0.35 µM. Such a low detection limit is suitable for NO detection in vivo.12 In addition, the reaction kinetics of the AOSNP toward NO showed a short response, within 3 min (Fig. S1, ESI†), indicating a potential for real-time imaging of NO.
To test the specificity of the AOSNP for NO, the NIR-II fluorescence of the AOSNP in a PBS solution was measured with NO and was also measured with other biologically relevant analytes, including reactive oxygen species (H2O2, ˙OH, NO, O2˙−, ONOO−) and reductive thiols (glutathione, GSH) at higher concentrations (100 µM). The AOSNP exhibited an excellent increase in its fluorescence intensity after being treated with as little as 35 µM NO (Fig. 3e). By contrast, a negligible increase in the intensity of the NIR-II fluorescence was observed even upon treatment with 100 µM of other biologically relevant analytes. These results revealed the apparent selectivity of the AOSNP for NO. Additionally, we measured F/F0 values of the AOSNP treated with NO in various pH environments. In the absence of NO, the F/F0 of the AOSNP did not depend on pH. Upon addition of NO to the AOSNP solution, however, the F/F0 of the AOSNP increased as the pH was increased from 4.0 to 9.0 (Fig. S2, ESI†), suggesting that the AOSNP can detect NO at physiological pH. Additionally, the mass extinction coefficient of the AOSNP after addition of excess NO (AOSNP–NO in Fig. 1) was 9.45 mg−1 cm−1 mL (Fig. S3, ESI†). The fluorescence of AOSNP–NO showed a very small amount of attenuation with time, indicating its good photostability (Fig. S4, ESI†). The quantum yield of AOSNP–NO in water in the NIR-II region was measured, using IR-26 molecules as the reference, to be about 0.35% (Fig. S5, ESI†).
To further study the mechanism by which the AOSNP detects NO, the molecular weight of the organic semiconducting small-molecule FTBD was determined using matrix-assisted laser desorption/ionization time-of-flight mass spectroscopy. The molecular weight of the detection product FTBD was 994.398 (calculated 994.51). After the NO treatment, key signals were observed at an m/z of 1005.453 (calc’d 1005.49), which could be assigned to [FTBD + NO product]+ (Fig. S6, ESI†). These results confirmed that NO transformed phenylenediamine derivatives into extremely strong energy acceptor benzotriazole derivatives, which red-shifted the absorption and fluorescence wavelengths.
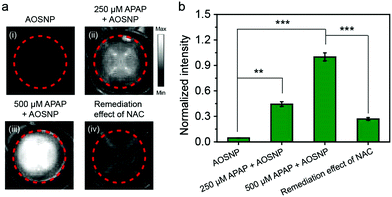
Next, we investigated the cytotoxicity of the AOSNP in normal 3T3 cells and HepG2 liver cells. We did not observe any obvious toxic effect of the AOSNP on either of these two types of cells, even at AOSNP concentrations of up to 200 µg mL−1 (Fig. S7, ESI†), indicating its low cytotoxicity. While acetaminophen (APAP) is a common household medication used to treat pain and fever, overdose of APAP could cause serious hepatotoxicity relating to overproduction of redox species such as NO.1a,13 Thus, visualizing the NO biomarker is an ideal method to monitor APAP-induced hepatotoxicity. Imaging drug-induced hepatotoxicity and the remediation effect of NAC was first studied in HepG2 liver cells. As shown in Fig. 4, the NIR-II fluorescence (pseudo white image) in HepG2 cells with APAP (250 µM and 500 µM) treatment was obviously stronger than that in cells without APAP treatment, indicating the presence of an APAP-induced high level of NO. Furthermore, the high intensity of the NIR-II fluorescence was shown to be weakened by using a superior alternative antidote, namely N-acetyl cysteine (NAC), to enhance nontoxic metabolism of APAP. These results demonstrated that the AOSNP holds great promise for screening preclinical drug-induced hepatotoxicity and the effect of an antidote.
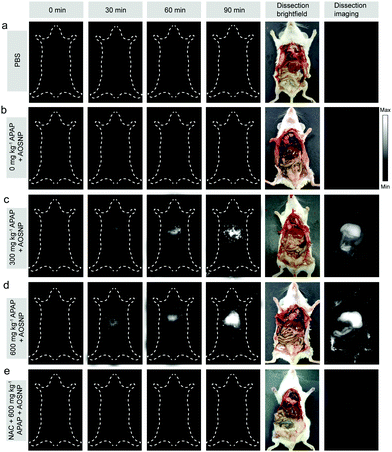
To evaluate the potential of the AOSNP to be used to determine in vivo the dependence of the induced hepatotoxicity on the drug dose, we first evaluated in vivo the kinetics of the elimination of the AOSNP from the blood. The probe exhibited a favourable relatively long circulation time (Fig. S8, ESI†). Next, different concentrations of APAP (0, 300 and 600 mg kg−1) were intraperitoneally injected into a series of live mice. After 60 minutes, the AOSNP (10 mg mL−1, 100 µL) was injected into each of the mice by the tail vein. Then the mice were anesthetized for NIR-II fluorescence imaging at different time points. As shown in Fig. 5, the liver region in the mice treated with APAP (300 and 600 mg kg−1) exhibited an excellent enhancement of NIR-II fluorescence brightness (pseudo white image) as time went on. In contrast, the liver region in the control mice with PBS or APAP (0 mg kg−1) treatment had barely changed, even at 150 minutes post-injection (Fig. 5a and b). To further observe the hepatotoxicity effect, the mice were sacrificed and their abdominal cavity regions were imaged after being dissected from the ventral aspect at 150 min post-injection. The NIR-II fluorescence brightness from the liver region of APAP-treated mice (Fig. 5c and d) was much stronger than that of the control mice treated with PBS or APAP (0 mg kg−1) (Fig. 5a and b). The phenomenon of dose-dependent enhancement of hepatotoxicity detected by AOSNPs was consistent with the cell vacuolization level in histological examination of liver tissues (Fig. S9, ESI†). The fluorescence of the NAC (300 mg kg−1) remediation group was much weaker than that of APAP-treated mice, indicating that NAC exhibited a good remediation effect (Fig. 5e). It should be noted that the NIR-II fluorescence brightness of the liver in the control mice with PBS treatment was almost the same as that with the APAP (0 mg kg−1) treatment (Fig. 5a and b). This phenomenon clearly indicated that our probe itself did not cause liver-injury-induced NO enhancement within 150 min. Additionally, for the control mice treated with PBS and APAP (0 mg kg−1), the NIR-II fluorescence brightness of the liver was stronger than that of other regions, which may be attributed to the inherent background in the liver (Fig. 5a and b).14 Moreover, the NIR-II fluorescence brightness of the gastrointestinal tract in mice treated with APAP was also stronger than that of the control, likely due to APAP metabolism having caused an increased NO level.1b These results demonstrated that the AOSNP can be used to monitor APAP-induced hepatotoxicity.
In summary, we developed an activatable organic semiconducting nanoprobe that was shown to specifically turn on its NIR-II fluorescence upon being exposed to NO stimuli. This probe was successfully used for in vivo, in situ, real-time and non-invasive NIR-II fluorescence monitoring of drug dose-dependent NO activity associated with hepatotoxicity, specifically for the commonly used anti-pain/fever drug APAP. The designed AOSNP probe showed improved performance such as high NIR-II fluorescence brightness, superior ability to accumulate in the liver, ultrafast response time, high sensitivity, excellent specificity, and good photostability and biocompatibility. These improved performance measures combined with the excellent ability of the probe to realize deep tissue penetration, high spatial resolution and low liver background signal for NIR-II fluorescence, all may help to uncover the mechanisms of redox production and action in a broad range of diseases. Additionally, Fan et al. have very recently effectively broadened the application of NIR-II nanoparticles to image biomarkers in vivo by using NIR-II fluorescence lifetime of probe.8c Thus, we believe that the integration of NIR-II bioimaging and high-performance probes will open up numerous exciting possibilities in biomedical research.
This work was financially supported by the National Natural Science Foundation of China (No. 21674048 and 21574064), the Jiangsu Province “333 high-level Personnel Training project”, the Primary Research & Development Plan of Jiangsu Province (No. BE2016770).
Conflicts of interest
There are no conflicts to declare.Notes and references
- (a) A. J. Shuhendler, K. Pu, L. Cui, J. P. Uetrecht and J. Rao, Nat. Biotechnol., 2014, 32, 373 CrossRef CAS; (b) J. Peng, A. Samanta, X. Zeng, S. Han, L. Wang, D. Su, D. T. Loong, N. Y. Kang, S. J. Park, A. H. All, W. Jiang, L. Yuan, X. Liu and Y. T. Chang, Angew. Chem., Int. Ed., 2017, 56, 4165 CrossRef CAS.
- (a) X. Jiao, Y. Xiao, Y. Li, M. Liang, X. Xie, X. Wang and B. Tang, Anal. Chem., 2018, 90, 7510 CrossRef CAS; (b) Y. Li, X. Xie, X. Yang, M. Li, X. Jiao, Y. Sun, X. Wang and B. Tang, Chem. Sci., 2017, 8, 4006 RSC.
- (a) Y. Tang, Y. Li, X. Hu, H. Zhao, Y. Ji, L. Chen, W. Hu, W. Zhang, X. Li, X. Lu, W. Huang and Q. Fan, Adv. Mater., 2018, 30, 1801140 CrossRef; (b) A. M. Smith, M. C. Mancini and S. Nie, Nat. Nanotechnol., 2009, 4, 710 CrossRef CAS; (c) Y. Jiang and K. Pu, Adv. Biosyst., 2018, 2, 1700262 CrossRef; (d) Q. Miao and K. Pu, Adv. Mater., 2018, 30, 1801778 CrossRef.
- K. Welsher, S. P. Sherlock and H. Dai, Proc. Natl. Acad. Sci. U. S. A., 2011, 108, 8943 CrossRef CAS.
- G. Hong, J. T. Robinson, Y. Zhang, S. Diao, A. L. Antaris, Q. Wang and H. Dai, Angew. Chem., Int. Ed., 2012, 124, 9956 CrossRef.
- (a) Z. Tao, G. Hong, C. Shinji, C. Chen, S. Diao, A. L. Antaris, B. Zhang, Y. Zou and H. Dai, Angew. Chem., Int. Ed., 2013, 52, 13002 CrossRef CAS; (b) B. Li, L. Lu, M. Zhao, Z. Lei and F. Zhang, Angew. Chem., Int. Ed., 2018, 57, 7483 CrossRef CAS.
- (a) G. Hong, Y. Zou, A. L. Antaris, S. Diao, D. Wu, K. Cheng, X. Zhang, C. Chen, B. Liu, Y. He, J. Z. Wu, J. Yuan, B. Zhang, Z. Tao, C. Fukunaga and H. Dai, Nat. Commun., 2014, 5, 4206 CrossRef CAS; (b) K. Shou, Y. Tang, H. Chen, S. Chen, L. Zhang, A. Zhang, Q. Fan, A. Yu and Z. Cheng, Chem. Sci., 2018, 9, 3105 RSC.
- (a) P. Wang, Y. Fan, L. Lu, L. Liu, L. Fan, M. Zhao, Y. Xie, C. Xu and F. Zhang, Nat. Commun., 2018, 9, 2898 CrossRef; (b) R. Wang, L. Zhou, W. Wang, X. Li and F. Zhang, Nat. Commun., 2017, 8, 14702 CrossRef; (c) Y. Fan, P. Wang, Y. Lu, R. Wang, L. Zhou, X. Zheng, X. Li, J. A. Piper and F. Zhang, Nat. Nanotechnol., 2018, 13, 941 CrossRef CAS.
- (a) Y. Lyu and K. Pu, Adv. Sci., 2017, 1600481 CrossRef; (b) Q. Miao, C. Xie, X. Zhen, Y. Lyu, H. Duan, X. Liu, J. V. Jokerst and K. Pu, Nat. Biotechnol., 2017, 35, 1102 CAS; (c) Y. Jiang and K. Pu, Acc. Chem. Res., 2018, 51, 1840 CrossRef CAS; (d) C. Zhu, L. Liu, Q. Yang, F. Lv and S. Wang, Chem. Rev., 2012, 112, 4687 CrossRef CAS.
- J. Li, J. Rao and K. Pu, Biomaterials, 2017, 155, 217 CrossRef.
- E. A. Owens, M. Henary, G. El Fakhri and H. S. Choi, Acc. Chem. Res., 2016, 49, 1731 CrossRef CAS PubMed.
- (a) V. Calabrese, C. Mancuso, M. Calvani, E. Rizzarelli, D. A. Butterfield and A. M. Stella, Nat. Rev. Neurosci., 2007, 8, 766 CrossRef CAS; (b) C. R. Gardner, D. E. Heck, C. S. Yang, P. E. Thomas, X. J. Zhang, G. L. DeGeorge, J. D. Laskin and D. L. Laskin, Hepatology, 1998, 27, 748 CrossRef CAS; (c) C. Xie, X. Zhen, Y. Lyu and K. Pu, Adv. Mater., 2017, 29, 1703693 CrossRef; (d) X. Wang, H. Fang, Z. Huang, W. Shang, T. Hou, A. Cheng and H. Cheng, J. Mol. Med., 2013, 91, 917 CrossRef CAS.
- H. X. Zhang, J. B. Chen, X. F. Guo, H. Wang and H. S. Zhang, Anal. Chem., 2014, 86, 3115 CrossRef CAS.
- S. Diao, G. Hong, A. L. Antaris, J. L. Blackburn, K. Cheng, Z. Cheng and H. Dai, Nano Res., 2015, 8, 3027 CrossRef CAS.
Footnotes |
| † Electronic supplementary information (ESI) available. See DOI: 10.1039/c8cc08413k |
| ‡ These authors contributed equally to this work. |
| § QF supervised and designed the study; YT and YL performed experiments; others analyzed data and wrote the manuscript. All mice were used according to the guidelines of the Laboratory Animal Center of Jiangsu KeyGEN BioTECH Corp., Ltd. |
| This journal is © The Royal Society of Chemistry 2019 |

