
A two-photon fluorescent probe for colorimetric and ratiometric monitoring of mercury in live cells and tissues†
Liyan
Chen‡
a,
Sang Jun
Park‡
b,
Di
Wu
*c,
Hwan Myung
Kim
 *b and
Juyoung
Yoon
*a
*b and
Juyoung
Yoon
*a
aDepartment of Chemistry and Nano Science, Ewha Womans University, Seoul, 120-750, Korea. E-mail: jyoon@ewha.ac.kr
bDepartment of Chemistry and Energy Systems Research, Ajou University, Suwon, Korea. E-mail: kimhm@ajou.ac.kr
cSchool of Chemistry, Chemical Engineering and Life Science, Wuhan University of Technology, No. 122 Luoshi Road, Wuhan 430070, China. E-mail: wudi19871208@163.com
First published on 14th January 2019
Abstract
Owing to the extreme toxicity of mercury, methods for its selective and sensitive sensing in solutions, and in live cells and tissues are in great demand. In this study, we developed a naphthalimide-based diphenylphosphinothioyl group-containing fluorescent and colorimetric probe that selectively detects mercury (Hg2+). Upon addition of mercury (Hg2+) to a solution of the probe, both a colorimetric change from colorless to yellow and a fluorescence change from blue to green (under a 365 nm hand-held UV lamp) occur, both of which can be observed using the “naked-eye”. Furthermore, the probe possesses the capability of sensing intracellular mercury in both live cells and tissues using dual-emission channels and two-photon microscopy.
Owing to its wide use in the chemical industry and its extreme toxicity, mercury is a hazardous threat to both human health and the environment.1 The toxicity of the mercuric ion is caused by its strong binding affinity to thiols in enzymes and proteins, which results in severe and irreversible damage to physiological processes. Consequently, novel strategies for selective and sensitive detection of mercury in the environment and living systems are in great demand. In contrast to several traditional methods that have been developed for this purpose thus far, including those that rely on absorption spectroscopy, gas chromatography-mass spectrometry, voltammetry and atomic absorption/emission spectrometry, those that utilize fluorescence methods possess significant advantages, including instantaneous response, operational simplicity, high selectivity and sensitivity, and real-time detection capability.2 Thus, considerable attention has been given to the development of fluorescent probes for monitoring mercury in aqueous solution and in biological samples. These studies have led to a number of fluorescent chemosensor systems that utilize various mercury mediated chemical processes such as cyclization,3 desulfurization,4 oxymercuration5 and others.6 Though effective, these detection methods have important drawbacks. For example, most of these methods detect mercury in an “off–on” manner. In contrast, because changes in interconnected fluorescent signals are monitored, ratiometric fluorescent probes are capable of detecting analytes with high accuracies because interferences arising from instrumental issues, probe concentrations and ambient environmental changes are minimized.7 Notably, Coskun and co-workers reported a significantly ratiometric fluorescent probe with the advantage of an internal charge transfer mechanism utilizing boradiazaindacene dyads.6j The probe efficiently detected mercury with larger intensity ratio changes and excellent selectivity. Regrettably, its application in live cells has not been explored. Besides that, though some fluorescent probes have successfully been applied to monitor mercury in vivo, the majority of them developed to date employ one-photon microscopy to detect mercury inside the cells or tissues. In contrast, two-photon microscopy (TPM), in which two near-infrared (NIR) photons serve as the excitation source, possesses significant advantages including reduced photodamage and greater tissue imaging depths.8
Thus, in the investigation described below, we developed a new colorimetric and ratiometric fluorescence probe, which contains a naphthalimide fluorophore and which can be utilized to monitor mercury in both live cells and tissues using two-photon microscopy.
Guided by the results of previous studies,9 we designed the naphthalimide containing fluorescent probe, NAP-PS, for the detection of mercury. We anticpated that NAP-PS would possess several beneficial features, including high stability and cell-permeability (Scheme 1 and Scheme S1, ESI†). Moreover, the diphenylphosphinothioyl moiety was incorporated into a familiar 4-hydroxy-1,8-naphthalimide fluorophore in order to achieve ratiometric detection of mercury. It was envisaged that mercury would promote cleavage of the thiophosphinate ester P–O bond in NAP-PS to produce NAP-O−, which is an intramolecular charge transfer (ICT) system that displays long emission wavelength owing to the strong electron-donating oxy-anion site and the strong electron-withdrawing naphthalimide group (Scheme 1).10 To assess the validity of the expectations stated above, we prepared NAP-PS by using a four-step sequence, starting with commercially available 4-bromo-1,8-naphthalic anhydride and butylamine (Scheme S1, ESI†).
 | ||
| Scheme 1 Synthesis of probe NAP-PS. | ||
By viewing the absorption spectra shown in Fig. 1A, NAP-PS (10 μM) in HEPES buffer (1.0 mM, pH = 7.4) has an absorption band centered at 370 nm. Upon addition of various amounts of mercury (Hg2+) to the solution of NAP-PS, the absorption peak shifts in a continuous fashion to 450 nm, associated with a color change from colorless to yellow (Fig. 1A inset). Moreover, NAP-PS emits strong blue fluorescence with a maximum at 450 nm. Addition of mercury causes a significant decrease in the intensity of the emission band at 450 nm and a concurrent increase in the intensity of a peak at 560 nm. Also, the gradual change occurring in emission can be observed as a blue to green color change using the naked eye under a hand-held UV lamp (365 nm) (Fig. 1B inset). At mercury concentrations above 60 μM, the ratio of the fluorescence intensity at 550 and 450 nm (F550/F450) reaches a maximum (Fig. S1, ESI†). Moreover, the F550/F450 ratio is linearly dependent on the mercury concentration in the range of 0–12 μM (Fig. S2, ESI†). Based on the 3δ/k criterion, the detection limit of the probe for mercury is 43 nM.
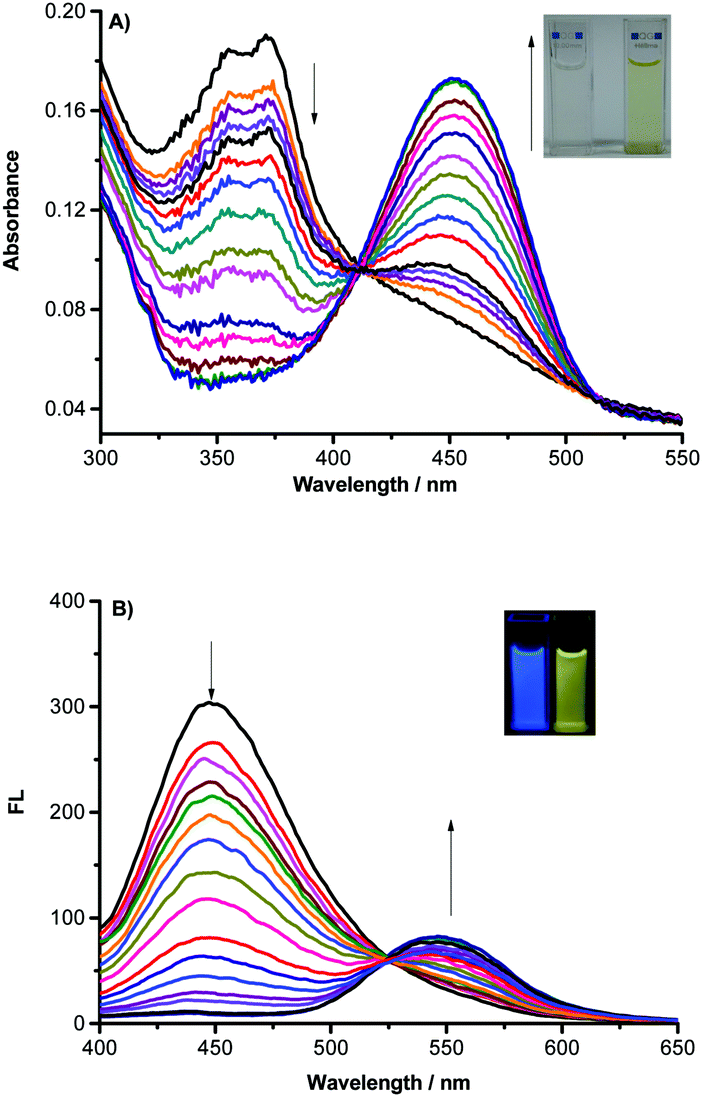 | ||
| Fig. 1 (A) Fluorescence spectra of NAP-PS (10 μM), obtained upon addition of mercury(II) perchlorate (0–30 μM) in HEPES buffer (1.0 mM, pH = 7.4); (B) UV-vis spectra of NAP-PS (10 μM) obtained upon addition of mercury(II) perchlorate (0–30 μM) in HEPES buffer (1.0 mM, pH = 7.4); all spectra were recorded after incubation with different concentrations of mercury(II) perchlorate for 40 min; λex = 380 nm, λem1 = 450 nm, λem2 = 550, and slits: 3/5 nm; (A) inset: photograph of solutions of probe NAP-PS (10 μM) before and after the addition of mercury(II) perchlorate (30 μM); (B) inset: photograph of solutions of probe NAP-PS (10 μM) before and after the addition of mercury(II) perchlorate (30 μM) under a 365 nm hand-held UV lamp. | ||
The excellent selectivity of NAP-PS for sensing mercury was demonstrated by the observation that no fluorescence responses are induced by other metal ions including Zn2+, Cu2+, Mn2+, Pb2+, Al3+, Ca2+, Cr3+, K+, Fe3+, Fe2+, Cs+, Na+, Ni2+, Mg2+, Sr2+, Cd2+ and Ag+. As the results in Fig. 2 show, only the addition of mercury leads to a significant ratiometric response of the fluorescence intensities at 450 nm to 550 nm. Moreover, other metal ions do not interfere with the detection of mercury by NAP-PS.
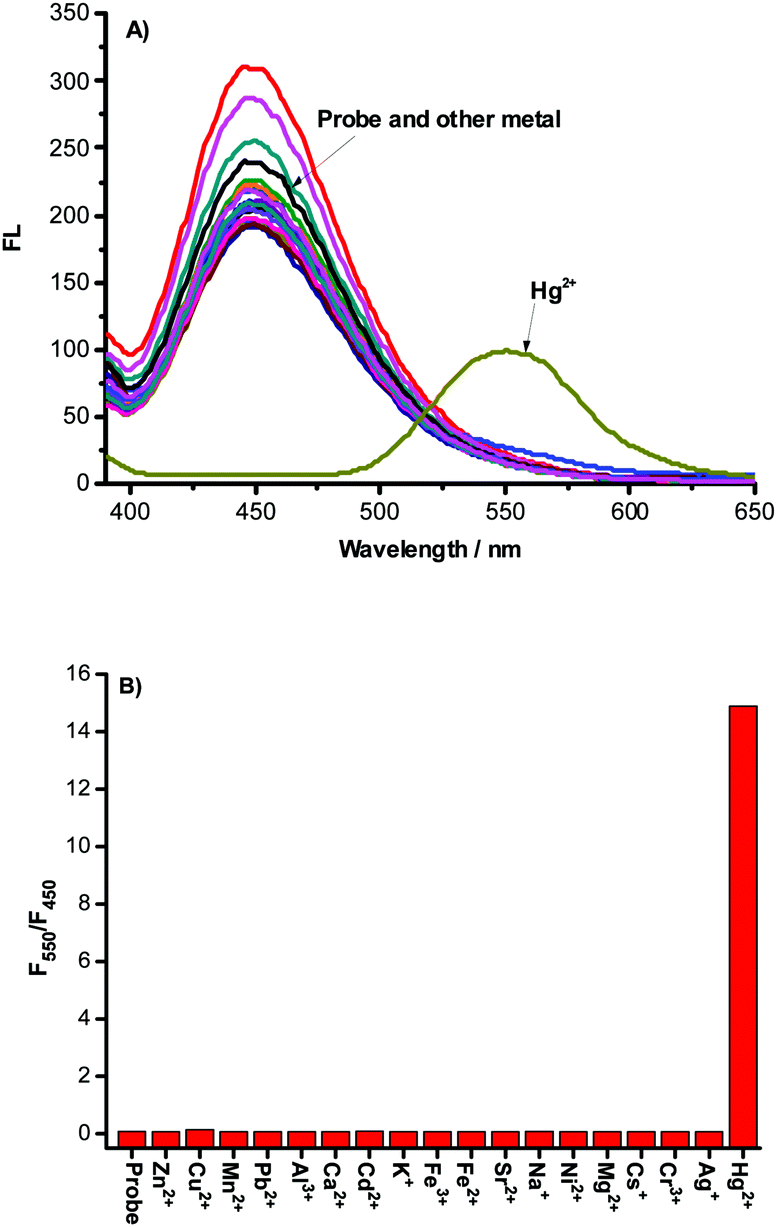 | ||
| Fig. 2 (A) Fluorescence spectra of probe NAP-PS (10 μM) before and after the addition of 200 μM different metal ions in HEPES buffer (1.0 mM, pH = 7.4), λex = 380 nm, slits: 3/5 nm; (B) fluorescence intensity ratios (F550/F450) of probe NAP-PS (10 μM) before and after the addition of 200 μM different metal ions in HEPES buffer (1.0 mM, pH = 7.4). | ||
The time dependence of the fluorescence response of NAP-PS was measured in order to determine the observed rate constant of its reaction with mercury. As the results in Fig. 3 show, a HEPES buffer (1.0 mM, pH = 7.4) solution of NAP-PS (10 μM) displays very faint fluorescence at 550 nm and a high overall photostability. Following the addition of 2 equivalents of mercury, the intensity of the emission band of NAP-PS at 550 nm increases with time and reaches a maximum after 20 min. Pseudo first order kinetic analysis of the time course data leads to an observed rate constant (25 °C) of 9.9 × 10⁻¹ min−1 for the reaction of mercury with NAP-PS (Fig. S3, ESI†).
 | ||
| Fig. 3 Time-dependent changes in F550/F450 nm for solutions of NAP-PS (10 μM) upon addition of mercuric perchlorate (20 μM), λex = 380 nm, and slits: 3/5 nm. | ||
As suggested previously,9a,11 the chemical process responsible for the absorption and emission spectroscopic changes of NAP-PS involves the mercury promoted cleavage of the P–O bond, which generates the strongly fluorescent NAP-O− anion. To confirm the occurrence of this process, a solution of NAP-PS (10 μM) and mercuric perchlorate (20 μM) in HEPES was monitored using high-resolution mass spectrometry (HRMS) methods (Fig. S4, ESI†). The observed formation of peaks at m/z 268.0952 and 217.0399 in the HRMS spectrum is consistent with the formation of NAP-OH (calcd m/z 268.0979 for C16H14NO3) and diphenylphosphinic acid (DPA) (calcd m/z 217.0424 for C12H10PO2), respectively. Moreover, both the fluorescence and absorption spectra of NAP-OH and the mixture following the reaction of NAP-PS with mercuric perchlorate are identical (Fig. S5 and S6, ESI†).
The ability to utilize NAP-PS to monitor mercury in the solid state was assessed. The initially white NAP-PS solid was mixed with solid mercuric perchlorate. Grinding of this solid mixture gradually promotes a color change to yellow (Fig. S7, ESI†). The emission color change caused by grinding this solid mixture was examined using a hand-held UV lamp (365 nm). As shown in Fig. S8 (ESI†), upon grinding the strong blue emission of solid NAP-PS undergoes a change to green-emission.
Encouraged by the excellent performance by NAP-PS in sensing mercury in the solution and solid states, we explored the use of the probe for fluorescence imaging in live cells. MTT assays showed that NAP-PS and NAP-OH have negligible cytotoxicity under the imaging conditions (Fig. S10, ESI†). In order to avoid limitations associated with photodamage and autofluorescence caused by using a short excitation wavelength (λex = 380 nm), we first assessed the use of two-photon microscopy (TPM) for determining mercury concentrations. To evaluate the permeability of NAP-PS in the cells, real-time images were taken at an interval of 5 s (Fig. S11, ESI†). No signal was observed in the cells before treatment with NAP-PS, however, the fluorescence intensities of the cells began to increase when loaded with the probe, and the signal was saturated within 1 min. Thus, NAP-PS has high cell permeability, and the fluorescence observed in the cell can be confirmed to be the fluorescence caused by the probe, and not the auto-fluorescence of the cell. To find appropriate two-photon excitation wavelengths, TPEF intensities were assessed by incorporating NAP-PS and NAP-OH in HeLa cells (Fig. S12, ESI†). Cells containing NAP-OH display bright emission when exposed to two-photon excitation wavelengths in the 740–800 nm range, while those containing NAP-PS display bright fluorescence when exposed to wavelengths of light below 740 nm (Fig. S12a–c, ESI†). The degree of two-photon absorption cross-section was calculated to be 15 and 42 GM respectively (1 GM = 10−50 cm4 per photon) for NAP-PS and NAP-OH in HEPES buffer (Fig. S9, ESI†). Analysis of the results from the TPEF spectroscopy experiments with NAP-PS and NAP-OH containing HeLa cells demonstrated that the detection windows of 400–450 nm (Fblue) and 500–600 nm (Fyellow), and excitation at 740 nm are optimal for determining Fyellow/Fblue ratios (Fig. S12, ESI†). In addition, fluorescence of NAP-PS in HeLa cells is maintained over 1 h with a laser pulse interval of 2 s, indicating that it has the level of robust photostability needed for cell imaging experiments (Fig. S13, ESI†).
To show that NAP-PS can be employed to detect mercury in live cells, the average emission intensity ratios Fyellow/Fblue were determined using Hg(ClO4)2 treated HeLa cells. The cell calibration test indicated that the Fyellow/Fblue ratio of NAP-PS was linearly increased by treatment with various concentrations of Hg(ClO4)2 (Fig. S14, ESI†). Upon excitation at 740 nm, the respective Fyellow/Fblue values of untreated HeLa cells labeled with probes NAP-PS and NAP-OH were found to be 0.39 and 4.01 (Fig. 4a and d). Treatment of NAP-PS labeled HeLa cells with Hg(ClO4)2 (25 μM) for 30 min leads to an increase in the Fyellow/Fblue ratio to 1.40, which corresponds to a 3.6-fold enhancement (Fig. 4b). Finally, incorporation of the known mercury chelator N,N,N,N-tetrakis(2-pyridylmethyl)ethylenediamine (TPEN, 1 mM)12 reduces the Fyellow/Fblue value to 0.43 (Fig. 4c).
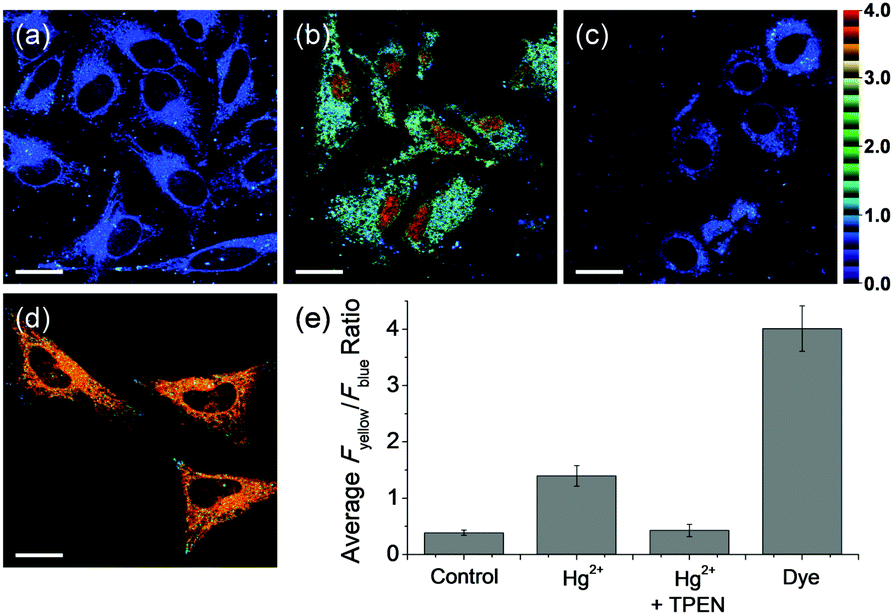 | ||
| Fig. 4 Pseudo colored ratiometric TPM images of HeLa cells incubated with (a) probe NAP-PS (5 μM) and (d) dye (NAP-OH, 5 μM) for 30 min; HeLa cells were pretreated with (b) Hg(ClO4)2 (25 μM) for 30 min and (c) Hg(ClO4)2 and then with TPEN (1 mM) for an additional 30 min before labeling with probe NAP-PS; (e) average Fyellow/Fblue ratios in the TPM images. Images were acquired using 740 nm excitation and emission windows of 400–450 nm (blue) and 500–600 nm (yellow); scale bars = 20 μM. | ||
The liver is an important organ for carrying out metabolic and detoxification functions of humans. It has been reported that accumulation of mercury leads to liver dysfunction and related diseases.13 In order to further explore the biological value of NAP-PS, fluorescence imaging of mercury in live tissues was carried out using TPM. The Fyellow/Fblue ratio of TPM images of liver tissues stained with NAP-PS (50 μM) for 1 h was found to be 0.77 (Fig. 5a). When liver tissues are pretreated with Hg(ClO4)2, the Fyellow/Fblue ratio value increases to 1.70 (Fig. 5b). These results show that NAP-PS along with TPM can be employed to directly and quantitatively determine the presence of mercury in both live cells and tissues.
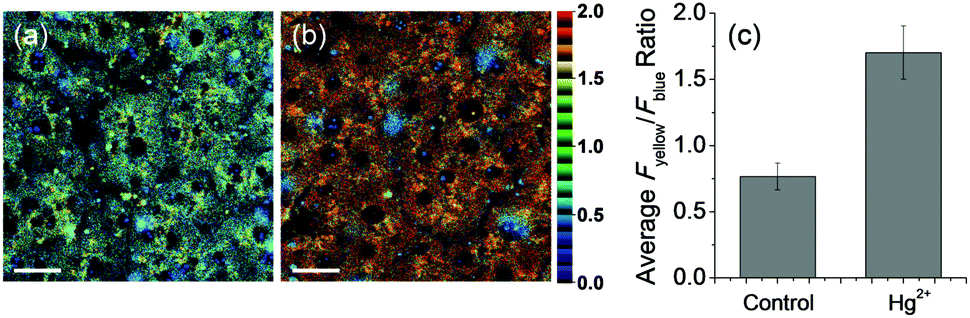 | ||
| Fig. 5 Pseudo colored ratiometric TPM images of rat liver tissues incubated with NAP-PS (50 μM) for 1 h (a) before and (b) after pretreatment with Hg(ClO4)2 (250 μM) for 1 h; (c) average Fyellow/Fblue ratios in the TPM images; images were acquired using 740 nm excitation and emission windows of 400–450 nm (blue) and 500–600 nm (yellow); scale bars = 20 μM. | ||
The results presented above show that NAP-PS is a highly effective colorimetric and ratiometric fluorescent probe for monitoring mercury. The ratiometric fluorescence response of NAP-PS is a consequence of its reaction with mercury, which cleaves the thiophosphinate P–O bond in the probe to form the intramolecular charge transfer (ICT) system, NAP-O−. Importantly, the use of this probe as a dual-channel sensor for mercury in both live cells and tissues was demonstrated in this effort.
This study was supported financially by the National Research Foundation of Korea (NRF) grant funded by the Korea government (MSIP) (No. 2012R1A3A2048814 for J. Yoon and No. 2016R1E1A1A02920873 for H. M. Kim). The Korea Basic Science Institute (Western Seoul) is acknowledged for the LC/MS data. FAB mass spectral data were obtained from the Korea Basic Science Institute (Daegu) on a Jeol JMS 700 high resolution mass spectrometer.
Conflicts of interest
There are no conflicts to declare.Notes and references
- (a) M. Altrichter, Ambio, 2008, 37, 108 CrossRef PubMed; (b) K. P. Lisha and T. Pradeep, Gold Bull., 2009, 42, 144 CrossRef CAS.
- (a) D. Wu, A. C. Sedgwick, T. Gunnlaugsson, E. U. Akkaya, J. Yoon and T. D. James, Chem. Soc. Rev., 2017, 46, 7105 RSC; (b) D. Wu, L. Chen, W. Lee, G. Ko, J. Yin and J. Yoon, Coord. Chem. Rev., 2018, 354, 74 CrossRef CAS; (c) S. Lee, J. Li, X. Zhou, J. Yin and J. Yoon, Coord. Chem. Rev., 2018, 366, 29 CrossRef CAS.
- (a) Y.-K. Yang, K.-J. Yook and J. Tae, J. Am. Chem. Soc., 2005, 127, 16760 CrossRef CAS PubMed; (b) S.-K. Ko, Y.-K. Yang, J. Tae and I. Shin, J. Am. Chem. Soc., 2006, 128, 14150 CrossRef CAS PubMed; (c) J.-S. Wu, I.-C. Hwang, K. S. Kim and J. S. Kim, Org. Lett., 2007, 9, 907 CrossRef CAS PubMed; (d) G.-Q. Shang, X. Gao, M.-X. Chen, H. Zheng and J.-Z. Xu, J. Fluoresc., 2008, 18, 1187 CrossRef CAS PubMed; (e) H. Lee and H.-J. Kim, Tetrahedron Lett., 2011, 52, 4775 CrossRef CAS; (f) X. Zhang, Y. Xiao and X. Qian, Angew. Chem., Int. Ed., 2008, 47, 8025 CrossRef CAS PubMed; (g) A. Tantipanjaporn, S. Prabpai, K. Suksen and P. Kongsaeree, Spectrochim. Acta, Part A, 2018, 192, 101 CrossRef CAS PubMed; (h) Y. Liu, X. Lv, Y. Zhao, M. Chen, J. Liu, P. Wang and W. Guo, Dyes Pigm., 2012, 92, 909 CrossRef CAS; (i) S. Chen, W. Wang, M. Yan, Q. Tu, S.-W. Chen and T. Li, Sens. Actuators, B, 2018, 255, 2086 CrossRef CAS; (j) M. Wang, J. Wen, Z. Qin, H. Wang, M.-S. Yuan and J. Wang, Dyes Pigm., 2015, 120, 208 CrossRef CAS.
- (a) X. Chen, K.-H. Baek, Y. Kim, S.-J. Kim, I. Shin and J. Yoon, Tetrahedron, 2010, 66, 4016 CrossRef CAS; (b) W. Xuan, C. Chen, Y. Cao, W. He, W. Jiang, K. Liu and W. Wang, Chem. Commun., 2012, 48, 7292 RSC; (c) F. Wang, S.-W. Nam, Z. Guo, S. Park and J. Yoon, Sens. Actuators, B, 2012, 161, 948 CrossRef CAS.
- (a) S. Ando and K. Koide, J. Am. Chem. Soc., 2011, 133, 2556 CrossRef CAS PubMed; (b) M. Santra, B. Roy and K. H. Ahn, Org. Lett., 2011, 13, 3422 CrossRef CAS PubMed; (c) J. Jiang, W. Liu, J. Cheng, L. Yang, H. Jiang, D. Bai and W. Liu, Chem. Commun., 2012, 48, 8371 RSC; (d) B. Gu, L. Huang, N. Mi, P. Yin, Y. Zhang, X. Tu, X. Luo, S. Luo and S. Yao, Analyst, 2015, 140, 2778 RSC.
- (a) E. M. Nolan and S. J. Lippard, J. Am. Chem. Soc., 2007, 129, 5910 CrossRef CAS PubMed; (b) H. Y. Lee, K. M. K. Swamy, J. Y. Jung, G. Kim and J. Yoon, Sens. Actuators, B, 2013, 182, 530 CrossRef CAS; (c) X. Zhou, X. Wu and J. Yoon, Chem. Commun., 2015, 51, 111 RSC; (d) L. Long, X. Tan, S. Luo and C. Shi, New J. Chem., 2017, 41, 8899 RSC; (e) Y. Zhang, H. Chen, D. Chen, D. Wu, Z. Chen, J. Zhang, X. Chen, S. Liu and J. Yin, Sens. Actuators, B, 2016, 224, 907 CrossRef CAS; (f) S. Ma, L. Li, M. She, Y. Mo, S. Zhan, P. Liu and J. Li, Chin. Chem. Lett., 2017, 28, 2014 CrossRef CAS; (g) A. Chatterjee, M. Banerjee, D. G. Khandare, R. U. Gawas, S. C. Mascarenhas, A. Ganguly, R. Gupta and H. Joshi, Anal. Chem., 2017, 89, 12698 CrossRef CAS PubMed; (h) J. Sivamani, V. Sadhasivam and A. Siva, Sens. Actuators, B, 2017, 246, 108 CrossRef CAS; (i) H. N. Kim, W. X. Ren, J. S. Kim and J. Yoon, Chem. Soc. Rev., 2012, 41, 3210 RSC; (j) A. Coskun and E. U. Akkaya, J. Am. Chem. Soc., 2006, 128, 14474 CrossRef CAS PubMed.
- (a) R. Y. Tsien and M. Poenie, Trends Biochem. Sci., 1986, 11, 450 CrossRef CAS; (b) M. H. Lee, J. S. Kim and J. L. Sessler, Chem. Soc. Rev., 2015, 44, 4185 RSC; (c) M. A. Haidekker and E. A. Theodorakis, J. Mater. Chem. C, 2016, 4, 2707 RSC.
- (a) H. M. Kim and B. R. Cho, Chem. Rev., 2015, 115, 5014 CrossRef CAS PubMed; (b) Y. L. Pak, S. J. Park, D. Wu, B. Cheon, H. M. Kim, J. Bouffard and J. Yoon, Angew. Chem., Int. Ed., 2018, 57, 1567 CrossRef CAS PubMed.
- (a) B. Tang, B. Ding, K. Xu and L. Tong, Chem. – Eur. J., 2009, 15, 3147 CrossRef CAS PubMed; (b) H. G. Im, H. Y. Kim and S.-K. Chang, Sens. Actuators, B, 2014, 191, 854 CrossRef CAS.
- (a) B. Zhu, C. Gao, Y. Zhao, C. Liu, Y. Li, Q. Wei, Z. Ma, B. Du and X. Zhang, Chem. Commun., 2011, 47, 8656 RSC; (b) Y. Tian, F. Xin, C. Gao, J. Jing and X. Zhang, J. Mater. Chem. B, 2017, 5, 6890 RSC; (c) C. Liu, H. Wu, Z. Wang, C. Shao, B. Zhu and X. Zhang, Chem. Commun., 2014, 50, 6013 RSC; (d) B. Zhu, P. Li, W. Shu, X. Wang, C. Liu, Y. Wang, Z. Wang, Y. Wang and B. Tang, Anal. Chem., 2016, 88, 12532 CrossRef CAS PubMed; (e) Y. Hao, Y. Zhang, K. Ruan, W. Chen, B. Zhou, X. Tan, Y. Wang, L. Zhao, G. Zhang, P. Qu and M. Xu, Sens. Actuators, B, 2017, 244, 417 CrossRef CAS; (f) X. Xia, F. Zeng, P. Zhang, J. Lyu, Y. Huang and S. Wu, Sens. Actuators, B, 2016, 227, 411 CrossRef CAS; (g) X. Wu, L. Li, W. Shi, Q. Gong, X. Li and H. Ma, Anal. Chem., 2016, 88, 1440 CrossRef CAS PubMed.
- (a) M. H. Lee, J. S. Kim and J. L. Sessler, Chem. Soc. Rev., 2015, 44, 4185 RSC; (b) M. A. Haidekker and E. A. Theodorakis, J. Mater. Chem. C, 2016, 4, 2707 RSC; (c) B. Zhu, C. Gao, Y. Zhao, C. Liu, Y. Li, Q. Wei, Z. Ma, B. Du and X. Zhang, Chem. Commun., 2011, 47, 8656 RSC.
- C. S. Lim, D. W. Kang, Y. S. Tian, J. H. Han, H. L. Hwang and B. R. Cho, Chem. Commun., 2010, 46, 2388 RSC.
- (a) C. Y. Ung, S. H. Lam, M. M. Hlaing, C. L. Winata, S. Korzh, S. Mathavan and Z. Gong, BMC Genomics, 2010, 11, 212 CrossRef PubMed; (b) M. R. Lee, Y. H. Lim, B. E. Lee and Y. C. Hong, Environ. Health, 2017, 16, 17 CrossRef PubMed.
Footnotes |
| † Electronic supplementary information (ESI) available: Experimental section and additional tables and figures. See DOI: 10.1039/c8cc08608g |
| ‡ Contributed equally to this work. |
| This journal is © The Royal Society of Chemistry 2019 |