Synthesis and X-ray absorption spectroscopy of potassium transition metal fluoride nanocrystals†
Michael R.
Plews
 a,
Tanghong
Yi
a,
John
Lee
b,
Emory
Chan
b,
John W.
Freeland
c,
Dennis
Nordlund
d and
Jordi
Cabana
a,
Tanghong
Yi
a,
John
Lee
b,
Emory
Chan
b,
John W.
Freeland
c,
Dennis
Nordlund
d and
Jordi
Cabana
 *a
*a
aDepartment of Chemistry, University of Illinois at Chicago, Chicago, IL 60607, USA. E-mail: jcabana@uic.edu
bThe Molecular Foundry, Lawrence Berkeley National Laboratory and Advanced Photon Source, Argonne National Laboratory, Berkeley, CA 94720, USALemont, IL 60439, USA
cAdvanced Photon Source, Argonne National Laboratory, Lemont, IL 60439, USA
dStanford Linear Accelerator Center, Stanford Synchrotron Radiation Lightsource, Menlo Park, CA 94025, USA
First published on 16th November 2018
Abstract
Nanocrystals of KMF3 (M = Mn–Ni) and K3MF6 (M = V, Fe) were synthesized via non-aqueous routes based on colloidal chemistry. The effect of a variety of parameters on the purity, size and quality of the nanocrystals was evaluated. Fluorides formed from mixtures of commercially available potassium trifluoroacetate and transition metal alkoxides, as opposed to existing methods based solely on trifluoroacetate precursors. Particles of KMF3 in the range of several to tens of nanometers, were achieved. It was found that methodologies based on hot injection of precursors often led to crystal sizes an order of magnitude smaller than those obtained from co-thermolysis as well as higher purity material. X-ray absorption spectroscopy revealed that M–F bond hybridization increased with transition metal d-electron count. On further probing of the Fe K and L edges, making use of different probing depths, KFeF3 nanocrystals were found to have FeII in the bulk, while the surface was rich in FeIII, but not as the product of oxidation. The developed protocols and lessons learned could be leveraged to rapidly devise synthetic methods for other alkali transition metal fluorides of interest.
1 Introduction
Research into nanosizing materials has grown vastly in the past few decades, the driving force behind it being that interesting new properties of materials begin to show as the size of the material diminishes.1 In order to understand and enhance these properties, efforts must be made to control the size and shape of these materials. So far, the field has sought to provide standard synthetic conditions and rules for nanocrystal growth resulting in a large library of nanomaterials that exist in a multitude of applications.2–4 By adding complex phases to this library, the understanding of the fundamental self-assembly, crystallization, and growth mechanisms of nanocrystals will continue to evolve.Complex fluorides with a perovskite structure have interesting electronic, optical and magnetic properties.5,6 In particular, KMF3 (M = Mn–Fe) have attracted interest in electrochemical applications such as batteries5 and supercapacitors.7 In both cases, the use of small particles maximizes the surface area, where charge storage is initiated. In the specific case of alkali-ion batteries: (i) fluorides could stabilize higher oxidation states of transition metals by pinning the redox reaction at the metal center. (ii) Using a more electronegative anion lowers the Fermi level in the cathode with respect to oxides, thereby raising the operating voltage and thus the energy density of the overall cell. In the case of perovskite fluorides, K+ ions have been shown to deintercalate from KFeF3, which is compensated by the oxidation of Fe.5,8 These results encourage interest in potassium transition metal fluorides, broadly for electrochemical applications. However, the increased ionicity of the M–F bond compared to M–O causes electronic insulation in the material. This issue reinforces the need for fluoride materials to be formed in the nanoscale to minimize the lengths of electron diffusion. Therefore, synthetic protocols for alkali-transition metal fluorides in the nanocrystalline form need to be established. Perovskite-type fluorides have been synthesized previously;9–11 however the authors found no reports on KMF3 (M = Fe, Co) or K3MF6 (M = V, Fe), while they found one report on KNiF3 (ref. 7) and several reports on KMnF3 (ref. 12–17) whereby these materials were grown colloidally to <100 nm. A common colloidal synthetic protocol relies on the simultaneous decomposition of an alkali trifluoroacetate and a transition metal trifluoroacetate or, alternatively, a bimetallic trifluoroacetate14 in a solution containing a surfactant in a high boiling point solvent. While this method has proven fruitful, transition metal trifluoroacetates are often unstable or difficult to synthesize. Broadly speaking, defining the need for high concentrations of F in the reaction environment would be valuable.
This study provides synthetic protocols for KMF3 (M = Mn–Ni) and K3MF6 (M = V, Fe) nanocrystals from commercially available precursors, with KMF3 nanocrystals possessing a mean crystal size of <15 nm. We found throughout our study that a transition metal trifluoroacetate was not required, and similar results could be obtained through the use of acetates and acetylacetonates, all of which are commercially available.
In addition to synthesis, this study also probes the electronic structure of the resulting nanocrystals using X-ray absorption spectroscopy (XAS), which provides insight into their bonding character by complementary insight at both the transition metal center and the fluoride anion. The resulting materials were characterized by a variety of techniques to confirm the desired chemical composition, structure, and morphology.
2 Experimental
Nickel(II) acetylacetonate, iron(II) acetate, cobalt(II) acetylacetonate, manganese(II) acetate, potassium trifluoroacetate, 1-octadecene, and oleic acid were purchased from Sigma-Aldrich and used without further purification. Oleylamine was purchased from Sigma-Aldrich and was held at 120 °C, degassed, and refilled with nitrogen gas three times over at least a 4 hour period prior to use.2.1 KMF3 (M = Fe, Co, Ni) and K3MF6 (M = V, Fe) nanocrystals via co-thermolysis
Potassium trifluoroacetate and the metal precursor were weighed in an argon filled glovebox in stoichiometric amounts described in Table 1 and added to a 50 mL three-neck round bottom flask. The flask was quickly attached to a Schlenk line flowing nitrogen gas. Oleylamine (1.93 g, 6.55 mmol), oleic acid (3.73 g, 13.23 mmol), and 1-octadecene (5.05 g, 20.15 mmol) were stirred vigorously before being added to the flask containing the solids to create a homogeneous solution. The mixture was stirred vigorously, heated to 120 °C at 10 °C min−1, evacuated and refilled with nitrogen three times over a 2 hour period. The solution was subsequently heated to 290 °C at 10 °C min−1 (unless described otherwise in Table 1) and held there for 1 hour. Lastly, the solution was allowed to cool naturally to 70 °C. At 70 °C, ethanol (20 mL, 200 proof) was added. The precipitated mixture was then centrifuged at 10![[thin space (1/6-em)]](https://www.rsc.org/images/entities/char_2009.gif) 000 rpm for 5 min, the supernatant removed, and the solid redispersed in hexane (5 mL). Vortexing and sonication were used to aid redispersion before being reprecipitated with ethanol (10 mL). This procedure was repeated 3–5 times before characterization of the resulting nanocrystals.
000 rpm for 5 min, the supernatant removed, and the solid redispersed in hexane (5 mL). Vortexing and sonication were used to aid redispersion before being reprecipitated with ethanol (10 mL). This procedure was repeated 3–5 times before characterization of the resulting nanocrystals.
| Material | Precursor (+K(CF3COO)) | Method | K![[thin space (1/6-em)]](https://www.rsc.org/images/entities/char_2009.gif) : :![[thin space (1/6-em)]](https://www.rsc.org/images/entities/char_2009.gif) M/mmol M/mmol |
TEM size/nm | Scherrer analysis/nm |
|---|---|---|---|---|---|
| a Degassed at 60 °C. b Final reaction temperature, 200 °C. | |||||
| KMnF3 | Mn(CH3COO)2 | Hot-injection | 4![[thin space (1/6-em)]](https://www.rsc.org/images/entities/char_2009.gif) : :![[thin space (1/6-em)]](https://www.rsc.org/images/entities/char_2009.gif) 2 2 |
∼15 | |
| KFeF3 | Fe(CH3COO)2 | Co-thermolysis | 2![[thin space (1/6-em)]](https://www.rsc.org/images/entities/char_2009.gif) : :![[thin space (1/6-em)]](https://www.rsc.org/images/entities/char_2009.gif) 1 1 |
∼350 | |
| Hot-injectiona | 4![[thin space (1/6-em)]](https://www.rsc.org/images/entities/char_2009.gif) : :![[thin space (1/6-em)]](https://www.rsc.org/images/entities/char_2009.gif) 2 2 |
12.1 ± 13.8 | 30 | ||
| K3FeF6 | Fe(CH3COO)2 | Co-thermolysisb | 2![[thin space (1/6-em)]](https://www.rsc.org/images/entities/char_2009.gif) : :![[thin space (1/6-em)]](https://www.rsc.org/images/entities/char_2009.gif) 1 1 |
∼150 | |
| KCoF3 | Co(CH3COCHCOCH3)2 | Co-thermolysis | 2![[thin space (1/6-em)]](https://www.rsc.org/images/entities/char_2009.gif) : :![[thin space (1/6-em)]](https://www.rsc.org/images/entities/char_2009.gif) 1 1 |
∼100 | |
| Hot-injection | 2![[thin space (1/6-em)]](https://www.rsc.org/images/entities/char_2009.gif) : :![[thin space (1/6-em)]](https://www.rsc.org/images/entities/char_2009.gif) 1 1 |
14.2 ± 10.9 | 31 | ||
| KNiF3 | Ni(CH3COCHCOCH3)2 | Co-thermolysis | 3![[thin space (1/6-em)]](https://www.rsc.org/images/entities/char_2009.gif) : :![[thin space (1/6-em)]](https://www.rsc.org/images/entities/char_2009.gif) 1 1 |
12.2 ± 3.1 | 12 |
| K3VF6 | V(CH3COCHCOCH3)3 | Co-thermolysis | 2![[thin space (1/6-em)]](https://www.rsc.org/images/entities/char_2009.gif) : :![[thin space (1/6-em)]](https://www.rsc.org/images/entities/char_2009.gif) 1 1 |
67.0 ± 29.8 | 38 |
2.2 KMF3 (M = Mn, Fe, Co) nanocrystals via hot injection
Potassium trifluoroacetate and the metal precursor were weighed in an argon filled glovebox in stoichiometric amounts described in Table 1 and added to separate 50 mL three-neck round bottom flasks under a flow of nitrogen. Oleylamine (6.55 mmol, 1.93 g), oleic acid (13.23 mmol, 3.73 g), and 1-octadecene (13.23 mmol, 5.05 g) were stirred vigorously before being split evenly between the two flasks containing the solids. The mixtures were stirred vigorously, heated to 120 °C at 10 °C min−1 (unless described otherwise in Table 1), evacuated and refilled with nitrogen three times over a 2 hour period. The potassium solution was then heated to 290 °C at 10 °C min−1, while the metal solution was kept at its degassing temperature. A cannula was used to pierce and connect the two flasks, and using vacuum, the metal precursor solution was injected into the potassium solution as quickly as possible. The resulting solution settled at 220 °C before being heated at 20 °C min−1 to the final reaction temperatures as described in Table 1. The solution was held for 5 min before being allowed to cool naturally to 70 °C. At 70 °C, ethanol (20 mL, 200 proof) was added. The precipitated mixture was then centrifuged at 10![[thin space (1/6-em)]](https://www.rsc.org/images/entities/char_2009.gif) 000 rpm for 5 min, the supernatant removed, and the solid redispersed in hexane (5 mL). Vortexing and sonication were used to aid redispersion before being reprecipitated with ethanol (10 mL). This procedure was repeated 3–5 times before characterization of the resulting nanocrystals.
000 rpm for 5 min, the supernatant removed, and the solid redispersed in hexane (5 mL). Vortexing and sonication were used to aid redispersion before being reprecipitated with ethanol (10 mL). This procedure was repeated 3–5 times before characterization of the resulting nanocrystals.
2.3 Characterization
Powder X-ray diffraction (XRD) patterns were obtained using a Bruker D8 Advance diffractometer set up in the Bragg–Brentano configuration, using a Cu Kα (λ = 1.5418 Å) source with a step size of 0.02° and a collection time of 1 s per step. The samples were sonicated in hexane before being drop cast onto a Si{111}, zero background wafer and scanned in air. Efforts were made to quantitatively measure representative fractions of the samples and avoid size selection. Transmission electron microscopy (TEM) images were obtained using a JEOL 3010 at 300 keV on glassy carbon coated copper grids (Ted Pella). Size analysis was conducted manually on at least 300 nanocrystals of each material using ImageJ software. All data were collected in accordance to currently accepted methods of nanocrystal size analysis.18,19XAS was carried out at selected transition metal K- and L-edges, as well as the F K-edge. Samples for measurements at all L-edges and the F K-edge (680 eV to 720 eV) were prepared by drying the powder in a 60 °C vacuum oven, followed by brushing onto carbon tape inside an argon-filled glovebox. Measurements were carried out at beamlines 4-ID-C at the Advanced Photon Source (APS), 8.0.1 at the Advanced Light Source (ALS), and 8-2 at the Stanford Synchrotron Radiation Lightsource (SSRL). At the APS, samples were loaded into the chamber in a glove bag under positive pressure of argon. The measurements were collected at 1 × 10⁻⁹ Torr, simultaneously in both the total electron yield (TEY) and total fluorescence yield (TFY) mode, respectively. At the ALS, samples were loaded into a sealed transfer vessel filled with argon. The measurements were performed at 5 × 10⁻⁹ Torr. Data were collected using a current amplifier (Keithley) (TEY) and a Channeltron (TFY) analyzer. At the SSRL, samples were mounted onto an aluminium sample bar using carbon tape inside a nitrogen glovebox, and transferred without exposure via a nitrogen filled glove bag into the load lock chamber. The measurements were all performed in a single load at 3 × 10⁻⁹ Torr, simultaneously collecting the TEY (via the sample drain current), TFY (from a silicon diode, AXUV-100), and Auger electron yield (AEY) using a double-pass cylindrical mirror analyzer at 200 V pass energy. All spectra were normalized to the incoming flux measured from a gold covered mesh upstream of the main chamber.
Fe K-edge XAS was measured at beamline 20-BM-B at the APS. Samples were prepared by finely grinding the dry powdered material with cellulose (as purchased from Sigma Aldrich) as a binder. The concentrations were calculated to be 2.5 × the absorption length of the sample. The mixture was then poured into a hand powered pellet press and compressed to a diameter of 120 mm and a thickness of 25 mm. Lastly, the pellet was sealed between two pieces of Kapton tape. Measurements were made in transmission mode using gas ionization chambers to monitor X-ray intensities. A rhodium-coated X-ray mirror was used to reject any higher-order harmonics.
3 Results and discussion
Recipes of the synthesis of ternary alkali transition metal fluorides available in the literature20–25 involve the co-thermolysis exclusively of fluorinated organometallic precursors, such as metal trifluoroacetates. A double fluorine source method, whereby both the alkali and transition metal precursors are fluorinated organometallics, proved successful for KFeF3 (see the ESI†). The necessity for a fluorinated transition metal precursor was evaluated in this study to simplify the synthetic procedure26–29 using commercial sources of first row transition metal precursors. All fluorides could be prepared using M(CH3COO)2, M(CH3COCHCOCH3)2 or M(CH3COCHCOCH3)3 instead of M(CF3COO)2 as previously reported, with K(CF3COO) as a source of fluorine.3.1 KFeF3 and K3FeF6 nanocrystals
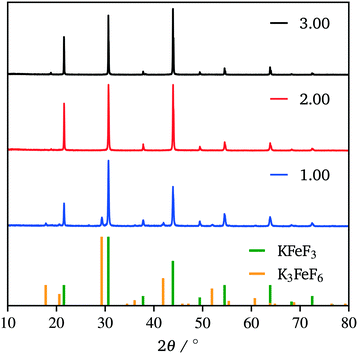
Due to our familiarity with KFeF3 we aimed to synthesize this material first. KFeF3 and K3FeF6 nanocrystals could be synthesized via a co-thermolysis method. Fig. 1 reveals the XRD pattern of the nanocrystal products from this method at different temperatures. Indexing of the patterns shows pure K3FeF6 (PDF# 00-022-1223) at 200 °C and pure KFeF3 (PDF# 00-020-0895) with some minor K3FeF6 at 290 °C, with mixtures of these two phases at intermediate temperatures. Therefore, as the temperature of the reaction was increased, the production of the FeII phase over the FeIII phase was favoured. This observation implies that K3FeF6 is an intermediate in the reactions to produce KFeF3. To test this hypothesis, an aliquot was quenched during co-thermolysis at 290 °C. For comparison purposes, a second final product was prepared after a treatment of co-thermolysis at 290 °C, followed by heating at 200 °C for 40 minutes and cooling to room temperature. As expected, the aliquot at 290 °C consisted entirely of KFeF3, which we confirmed by XRD (Fig. 1). In turn, KFeF3 was also the majority phase in the final product collected after annealing at 200 °C, with a minor K3FeF6 impurity (see Fig. S1†). The result shows that the final reduction step to form KFeF3 is not reversible. To ensure the purity of the precursor and to avoid inadvertently starting from a FeIII material, the purity of Fe(CH3COO)2 was ensured to match the infrared(IR) spectrum (Fig. S2†) from a previous study.30 Therefore, the initial oxidation of FeII to FeIII, before reducing back to FeII, was unexpected and would require further study.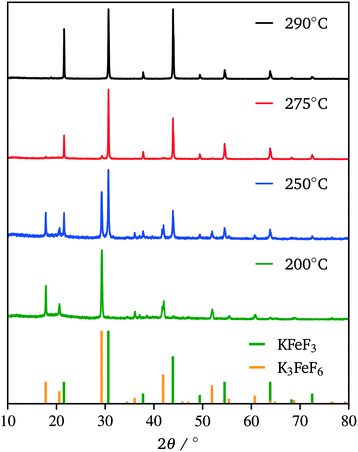 | ||
| Fig. 1 XRD patterns of the co-thermolysis product at different reaction temperatures. Reference patterns correspond to KFeF3 (PDF# 00-020-0895) and K3FeF6 (PDF# 00-022-1223). | ||
The production of KFeF3 and K3FeF6 was also independent of the initial stoichiometry of the precursors. Fig. 2 shows the resulting XRD patterns of the co-thermolysis products, each with different ratios of the precursor materials in the form of a very similar product purity of KFeF3, with  at 290 °C. In each case, KFeF3 with a similar purity was obtained, although
  showed some K3FeF6. On decreasing the molar ratio of potassium trifluoroacetate to the transition metal precursor, there was no noticeable change in the yield of KMF3, but the purity decreased with some K3FeF6 being present.
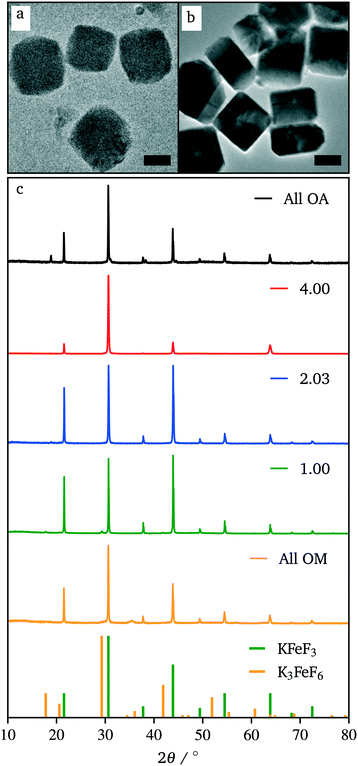
While the co-thermolysis of trifluoroacetates of both potassium and iron produced sub-50 nm nanocrystals (Fig. S3†), the use of transition metal acetates led to larger particles of over 100 nm, both in the case of KFeF3 and K3FeF6 (Fig. 3a and 4b). All traditional means of crystal size control were evaluated with the goal of a mean size distribution of <100 nm. These included (i) the choice and concentration of metal precursors31 (control of the growth mechanism and supersaturation), (ii) variation in the surfactant composition4,32–34 (control of the growth rate), and (iii) reaction temperature1,21 (control of the nucleation and growth rate). The concentration of the transition metal seemed to have little effect on the size of the resultant nanocrystals (Fig. S4†). Fig. 3 shows XRD patterns corresponding to a variation of the molar ratio between oleylamine (OM) and oleic acid (OA). This change in the surfactant ratio did not produce noticeable changes in the crystal size after co-thermolysis, as seen from the lack of any obvious broadening in the widths of the XRD peaks.
Removal of all oleylamine from the reaction resulted in impurities, while an increase in the molar ratio of oleylamine resulted in a pronounced decrease in the intensity of the diffraction reflections corresponding to the <100> crystallographic direction. This observation suggests that while size control was not achieved with the surfactant composition, some change in relative facet abundance is observed. This conclusion was confirmed in the TEM images (Fig. 3). While rounded particles were obtained in 100% oleic acid, the presence of oleylamine led to cubic nanocrystals. A similar control over the shape resulting in a relative concentration of oleic acid to oleylamine has been demonstrated in fluoride nanocrystals.9,20,21,31–35 As in that case, it is presumable that the affinity of oleylamine for a certain crystal facet changed the overall shape of the nanocrystal. It is well established to arise from the different surface energies of each crystal facet, causing different affinities for surfactant and precursor attachment at the surface.36
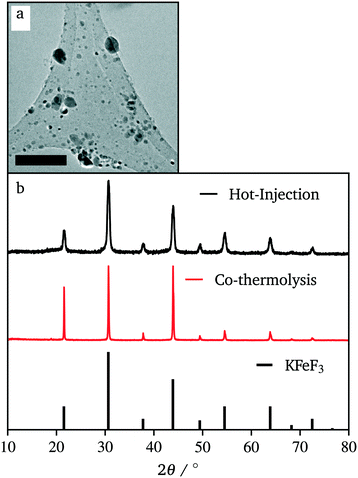
In efforts to define and control the nucleation period, iron(II) acetate was injected into a hot flask containing potassium trifluoroacetate. This hot-injection proved to be the most helpful to achieve sub-50 nm crystals. Fig. 5 shows the XRD pattern and a representative TEM image of the resulting product. Compared to co-thermolysis (Fig. 1), no XRD peaks assigned to K3FeF6 were observed. The product of hot-injection showed substantially wider diffraction peaks than that of co-thermolysis. However, each peak showed a broad baseline, suggesting the overlap of very small, wide peaks and tall, thin peaks. This effect was due to a bimodal distribution of particle sizes. Indeed, the TEM images of the product show that some nanocrystals were very small (∼10 nm), but there was a dispersion in size, with crystals up to 80 nm. Although these distributions were not ideal, the significant difference in size means that the two populations can be separated easily using standard methods such as size selective precipitation.
This approach to the synthesis of KFeF3 shows the reliability of fast nucleation to affect the size of the resulting nanocrystal. Furthermore, the reliability of temperature to define the dominant phase shows that the intermediate, metastable phase of this reaction is K3FeF6 while the thermodynamically stable product is KFeF3.
3.2 Nanocrystal syntheses with other transition metals
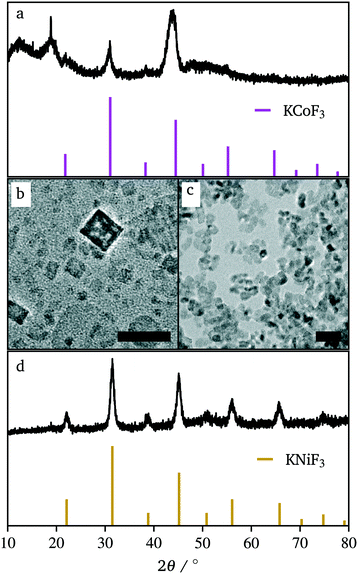
In efforts to expand this synthetic model to other first row transition metals, variants with Mn, Ni, and Co were investigated.KMnF3 could be synthesized via hot-injection (Fig. S5†). The XRD pattern shows wide peaks, with peak intensities as expected compared to the reference pattern (PDF# 00-017-0116). This shows that the sample underwent no preferred orientation, or preferred facet growth during synthesis. Due to ample examples of KMnF3 nanocrystals in the literature, this material was not investigated any further.12–17 KNiF3 nanocrystals were produced through a simple co-thermolysis (Fig. 6 and Table 1). The XRD pattern of the crystals could be indexed to KNiF3 (PDF# 00-021-1002) without the presence of impurities. Fig. 6c shows a TEM image of the KNiF3 nanocrystals synthesized by co-thermolysis at different stoichiometric ratios of precursors, with sizes around 15 nm. As in the case of KFeF3, attempts to synthesize KCoF3 nanocrystals through co-thermolysis of Co(CH3COCHCOCH3)2 resulted in particles with sizes around 100 nm. Thin nanoplates of KCoF3 were obtained through the hot-injection method. The products obtained from a reaction at 290 °C (Table 1) were almost transparent (Fig. S6a†), with moiré fringes being observed for some overlapping particles. Variations in the  ratio led to subtle changes in the shape and relative intensity of the XRD peaks, which largely matched KCoF3 (PDF# 00-018-1006), with the exception again of an impurity at 18° in
  . The clear difference in relative peak intensities between the samples and the reference pattern is indicative of preferential orientation due to anisotropic crystal growth. Further analysis of moiré fringes and making use of high-resolution TEM could provide greater insight into the growth directions of the crystal.
In this case, the specific nanocrystal mean size was found to be notably affected by the order in which the reagents were injected. Fig. S7† compares the XRD data for  depending on the order of injection of the metal solutions into the main reaction vessel. When the potassium solution (at 120 °C) was injected to the cobalt solution (at 290 °C), large particles formed. Only when the cobalt solution (at 120 °C) was injected into the potassium solution (at 290 °C) did sub-50 nm nanocrystals form. The figure shows the drastic difference in Scherrer broadening and therefore particle size. This effect implies that the rate of nucleation can be increased by decomposing the reagents at different temperatures and combining them into one solution. In the former case, the decomposition of potassium trifluoroacetate in the solvent mixture was not complete at 120 °C, and injecting the precursor to a hot solution of cobalt(II) acetylacetonate resulted in slow decomposition as the temperature ramped, thereby limiting the nucleation rate. The latter experiment shows the opposite; potassium acetate was decomposed at 290 °C and therefore nucleation was not limited immediately after injection.
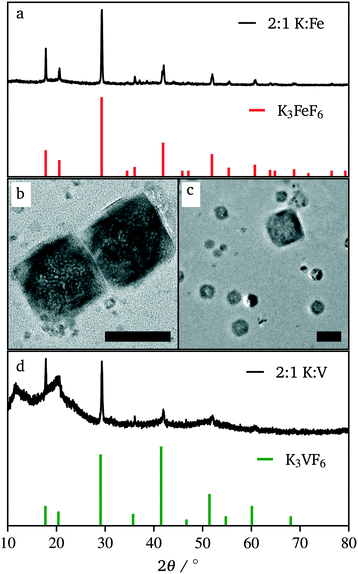
Synthesis beyond K3FeF6 was also attempted. Fig. 4c and d shows TEM and XRD data respectively for co-thermolytic synthesis of K3VF6. TEM reveals nanocrystals of ∼75 nm, while XRD data show sharp diffraction peaks representative of this size throughout the entire nanocrystal population. It should be noted that the broad hump at 20° and XRD peak intensities not matching the reference pattern (PDF# 00-022-0868) are due to the nature of the collected product; K3VF6 could not be collected as a dry powder, and likely still had a lot of organic surfactants on the surface of the particles. It should also be noted that the starting material, V(CH3COCHCOCH3)3, is a VIII compound, which demonstrates that this technique of a single fluorine source can be used with both transition metal III and II oxidation states.
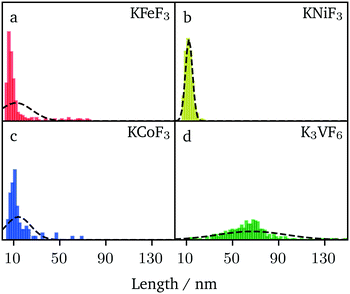
A comparative analysis of the size of the nanocrystals prepared by hot-injection (KFeF3 and KCoF3) and co-thermolysis (KNiF3 and K3VF6) is presented in Fig. 7. The average (mean) sizes of particles and crystallites for all the compounds were collected from TEM and XRD via Scherrer analysis, respectively, and are shown in Table 1. It is worth noting that sizes below 20 nm were obtained in many cases, highlighting the value of the synthetic approach. The results of KFeF3 and KCoF3 reinforce the idea that hot-injection reduced the crystal size by an order of magnitude compared to co-thermolysis, which was only equally effective for KNiF3.
The size distributions were narrow for KNiF3, moderate for KFeF3 and KCoF3, and wide for K3VF6. However these particles are not within  (σ = standard deviation, d = mean), proposed in the literature as a limit to label samples as monodisperse.19 Further efforts would be needed to further narrow the distribution of these nanocrystals. Only a single normal distribution curve was overlaid to each histogram, but the distribution of KFeF3 obtained by hot-injection may benefit from a bimodal fit, as a large number of outliers exist at 40 nm to 80 nm. The mean particle sizes collected through TEM were of the same order as the crystallite size calculated by Scherrer analysis (Table 1).
To the best of our knowledge, these syntheses result in the lowest mean sizes of KMF3 (M = Mn–Ni) and K3MF6 (M = V, Fe) currently found in the literature.
3.3 Soft X-ray absorption spectroscopy
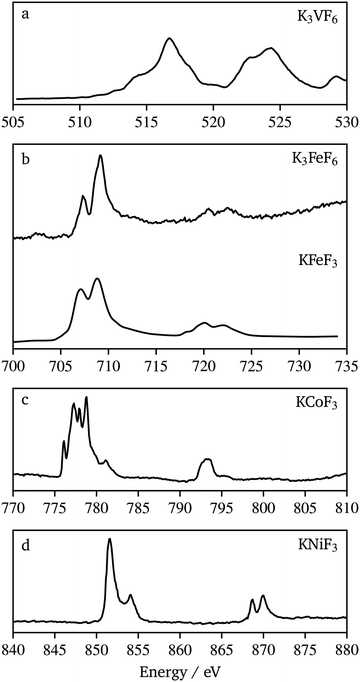
Probing M–F hybridization effects in these compounds would allow fundamental understanding of redox processes that could be possible with these materials, in view of their potential use as active materials for alkali-ion battery electrodes. To probe the chemical bonding, XAS at both the transition metal and fluorine L and K-edges was used. K-edge XAS probes the transitions of core, 1s electrons to unoccupied 2p states while L-edges arise from the 2p → 3d dipole allowed transitions.Fig. 8 shows the transition metal L-edge spectra of each material synthesized in this work. Each spectrum consists of two regions, the L3 at lower energy and the L2 at higher energy. These regions arise from the spin–orbit splitting of the core level 2p3/2 and 2p1/2 orbitals, respectively. The K3VF6 V L-edge (510 eV to 530 eV) splits into the L3 (510 eV to 520 eV) region and L2 (520 eV to 530 eV) region. Each of these regions is made up of several overlapping peaks that appear here as shoulders (e.g. 514 eV, 518 eV, and 521.5 eV) to the main peaks. The signals in the L3 region of K3FeF6, KFeF3 (705 eV to 712 eV) and KNiF3 (850 eV to 855 eV) were each split into two peaks, while in KCoF3 (775 eV to 783 eV) they were split finely into multiple peaks. The L2 region for K3FeF6, KFeF3 (720 eV to 725 eV) and KNiF3 (868 eV to 872 eV) further splits into two peaks, while this region in KCoF3 (792 eV to 795 eV) shows a rather broad feature with a shoulder at high energy. A comparison of KCoF3 (Fig. 8c) with literature data for CoF2 (ref. 37) revealed similarities in the fine splitting of multiplet peaks, confirming the presence of CoII in the ternary fluoride. It should be noted however that the multiplet peaks of L3 in KCoF3 have slightly different peak intensities when compared with CoF2. Likewise, the Ni L-edge spectrum of KNiF3 (Fig. 8d) presents multiplets in L3 and L2, characteristic of NiII compounds, such as NiF2 and NiO (ref. 38 and 39), which are due to coulomb and exchange interactions between the core hole and the 3d shell. The peak location and shape in the V L-edge spectrum of K3VF6 compared well to other VIII compounds found in the literature.40 The peak seen at 529 eV can be attributed to the oxygen signal from impurities in the sample due to the surfactants and colloidal methods used to prepare the nanocrystals, as well as the carbon support used to mount the powders. These comparisons confirm that the oxidation states of our samples are all as expected when compared to literature samples of their binary counterparts.
The K3FeF6 and KFeF3 Fe L-edge spectra (Fig. 8b) appear to be similar in peak shape and energy when compared to literature examples of FeF3 and FeF2,41 as well as our own previous studies on KFeF3.5 The peak splitting in the L3 region appears as peaks at 707.3 eV and 709.1 eV. The high intensity of the peak feature in K3FeF6 (Fig. 8b) is consistent with the presence of FeIII in the sample. The opposite is characteristic of FeII compounds. However the TEY spectrum of KFeF3 nanocrystals synthesized in this study (Fig. 8b) shows an almost equal intensity between the peak at 707.3 eV and the peak at 709.1 eV, suggesting a mixed FeII/FeIII state.
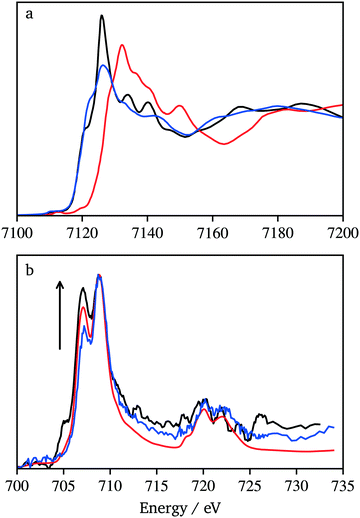
The Fe L-edge XAS data can be affected by surface impurities because signal detection occurred through the generation of photoelectrons that have shallow escape lengths. Therefore, data were also collected at the Fe K-edge for KFeF3, and as-purchased FeF3 and FeF2 samples (Fig. 9a). The high energy X-rays (over 7000 eV) allow measurements in transmission mode where the bulk state of the sample dominates the signal. As expected, the Fe K-edge spectrum of KFeF3 presents a white line with an edge jump at a similar energy to FeF2 and 6 eV lower than FeF3. This confirmed that the bulk of the ternary fluoride was FeII. Further evidence of gradients in the oxidation state with the probing depth resulted from comparing the Fe L-edge spectra of KFeF3 collected in AEY (1 nm probing depth), TEY (∼1 nm to 3 nm probing depth) and TFY (>10 nm probing depth) modes (Fig. 9b). The spectra gained intensity at 707.3 eV, at the expense of 709.1 eV, as the probing depth increased. The spectrum shows that the KFeF3 edge is closer to that of FeF2 than FeF3. Overall, the results lead to the conclusion that the KFeF3 sample contains a majority of FeII, with a surface layer of FeIII. To rule out the possibility of the formation of Fe2O3 on the surface, and in addition to manipulating the sample under conditions as rigorously free of air as possible, O K-edge data were also recorded (Fig. S8†). The spectrum is very close to reference data for the carbon tape substrate. In contrast, the spectrum presents notable differences compared to literature data for Fe2O3.42 These data rule out a significant contribution of surface oxidation, and instead suggest that FeIII remained on the surface of the KFeF3 nanocrystals. The origin of these electronic defects at the surface of the crystals is unclear. It is worth noting that defective K1−xFeF3 structures have been reported to exist in the literature.43 These deficient compositions would show FeIII; it is possible that they are favoured on the surface of the nanocrystals.
Fig. 10 shows F K-edge data for K3VF6, K3FeF6, KFeF3, KNiF3, and KCoF3. These spectra again compared well in the edge energy and overall peak shape with the data for corresponding binary fluorides (VF3, FeF3, FeF2, CoF2, and NiF2) found in the literature.44,45 The spectra show a similar peak shape throughout the series. The position of the absorption edge, at 690 eV, was maintained throughout the series. The post-edge region (690 eV to 720 eV), associated with transitions involving metal 4sp–F 2s states,44 was similar, with some minor differences throughout the series. The most pronounced differences were observed in the pre-edge region (680 eV to 690 eV), which corresponds to transitions associated with metal 3d–F 2p hybridized states and tends to increase in intensity with covalence.46 In the case of KMF3, the pre-edge peak was found to emerge and shift to lower energy with increasing atomic number. The pre-edge features in the F data of KCoF3 and, especially, KNiF3 suggest the existence of hybridization between cations and anions. The observed covalence shrinks the band gap, which explains the resulting powder colors from the synthesized nanocrystals (Fig. S9†). A clear pre-edge with a complex line shape was also observed for K3VF6, whereas washed out signals were found in K3FeF6. The trends in the pre-edge intensity with specific transition metals mirrored those reported for binary fluorides.42 Nonetheless, it should be noted that MII ternary fluorides possess much more defined peaks at energies greater than 690 eV when compared to NiF2, CoF2,44 and FeF2 (ref. 45) (Fig. S10†). A possible explanation for this could be the increased long range order in the perovskite structure. These changes are not reflected in the K3MF6 materials.
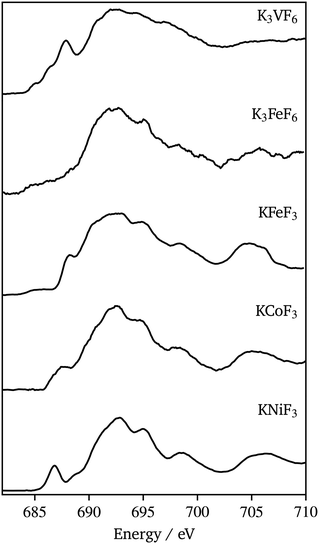 | ||
| Fig. 10 Fluorine K-edge XAS (total fluorescence yield) spectra of K3VF6, K3FeF6, KFeF3, KCoF3, and KNiF3 nanoparticles. | ||
4 Conclusion
This work reports the synthesis of nanocrystals of KMF3 (M = Mn–Ni) and K3MF6 (M = V) whereby only one reagent was fluorinated. K3FeF6 was isolated as an intermediate product in the synthesis of KFeF3. In the case of KCoF3 and KFeF3, the particle shape and facet growth was found to change with the surfactant ratio and relative precursor stoichiometry, producing very thin nanoplates to some extent. The greatest control over the size and dispersion of the perovskite nanocrystals was achieved using hot injections to quickly introduce and decompose the reagents simultaneously. The formal redox states of the metals were found to be consistent with the stoichiometry of the materials in the bulk of the nanocrystal. Combining the bulk signal from Fe K-edge, and varying the probing depths of the signal from Fe L-edge spectroscopy, we have shown that the synthesis of KFeF3 through hot-injection resulted in residual FeIII on the surface of the nanocrystal. The surface species is not obtained as a result of oxidation and would require further study. Production of highly crystalline nanometric fluorides using the generalizable recipes developed in this study will enable investigation of their use as materials for a variety of applications.Conflicts of interest
There are no conflicts to declare.Acknowledgements
Support for this research was provided by research start-up funding by the Department of Chemistry and the College of Liberal Arts and Sciences at the University of Illinois at Chicago. Initial synthetic design work at the Molecular Foundry was supported by the Office of Science, Office of Basic Energy Sciences, of the U.S. Department of Energy under Contract No. DE-AC02-05CH11231. This research used resources of the Advanced Light Source, which is a DOE Office of Science User Facility under contract no. DE-AC02-05CH11231. The use of the Advanced Photon Source was supported by the U. S. Department of Energy, Office of Science, Office of Basic Energy Sciences, under Contract No. DE-AC02-06CH11357. The use of the Stanford Synchrotron Radiation Lightsource, SLAC National Accelerator Laboratory, is supported by the U.S. Department of Energy, Office of Science, Office of Basic Energy Sciences under Contract No. DE-AC02-76SF00515. The authors specifically thank Drs. Jingua Guo and Yi-Sheng Liu of the Advanced Light Source, and Dr. Mahalingam Balasubramanian of the Advanced Photon Source for help in preforming XAS measurements.References
- J. Park, J. Joo, S. G. Kwon, Y. Jang and T. Hyeon, Angew. Chem., Int. Ed., 2007, 46, 4630–4660 CrossRef CAS PubMed.
- C. de Mello Donegá, P. Liljeroth and D. Vanmaekelbergh, Small, 2005, 1, 1152–1162 CrossRef PubMed.
- A. S. Aricò, P. Bruce, B. Scrosati, J.-M. Tarascon and W. van Schalkwijk, Nat. Mater., 2005, 4, 366–377 CrossRef PubMed.
- G. Shao, G. Chen, W. Yang, T. Ding, J. Zuo and Q. Yang, Langmuir, 2014, 30, 2863–2872 CrossRef CAS PubMed.
- T. Yi, W. Chen, L. Cheng, R. D. Bayliss, F. Lin, M. R. Plews, D. Nordlund, M. M. Doeff, K. A. Persson and J. Cabana, Chem. Mater., 2017, 29, 1561–1568 CrossRef CAS.
- A. C. Garcia-Castro, A. H. Romero and E. Bousquet, Phys. Rev. Lett., 2016, 116, 117202 CrossRef CAS PubMed.
- R. Ding, X. Li, W. Shi, Q. Xu, X. Han, Y. Zhou, W. Hong and E. Liu, J. Mater. Chem. A, 2017, 5, 17822–17827 RSC.
- D. Cao, C. Yin, D. Shi, Z. Fu, J. Zhang and C. Li, Adv. Funct. Mater., 2017, 27, 1701130 CrossRef.
- H.-X. Mai, Y.-W. Zhang, R. Si, Z.-G. Yan, L.-D. Sun, L.-P. You and C.-H. Yan, J. Am. Chem. Soc., 2006, 128, 6426–6436 CrossRef CAS PubMed.
- H.-X. Mai, Y.-W. Zhang, L.-D. Sun and C.-H. Yan, J. Phys. Chem. C, 2007, 111, 13730–13739 CrossRef CAS.
- E.-H. Song, S. Ding, M. Wu, S. Ye, F. Xiao, G.-P. Dong and Q.-Y. Zhang, J. Mater. Chem. C, 2013, 1, 4209 RSC.
- J. Wang, F. Wang, C. Wang, Z. Liu and X. Liu, Angew. Chem., Int. Ed., 2011, 50, 10369–10372 CrossRef CAS PubMed.
- Z. Huang, M. Yi, H. Gao, Z. Zhang and Y. Mao, J. Alloys Compd., 2017, 694, 241–245 CrossRef CAS.
- B. D. Dhanapala, H. N. Munasinghe, L. Suescun and F. A. Rabuffetti, Inorg. Chem., 2017, 56, 13311–13320 CrossRef CAS PubMed.
- L. N. Hao, K. Liu, S. Cheng, Y. Wang, Y. J. Xu and H. S. Qian, Mater. Lett., 2017, 196, 145–148 CrossRef CAS.
- Y. Zhang, F. Wang, Y. Lang, J. Yin, M. Zhang, X. Liu, D. Zhang, D. Zhao, G. Qin and W. Qin, J. Mater. Chem. C, 2015, 3, 9827–9832 RSC.
- L. Lei, J. Zhou, J. Zhang and S. Xu, CrystEngComm, 2015, 17, 8457–8462 RSC.
- M. Baalousha and J. R. Lead, Nat. Nanotechnol., 2013, 8, 308–309 CrossRef CAS PubMed.
- C. J. Murphy and J. M. Buriak, Chem. Mater., 2015, 27, 4911–4913 CrossRef CAS.
- Y.-P. Du, Y.-W. Zhang, L.-D. Sun and C.-H. Yan, Dalton Trans., 2009, 8574–8581 RSC.
- Y.-P. Du, Y.-W. Zhang, Z.-G. Yan, L.-D. Sun, S. Gao and C.-H. Yan, Chem. – Asian J., 2007, 2, 965–974 CrossRef CAS PubMed.
- J. Boyer, L. Cuccia and J. Capobianco, Nano Lett., 2007, 7, 847–852 CrossRef CAS.
- F. Vetrone, R. Naccache, V. Mahalingam, C. G. Morgan and J. A. Capobianco, Adv. Funct. Mater., 2009, 19, 2924–2929 CrossRef CAS.
- V. Mahalingam, F. Vetrone, R. Naccache, A. Speghini and J. A. Capobianco, J. Mater. Chem., 2009, 19, 3149–3152 RSC.
- E. M. Chan, G. Han, J. D. Goldberg, D. J. Gargas, A. D. Ostrowski, P. J. Schuck, B. E. Cohen and D. J. Milliron, Nano Lett., 2012, 12, 3839–3845 CrossRef CAS PubMed.
- M. Puri, R. D. Sharma and R. C. Verma, Synth. React. Inorg. Met.-Org. Chem., 1981, 11, 539–546 CrossRef CAS.
- F. Calderazzo, U. Englert, G. Pampaloni, V. Passarelli, G. Serni and R. Wang, Can. J. Chem., 2001, 79, 495–501 CrossRef CAS.
- N. Iranpoor and H. Adibi, Bull. Chem. Soc. Jpn., 2000, 73, 675–680 CrossRef CAS.
- F. Marchetti, F. Marchetti, B. Melai, G. Pampaloni and S. Zacchini, Inorg. Chem., 2007, 46, 3378–3384 CrossRef CAS PubMed.
- H. G. M. Edwards and I. R. Lewis, J. Mol. Struct., 1993, 296, 15–20 CrossRef CAS.
- X. Sun, Y.-W. Zhang, Y.-P. Du, Z.-G. Yan, R. Si, L.-P. You and C.-H. Yan, Chemistry, 2007, 13, 2320–2332 CrossRef CAS PubMed.
- Y. Yamada, T. Doi, I. Tanaka, S. Okada and J.-I. Yamaki, J. Power Sources, 2011, 196, 4837–4841 CrossRef CAS.
- E. M. Chan, C. Xu, A. W. Mao, G. Han, J. S. Owen, B. E. Cohen and D. J. Milliron, Nano Lett., 2010, 10, 1874–1885 CrossRef CAS PubMed.
- N. R. Jana, Y. Chen and X. Peng, Chem. Mater., 2004, 16, 3931–3935 CrossRef CAS.
- Y. Lu, Z.-Y. Wen, J. Jin, X.-W. Wu and K. Rui, Chem. Commun., 2014, 50, 6487–6490 RSC.
- Y.-W. Jun, M. F. Casula, J.-H. Sim, S. Y. Kim, J. Cheon and A. P. Alivisatos, J. Am. Chem. Soc., 2003, 125, 15981–15985 CrossRef CAS.
- D. K. Bora, X. Cheng, M. Kapilashrami, P. A. Glans, Y. Luo and J.-H. Guo, J. Synchrotron Radiat., 2015, 22, 1450–1458 CrossRef CAS PubMed.
- H. Wang, P. Ge, C. G. Riordan, S. Brooker, C. G. Woomer, T. Collins, C. A. Melendres, O. Graudejus, N. Bartlett and S. P. Cramer, J. Phys. Chem. B, 1998, 102, 8343–8346 CrossRef CAS.
- H. Wang, S. M. Butorin, A. T. Young and J. Guo, J. Phys. Chem. C, 2013, 117, 24767–24772 CrossRef CAS.
- D. Maganas, M. Roemelt, T. Weyhermüller, R. Blume, M. Hävecker, A. Knop-Gericke, S. DeBeer, R. Schlögl and F. Neese, Phys. Chem. Chem. Phys., 2014, 16, 264–276 RSC.
- M. S. M. Saifullah, G. A. Botton, C. B. Boothroyd and C. J. Humphreys, J. Appl. Phys., 1999, 86, 2499–2504 CrossRef CAS.
- F. M. F. de Groot, M. Grioni, J. C. Fuggle, J. Ghijsen, G. A. Sawatzky and H. Petersen, Phys. Rev. B, 1989, 40, 5715–5723 CrossRef CAS.
- S. A. Reisinger, M. Leblanc, A.-M. Mercier, C. C. Tang, J. E. Parker, F. D. Morrison and P. Lightfoot, Chem. Mater., 2011, 23, 5440–5445 CrossRef CAS.
- A. S. Vinogradov, S. I. Fedoseenko, S. A. Krasnikov, A. B. Preobrajenski, V. N. Sivkov, D. V. Vyalikh, S. L. Molodtsov, V. K. Adamchuk, C. Laubschat and G. Kaindl, Phys. Rev. B, 2005, 71, 045127 CrossRef.
- W. Yang, X. Liu, R. Qiao, P. Olalde-Velasco, J. D. Spear, L. Roseguo, J. X. Pepper, Y. D. Chuang, J. D. Denlinger and Z. Hussain, J. Electron Spectrosc. Relat. Phenom., 2013, 190, 64–74 CrossRef CAS.
- J. Suntivich, W. T. Hong, Y.-L. Lee, J. M. Rondinelli, W. Yang, J. B. Goodenough, B. Dabrowski, J. W. Freeland and Y. Shao-Horn, J. Phys. Chem. C, 2014, 118, 1856–1863 CrossRef CAS.
Footnote |
| † Electronic supplementary information (ESI) available: Description of synthesis of KFeF3 nanocrystals using iron trifluoroacetate. Full characterization data for materials in this study, including infrared spectroscopy, temperature profile information for KFeF3, results of further parameters used in reactions, and X-ray absorption spectroscopy data providing comparison between standards and samples. See DOI: 10.1039/c8ce01349g |
| This journal is © The Royal Society of Chemistry 2019 |

