Rapid room temperature conversion of hydroxy double salt to MOF-505 for CO2 capture†
Yongwei
Chen
a,
Houxiao
Wu
a,
Qiangqiang
Xiao
a,
Daofei
Lv
a,
Feier
Li
a,
Zhong
Li
a and
Qibin
Xia
 *ab
*ab
aSchool of Chemistry and Chemical Engineering, South China University of Technology, P. R. China. E-mail: qbxia@scut.edu.cn
bGuangdong Provincial Key Lab of Green Chemical Product Technology, South China University of Technology, Guangzhou 510640, P.R. China
First published on 2nd November 2018
Abstract
Given the fact that solvothermal synthesis is the most common synthetic method to obtain metal–organic frameworks (MOFs) on a gram scale, it still remains a great challenge to produce MOFs in a scalable and sustainable synthetic process. In this work, we develop a facile and rapid synthesis of copper-based MOF-505 by the exploitation of layered (Zn,Cu) hydroxy double salt as the intermediate for efficient MOF-505 crystallization at room temperature, in which [(Zn,Cu)(OH)NO3] is synthesized by reacting ZnO with Cu(NO3)2. Under an optimized reaction time of 25 min, MOF-505-25 exhibits a Brunauer–Emmett–Teller (BET) surface area of 1076 m2 g−1 and the pore size is narrowly distributed at 5.9 and 8.0 Å. With respect to CO2 adsorption and separation performance, MOF-505-25 shows a moderate CO2 uptake of 3.51 mmol g−1 at 298 K and 100 kPa and high CO2/CH4 and CO2/N2 adsorption selectivities of 7 and 29. Particularly, the formation of MOF-505 can be completed within a short reaction time (less than 30 min) whilst maintaining high quality. This facile and rapid room temperature synthetic procedure would pave the way for promoting the development of MOF materials large-scale production with minimizing the energy input.
Introduction
Metal–organic frameworks (MOFs) are a prominent class of solid crystalline nanoporous materials, which are composed of metal ions or clusters coordinated with organic ligands through coordination bonds.1 Owing to the special reticular chemistry that endows rationally controlled MOFs with diverse structural features, extraordinarily high porosity and tailorable functionality, MOFs have potential applications in the fields of gas storage, separation, catalysis, and chemical sensing.2–9 In particular towards the application of gas purification and separation, MOFs have been widely investigated in many important separation processes including CO2 capture, paraffin/olefin separation, capture of toxic gases, separation of hexane isomers, and Xe/Kr separation.10–15 Particularly, some well-known MOF materials such as MAF-X25ox,16 HKUST-1,17 NJU-Bai21,18 mmen-CuBTTri,19 SIFSIX series20 and MOF-74 series21,22 have been demonstrated as outstanding adsorbents for CO2 capture to mitigate massive CO2 emission.Furthermore, an ideal MOF material should have high synthesis rates (also termed as the space–time yield) to push forward the process of industrial implementation.23 Currently, the solvothermal method remains the most common synthetic approach to obtain MOFs on a gram scale in the laboratory worldwide.24 However, this synthetic approach tends to be an energy-intensive and time-consuming process, since it generally requires long reaction time, high temperature and pressure, and harsh reaction conditions.25 Provided that MOFs are only obtained under laboratory-scale conditions, their industrial applications will be largely limited and even fail.26 Before industrial application, large-scale production of MOFs is a necessary prerequisite. Thus, there still remains a great challenge for large-scale production, considering the cost of production and the impact on ecological systems.
To this end, several synthetic strategies have been developed to tackle this challenge, such as electrochemical synthesis,27 microwave synthesis,28 mechanochemical synthesis,29 and spray-drying synthesis.30 Although these synthesis routes can substantially reduce the reaction time and temperature for MOF synthesis, significant amounts of external energy are required to drive the chemical reactions.23 Thus, it is imperative to develop an efficient and facile synthetic strategy that enables MOF formation under mild conditions (such as in short reaction time, under atmospheric pressure and at ambient temperature), minimizing the energy input whilst maintaining the MOF quality.31 From a sustainable perspective, room temperature synthesis can be a promising alternative method for MOF large scale synthesis without additional energy input during the reaction process. ZIF-8, HKUST-1 and UiO-66 have been subsequently realized through the conversion of reaction precursors at room temperature.23,32,33 Recently, Farha's group has reported the room temperature synthesis of a Zr-based MOF, NU-901, by exploiting pre-synthesized Zr6 nodes capped with benzoate ligands.31 For three-dimensional copper-based MOFs, open metal sites are generally generated within their frameworks, which is an effective method to improve CO2 adsorption and separation performance.10 However, only Cu-MOF-74, HKUST-1 and the HKUST-1@GO composite can be prepared by the rapid room temperature synthesis so far.23,34–36 Thus, it is imperative to explore further investigations on the rapid room temperature synthesis to expand the scope of obtaining new copper-based MOF materials for CO2 capture.
Herein, we develop an effective and facile route for the rapid room temperature synthesis of a copper-based MOF under mild conditions, MOF-505. The key to this protocol is the employment of (Zn,Cu) hydroxy double salt [(Zn,Cu)(OH)NO3] as the intermediate that is capable of facile and ultrafast conversion to MOFs reported by Parsons and co-workers.23 Layered [(Zn,Cu)(OH)NO3] is readily converted via the reaction of ZnO with Cu(NO3)2, comprising cationic sheets connected by interlayer anions to form interlamellar compounds.37 In this work, we provide the successful example of MOF-505 by the conversion of [(Zn,Cu)(OH)NO3] into MOF-505 within a short reaction time (less than 30 min) whilst maintaining high quality. By investigating the time-dependent evolution of MOF-505 microstructures, the classical growth pathway of MOF-505 crystallization is confirmed. Benefitting from the excellent anion exchangeability of [(Zn,Cu)(OH)NO3], MOF-505 crystals can be rapidly formed at room temperature and also maintain high quality evaluated by their CO2 adsorption and separation performance.
Experimental section
Materials
Zinc oxide (ZnO, 99%) was supplied by Tianjin Damao Chemicals Co. Ltd. Copper(II) nitrate trihydrate [Cu(NO3)2·3H2O, 99.99%] was obtained from Aladdin. The organic ligand biphenyl-3,3′,5,5′-tetracarboxylic acid (H4bptc, 98%) was purchased from Beijing HWRK Chem Co. Ltd. N,N-Dimethylformamide (DMF, 99.5%), ethanol (EtOH, 99.7%) and acetone (99.5%) were obtained from Guangdong Guanghua Sci-Tech Co. Ltd. All the materials were used as received without further purification.Synthesis of the (Zn,Cu) hydroxy double salt [(Zn,Cu)(OH)NO3] intermediate
The synthesis of [(Zn,Cu)(OH)NO3] was achieved by following a previously reported procedure with slight modifications.23 ZnO powder (0.293 g, 0.36 mmol) was dispersed in deionized water (4 mL) and sonicated for 5 min at ambient temperature to form a nanoslurry. Simultaneously, Cu(NO3)2·3H2O (0.174 g, 0.72 mmol) was dissolved in EtOH (6 mL) and sonicated for 5 min to form a clear solution. Subsequently, the Cu(NO3)2 solution was added into the ZnO nanoslurry under moderate stirring for 5 min. Then the [(Zn,Cu)(OH)NO3] intermediate was recovered by filtration and dried at 65 °C for 1 h.Synthesis of MOF-505 using the [(Zn,Cu)(OH)NO3] intermediate
H4bptc (82.6 mg, 0.25 mmol) dissolved in 6 mL of DMF was added into the turbid solution of the [(Zn,Cu)(OH)NO3] intermediate. After different times of stirring, the MOF-505 products were immediately filtered and washed with 10 mL of acetone. The products were labeled MOF-505-x, where x = 10, 15, 20, 25, and 30 represent the stirring times of 10, 15, 20, 25, and 30 min upon addition of H4bptc. The corresponding MOF-505-x was immersed in 50 ml of acetone, which was replaced three times daily for 2 days, and then filtered and dried in a vacuum oven at 150 °C for 6 h. The yield is about 51% based on the H4bptc ligand.Characterization
The powder X-ray diffraction (PXRD) patterns of the MOF-505 samples were collected using a Bruker D8 Advance X-ray diffractometer with a monochromatized Cu Kα radiation, maintaining an operation voltage and current of 40 kV and 40 mA, respectively. Fourier transform infrared spectroscopy (FTIR) was carried out using a Bruker Vector 70 within the scope of 400–4000 cm−1 to examine the characteristic functional groups. Scanning electron microscopy (SEM) images were recorded using a Hitachi SU-70. A thin Au layer was sputter-coated onto the samples before SEM measurement. Energy dispersive X-ray (EDX) analysis for MOF-505 was performed using the same Hitachi SU-70 equipped with an Oxford energy dispersive X-ray spectrometer to determine the content of Cu and Zn elements on the MOF-505 surfaces. The Cu and Zn element contents of MOF-505 were measured using a plasma mass spectrometer (ICP-Optima 8300). The porosity and textural properties were analyzed via N2 sorption at 77 K using a Micromeritics ASAP 2046 surface area analyzer. Prior to analysis, about 100 mg MOF-505 samples were degassed under vacuum at 150 °C for 6 h. Thermogravimetric measurement was performed using a Netzsch TG 209F3 instrument under flowing N2 gas conditions with a heating rate of 10 °C min−1.Gas sorption measurements
CO2, CH4 and N2 sorption isotherms were determined by a volumetric method using a Micromeritics 3Flex instrument. The measured pressures ranged from 0 to 100 kPa. Gas adsorption data for CO2, CH4 and N2 were collected at 278, 288 and 298 K, using a Julabo water circulator for precise temperature control. Before each gas measurement, 80–100 mg of MOF-505 was degassed under vacuum conditions at 423 K for 6 h. Extra-high purity gases (CO2, CH4 and N2, 99.99%) were used for the adsorption measurements.Results and discussion
Physical characterization
The bulk purity of the MOF-505 samples is determined from the PXRD patterns, as shown in Fig. 1. By comparison, it can be seen that the experimental PXRD patterns for the MOF-505 products obtained from rapid room temperature synthesis match well with the simulated pattern,38 confirming that MOF-505 products can be synthesized by exploiting layered [(Zn,Cu)(OH)NO3] as the intermediate within such short time at room temperature. Meanwhile, the characteristic peaks at 12.7, 25.7 and 33.5° are consistent with prior reports for (Zn,Cu) hydroxy nitrate [(Zn,Cu)(OH)NO3],23,37 indicating that [(Zn,Cu)(OH)NO3] can be rapidly converted. However, these peaks for [(Zn,Cu)(OH)NO3] are not observed in the corresponding patterns of the MOF-505 products. This is because the content of [(Zn,Cu)(OH)NO3] in the resultant MOF-505 products is quite small, as will be discussed later.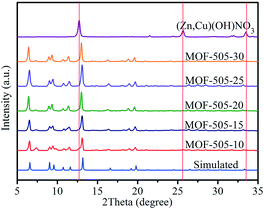 | ||
| Fig. 1 PXRD patterns of the [(Zn,Cu)(OH)NO3] intermediate and MOF-505 synthesized by the rapid room temperature method and simulated MOF-505 pattern. | ||
FTIR spectra were recorded to characterize the corresponding chemical groups of the [(Zn,Cu)(OH)NO3] intermediate and MOF-505 products, as illustrated in Fig. 2. For [(Zn,Cu)(OH)NO3], the broad band around 3546 cm−1 is attributed to O–H stretching vibration.23 The bands at 1420, 1360 and 1047 cm−1 reveal the distinct NO3− group modes.39 The peak at 516 cm−1 is assigned to Cu–O bending vibration while the Zn–O stretching vibration is located at 425 cm−1.40,41 These spectra clearly confirm the formation of (Zn,Cu) hydroxy nitrate via the reaction of ZnO with Cu(NO3)2 to form [(Zn,Cu)(OH)NO3]. Upon subsequent addition of the H4bptc solution over several minutes, these characteristic vibrational bands for O–H, NO3− and Zn–O diminish, which is consistent with the PXRD analysis that [(Zn,Cu)(OH)NO3] is not observed in the resultant MOF-505 products. The asymmetric and symmetric stretching modes of the carboxylate groups (C![[double bond, length as m-dash]](https://www.rsc.org/images/entities/char_e001.gif) O) in the H4bptc appear in the series of MOF-505 products.42 Meanwhile, the Cu–O vibration shifts from 516 to 493 cm−1, indicating a change in the coordination environment of Cu from [(Zn,Cu)(OH)NO3] to MOF-505. This spectrum change explicitly demonstrates the fast anion exchange between OH− and NO3− in the [(Zn,Cu)(OH)NO3] and bptc4−, yielding rapid formation of MOF-505 at room temperature.
O) in the H4bptc appear in the series of MOF-505 products.42 Meanwhile, the Cu–O vibration shifts from 516 to 493 cm−1, indicating a change in the coordination environment of Cu from [(Zn,Cu)(OH)NO3] to MOF-505. This spectrum change explicitly demonstrates the fast anion exchange between OH− and NO3− in the [(Zn,Cu)(OH)NO3] and bptc4−, yielding rapid formation of MOF-505 at room temperature.
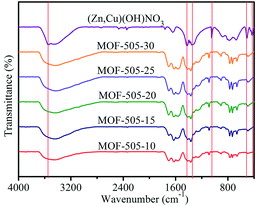 | ||
| Fig. 2 FTIR spectra of the [(Zn,Cu)(OH)NO3] intermediate and MOF-505 synthesized by the rapid room temperature method. | ||
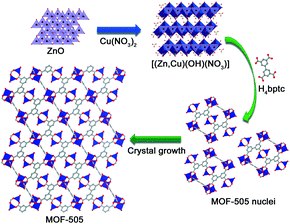
Fig. 3 shows the SEM images of the [(Zn,Cu)(OH)NO3] intermediate and MOF-505 crystals obtained for different reaction times to monitor their morphological evolution. The [(Zn,Cu)(OH)NO3] particles in Fig. 3a show a uniform nanosheet morphology with a thickness of less than 0.1 μm. Meanwhile, the elemental mapping images of [(Zn,Cu)(OH)NO3] nanosheets indicate the homogenous distribution of Zn and Cu (Fig. S2a†). As listed in Table 1, the content of Zn in [(Zn,Cu)(OH)NO3] is 8.97% determined by EDX analysis. Interestingly, different morphologies of the MOF-505 products are clearly observed. For MOF-505-10 in Fig. 3b, only minor crystals with a cubic shape appear after 10 min, in which the classical cubic crystal shape is characteristic of MOF-505, consistent with a previous observation for MOF-505 crystals synthesized by the traditional solvothermal method.43 Meanwhile, mostly two-dimensional sheet fragments are also simultaneously observed, meaning that the small aggregated crystals of MOF-505 grow nuclei. This is due to the fact that no characteristic peaks related to other impurities are observed in these results of the PXRD patterns and FTIR spectra, implying that only the MOF-505 crystalline phase exists throughout the whole formation process. In addition, the content of Zn in MOF-505-10 decreases to 6.04% since the formation of MOF-505 leads to partial release of Zn in [(Zn,Cu)(OH)NO3]. With further increase in reaction time in Fig. 3c–f, the process of MOF-505 crystal growth proceeds by subsequent attachment of small sheet growth units which then evolves into three-dimensional cubic structures. Hence, less two-dimensional sheet fragments are observed while more cubic crystals simultaneously appear as the reaction time prolongs. By analyzing the Zn content in the resultant MOF-505 surfaces, we can observe that the Zn content gradually decreases with further increase in reaction time. For this reason, the formation mechanism of the MOF-505 material by using the [(Zn,Cu)(OH)NO3] intermediate is tentatively proposed in Fig. 4, demonstrating that the MOF-505 crystallization pathway follows the classical growth model proposed by Cölfen and Mann.26,44 As the reaction time increases to 25 min, the content of Zn in MOF-505-25 is lowered to 3.25%; while with further increase in reaction time, the Zn content in MOF-505-30 slightly decreases to 2.79%. There are still minimal amounts of fragments in the MOF-505-25 and MOF-505-30 products in Fig. 3e and f, because small amounts of aggregated [(Zn,Cu)(OH)NO3] sheets still remain in the resultant MOF-505 products since they cannot be dissolved well in acetone, confirmed by the coexistence of the Zn element. Meanwhile, the elemental EDX analysis of Cu and Zn is also complemented by ICP experiments, the results of which are consistent with the results of the EDX analysis, demonstrating the similar trend that the Zn content gradually decreases with further increase in reaction time. Confirming this point, the crystal growth process of MOF-505 can be completed within such short time.
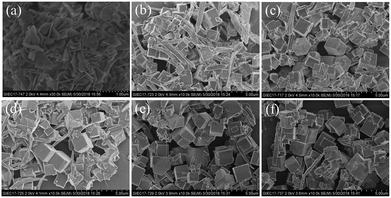 | ||
| Fig. 3 SEM images of (a) the [(Zn,Cu)(OH)NO3] intermediate and MOF-505 products synthesized by the rapid room temperature method for (b) 10 min, (c) 15 min, (d) 20 min, (e) 25 min, and (f) 30 min. | ||
| Sample | Cua [%] | Zna [%] | Zn/Cua [wt] | Zn/Cub [wt] |
|---|---|---|---|---|
| a The ratio of Zn and Cu determined by EDX analysis. b The ratio of Zn and Cu determined by ICP analysis. | ||||
| (Zn,Cu)(OH)NO3 | 91.03 | 8.97 | 9.85% | 7.06% |
| MOF-505-10 | 93.96 | 6.04 | 6.43% | 6.21% |
| MOF-505-15 | 95.47 | 4.53 | 4.74% | 5.83% |
| MOF-505-20 | 95.71 | 4.29 | 4.48% | 5.70% |
| MOF-505-25 | 96.75 | 3.25 | 3.36% | 5.58% |
| MOF-505-30 | 97.21 | 2.79 | 2.87% | 5.36% |
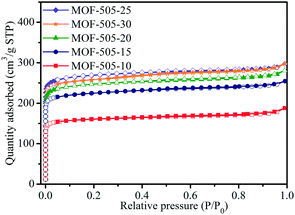
N2 adsorption–desorption isotherms at 77 K were measured to analyze the porous properties of the MOF-505 products. As shown in Fig. 5, all the isotherms of the MOF-505 samples are type I and have a steep increase in the N2 adsorbed amount at a low relative pressure (P/P0 < 0.01), corresponding to materials whose porosity is dominated by micropores. The porosity parameters of the corresponding MOF-505 structure are summarized in Table 2, including the Brunauer–Emmett–Teller (BET) and Langmuir surface areas and the total and microporous pore volumes. As the reaction time increases from 10 min to 25 min, the surface area (such as BET surface area ranging from 646 m2 g−1 to 1076 m2 g−1) and pore volume (such as microporous pore volume ranging from 0.218 cm3 g−1 to 0.365 cm3 g−1) of these MOF-505 samples increase. MOF-505-10 exhibits a remarkably lower surface area and pore volume than the other MOF-505 samples. This is associated with the insufficient crystallization process for 10 min. However, MOF-505-30 shows a slight decrease in surface area and pore volume when the reaction time prolongs to 30 min. This may be attributed to the generation of some defects caused by partial dissolution–recrystallization in the MOF-505 crystals during the prolonged crystallization process, which can be confirmed by the change of pore size. The detailed pore size was analyzed by density functional theory (DFT) to support our speculation. As can be seen from Fig. S3,† the pore sizes of all the MOF-505 samples are mainly distributed in the range of 5 to 9 Å, in which two dominating peaks are centered at 5.9 and 8.0 Å. As expected, an obvious decrease in the pore size to 5.9 Å for MOF-505-30 is observed while some pores with the size of 8.0 Å are slightly increased to 8.6 Å, which is due to the generation of some defects in MOF-505-30 crystals. A similar change in pore size is also observed in the case of PCN-160 that creates crystal defects through removing pro-labile-linker fragments by acid treatment.45
| Sample | S BET (m2 g−1) | S Langmuir (m2 g−1) | V tol (cm3 g−1) | V mic (m3 g−1) |
|---|---|---|---|---|
| MOF-505-10 | 646 | 748 | 0.218 | 0.218 |
| MOF-505-15 | 904 | 1055 | 0.393 | 0.303 |
| MOF-505-20 | 990 | 1147 | 0.434 | 0.332 |
| MOF-505-25 | 1076 | 1231 | 0.460 | 0.365 |
| MOF-505-30 | 1040 | 1227 | 0.459 | 0.353 |
Application of CO2 adsorption and separation for MOF-505
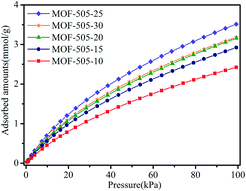
It is well demonstrated that copper-based MOFs with open metal sites are beneficial to CO2 capture because such open metal sites behave as Lewis acidic sites, which can serve as strong binding sites for CO2 molecules and thus form favorable affinity toward CO2 molecules.5,10,46 Hence, MOF-505 is a promising material for CO2 capture, since open metal sites are generated within the MOF-505 framework by removing coordinated guest solvent molecules under vacuum,29,38,43 accompanied with an obvious colour change of the MOF-505 material from light blue to deep blue.47 Accordingly, CO2 isotherms were measured under ambient conditions (at 298 K and 100 kPa) to investigate its CO2 adsorption behavior. As depicted in Fig. 6, MOF-505-25 has the highest CO2 uptake among these MOF-505 materials, reaching 3.51 mmol g−1 at 298 K and 100 kPa. By comparison, the CO2 adsorption capacities of the MOF-505 materials (except MOF-505-10, 2.42 mmol g−1) synthesized by the rapid room temperature method in this work are higher than that of MOF-505 (2.87 mmol g−1) synthesized with the solvothermal method. It can be explained by the lack of ultramicropores (5.9 Å) under solvothermal synthesis conditions.43 It has been established that high CO2 uptake closely depends on the ultramicropores (<0.7 nm) under ambient conditions, in which the smaller pore size in MOFs leads to higher CO2 uptake.48,49 By comparison with the pore size, it can be explained by the fact that the lack of ultramicropores (5.9 Å) for MOF-505 by the solvothermal method leads to lower CO2 uptake. Particularly, it is observed that the CO2 adsorption closely follows the order of the BET surface area. Although the difference in the BET surface areas of MOF-505-25 (1076 m2 g−1) and MOF-505-30 (1040 m2 g−1) is small, the difference in the CO2 uptake values of MOF-505-25 (3.51 mmol g−1) and MOF-505-30 (3.19 mmol g−1) is remarkably higher. This can be explained by the decrease in the pore size to 5.9 Å for MOF-505-30, as described above. Therefore, apart from the presence of open metal sites, the CO2 uptake of the resultant MOF-505 strongly correlates with the pore size. Based on the above results, MOF-505-25 is chosen as the representative material to study its CO2/CH4 and CO2/N2 separation performance in the following section.CO2, CH4 and N2 adsorption experiments were performed to evaluate the adsorption and separation performance of MOF-505-25 at three different temperatures. As shown in Fig. 7a–c, MOF-505-25 exhibits a steep adsorption isotherm for CO2 at any temperature, which is an indication of a strong adsorption affinity toward CO2 due to these open metal sites. At 100 kPa, the CO2 uptake values of MOF-505-25 at 298, 288 and 278 K are 3.51, 4.36 and 5.48 mmol g−1, respectively, which are much higher than the CH4 and N2 uptake values under the same conditions. However, a different adsorption behavior of CH4 and N2 for MOF-505-25 is observed compared with CO2. The trend for CH4 and N2 adsorption is similar and almost linear in the measured pressure range, suggesting a much weaker adsorption affinity toward CH4 and N2 compared with CO2. Thereby, the uptake of MOF-505-25 for CH4 is 1.00 mmol g−1 at 298 K and 100 kPa whereas the N2 uptake is only 0.28 mmol g−1.
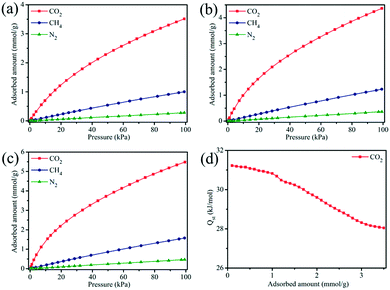 | ||
| Fig. 7 CO2, CH4 and N2 adsorption isotherms of MOF-505-25 at (a) 298 K, (b) 288 K and (c) 278 K. (d) The isosteric heat of adsorption (Qst) of CO2 for MOF-505-25. | ||
For quantitative evaluation of the adsorption affinity between CO2 and the MOF-505 framework, the Clausius–Clapeyron equation was used to calculate the isosteric heat of adsorption (Qst) of CO2. Fig. 7d presents the Qst values of CO2 for MOF-505-25. The Qst shows a declining trend as a function of adsorbed amount, confirming that these adsorption sites for CO2 on the MOF-505-25 surface are heterogeneous.50 The Qst values are located in the range from 28.0 kJ mol−1 to 31.2 kJ mol−1, meaning that the CO2 adsorption behavior of MOF-505-25 is a physical adsorption process, which are comparable to those of previously reported porous adsorbents.51,52 At the initial stage, CO2 molecules preferentially adsorb at the open metal sites due to the strong binding interactions of adsorbing CO2. Limited by the number of open metal sites, only less favorable sites are available as the loading increases. As a result, the gradual decrease in the Qst value reveals this adsorption process. Additionally, the modest Qst value is an advantageous property, indicating that the regeneration can be conducted under mild conditions with less energy penalty.
Adsorption selectivity is an important factor to evaluate the separation performance of an adsorbent material. Therefore, we used ideal adsorbed solution theory (IAST) to calculate the adsorption selectivities for CO2/N2 (0.15![[thin space (1/6-em)]](https://www.rsc.org/images/entities/char_2009.gif) :
:![[thin space (1/6-em)]](https://www.rsc.org/images/entities/char_2009.gif) 0.85) and CO2/CH4 (0.5
0.85) and CO2/CH4 (0.5![[thin space (1/6-em)]](https://www.rsc.org/images/entities/char_2009.gif) :
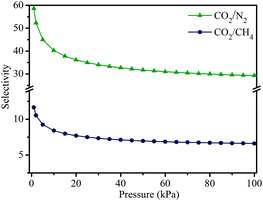
:![[thin space (1/6-em)]](https://www.rsc.org/images/entities/char_2009.gif) 0.5) mixtures. As displayed in Fig. 8, both CO2/N2 and CO2/CH4 adsorption selectivities have a declining trend with the increase in pressure. Particularly, the declining trend is remarkably obvious in the low pressure region, in which the initial adsorption selectivities are determined to be 59 and 12 at 298 K for CO2/N2 and CO2/CH4, respectively. Even when the pressure is increased to 100 kPa, the CO2/N2 and CO2/CH4 selectivities are still high up to 29 and 7. These results indicate that MOF-505-25 exhibits excellent CO2 separation performance, showing a potential material for CO2 capture.
0.5) mixtures. As displayed in Fig. 8, both CO2/N2 and CO2/CH4 adsorption selectivities have a declining trend with the increase in pressure. Particularly, the declining trend is remarkably obvious in the low pressure region, in which the initial adsorption selectivities are determined to be 59 and 12 at 298 K for CO2/N2 and CO2/CH4, respectively. Even when the pressure is increased to 100 kPa, the CO2/N2 and CO2/CH4 selectivities are still high up to 29 and 7. These results indicate that MOF-505-25 exhibits excellent CO2 separation performance, showing a potential material for CO2 capture.
Conclusions
In conclusion, we have provided a facile synthetic route for the rapid room temperature synthesis of MOF-505, in which the key is the exploitation of layered [(Zn,Cu)(OH)NO3] as the intermediate that is capable of fast anion exchange between OH− and NO3− in the [(Zn,Cu)(OH)NO3] and bptc4− and thus induces efficient MOF-505 crystallization. By investigating the effect of reaction time on the MOF-505 microstructure, we confirm the optimized reaction time of 25 min with respect to CO2 uptake. Because of the coexistence of open metal sites and ultramicropores, MOF-505-25 has a moderate CO2 uptake of 3.51 mmol g−1 at 298 K and 100 kPa and high CO2/CH4 and CO2/N2 adsorption selectivities of 29 and 7. Additionally, the CO2 adsorption heat is modest and advantageous for adsorbent regeneration. This facile and rapid room temperature synthetic procedure is promising for MOF large-scale production and acceleration of industrial applications. We believe that this facile synthetic route presented here can be extended to synthesize new MOF and MOF-based composite materials.Conflicts of interest
There are no conflicts to declare.Acknowledgements
This work was supported by the National Natural Science Foundation of China (No. 21576092, 21436005 and 21878101) and the Guangdong Province Science and Technology Project (No. 2017A020216016).Notes and references
- D. J. Tranchemontagne, J. L. Mendoza-Cortes, M. O'Keeffe and O. M. Yaghi, Chem. Soc. Rev., 2009, 38, 1257–1283 RSC.
- C. Zhang, L. Sun, Y. Yan, H. Shi, B. Wang, Z. Liang and J. Li, J. Mater. Chem. C, 2017, 5, 8999–9004 RSC.
- S. Yuan, L. Feng, K. Wang, J. Pang, M. Bosch, C. Lollar, Y. Sun, J. Qin, X. Yang, P. Zhang, Q. Wang, L. Zou, Y. Zhang, L. Zhang, Y. Fang, J. Li and H. C. Zhou, Adv. Mater., 2018, 1704303 CrossRef.
- M. B. Majewski, H. Noh, T. Islamoglu and O. K. Farha, J. Mater. Chem. A, 2018, 6, 7338–7350 RSC.
- X. Zhao, Y. Wang, D. S. Li, X. Bu and P. Feng, Adv. Mater., 2018, 201705189 Search PubMed.
- Y. Chen, J. Xiao, D. Lv, T. Huang, F. Xu, X. Sun, H. Xi, Q. Xia and Z. Li, Chem. Eng. Sci., 2017, 158, 539–544 CrossRef CAS.
- O. M. Yaghi, M. O'Keeffe, N. W. Ockwig, H. K. Chae, M. Eddaoudi and J. Kim, Nature, 2003, 423, 705–714 CrossRef CAS.
- C. Zhang, Y. Liu, L. Sun, H. Shi, C. Shi, Z. Liang and J. Li, Chem. – Eur. J., 2018, 24, 2718–2724 CrossRef CAS PubMed.
- C. Zhang, L. Sun, Y. Yan, Y. Liu, Z. Liang, Y. Liu and J. Li, J. Mater. Chem. C, 2017, 5, 2084–2089 RSC.
- J. Yu, L. H. Xie, J. R. Li, Y. Ma, J. M. Seminario and P. B. Balbuena, Chem. Rev., 2017, 117, 9674–9754 CrossRef CAS.
- Z. Bao, G. Chang, H. Xing, R. Krishna, Q. Ren and B. Chen, Energy Environ. Sci., 2016, 9, 3612–3641 RSC.
- L.-H. Xie, X.-M. Liu, T. He and J.-R. Li, Chem, 2018, 4, 1911–1927 CAS.
- D. Lv, H. Wang, Y. Chen, F. Xu, R. Shi, Z. Liu, X. Wang, S. J. Teat, Q. Xia, Z. Li and J. Li, ACS Appl. Mater. Interfaces, 2018, 10, 6031–6038 CrossRef CAS.
- H. Wang, X. Dong, E. Velasco, D. H. Olson, Y. Han and J. Li, Energy Environ. Sci., 2018, 11, 1226–1231 RSC.
- D. Banerjee, C. M. Simon, S. K. Elsaidi, M. Haranczyk and P. K. Thallapally, Chem, 2018, 4, 466–494 CAS.
- P.-Q. Liao, H. Chen, D.-D. Zhou, S.-Y. Liu, C.-T. He, Z. Rui, H. Ji, J.-P. Zhang and X.-M. Chen, Energy Environ. Sci., 2015, 8, 1011–1016 RSC.
- Z. Lin, Z. Lv, X. Zhou, H. Xiao, J. Wu and Z. Li, Ind. Eng. Chem. Res., 2018, 57, 3765–3772 CrossRef CAS.
- Z. Lu, J. Bai, C. Hang, F. Meng, W. Liu, Y. Pan and X. You, Chem. – Eur. J., 2016, 22, 6277–6285 CrossRef CAS.
- T. M. McDonald, D. M. D'Alessandro, R. Krishna and J. R. Long, Chem. Sci., 2011, 2, 2022–2028 RSC.
- P. Nugent, Y. Belmabkhout, S. D. Burd, A. J. Cairns, R. Luebke, K. Forrest, T. Pham, S. Ma, B. Space, L. Wojtas, M. Eddaoudi and M. J. Zaworotko, Nature, 2013, 495, 80–84 CrossRef CAS.
- S. R. Caskey, A. G. Wong-Foy and A. J. Matzger, J. Am. Chem. Soc., 2008, 130, 10870–10871 CrossRef CAS.
- J. Liu, A. I. Benin, A. M. Furtado, P. Jakubczak, R. R. Willis and M. D. LeVan, Langmuir, 2011, 27, 11451–11456 CrossRef CAS.
- J. Zhao, W. T. Nunn, P. C. Lemaire, Y. Lin, M. D. Dickey, C. J. Oldham, H. J. Walls, G. W. Peterson, M. D. Losego and G. N. Parsons, J. Am. Chem. Soc., 2015, 137, 13756–13759 CrossRef CAS.
- M. Rubio-Martinez, C. Avci-Camur, A. W. Thornton, I. Imaz, D. Maspoch and M. R. Hill, Chem. Soc. Rev., 2017, 46, 3453–3480 RSC.
- P. A. Julien, C. Mottillo and T. Friščić, Green Chem., 2017, 19, 2729–2747 RSC.
- M. J. Van Vleet, T. Weng, X. Li and J. R. Schmidt, Chem. Rev., 2018, 118, 3681–3721 CrossRef CAS.
- U. Mueller, M. Schubert, F. Teich, H. Puetter, K. Schierle-Arndt and J. Pastré, J. Mater. Chem., 2006, 16, 626–636 RSC.
- S. H. Jhung, J. H. Lee, J. W. Yoon, C. Serre, G. Férey and J. S. Chang, Adv. Mater., 2007, 19, 121–124 CrossRef CAS.
- Y. Chen, H. Wu, Z. Liu, X. Sun, Q. Xia and Z. Li, Ind. Eng. Chem. Res., 2018, 57, 703–709 CrossRef CAS.
- L. Garzon-Tovar, S. Rodriguez-Hermida, I. Imaz and D. Maspoch, J. Am. Chem. Soc., 2017, 139, 897–903 CrossRef CAS PubMed.
- H. Noh, C.-W. Kung, T. Islamoglu, A. W. Peters, Y. Liao, P. Li, S. J. Garibay, X. Zhang, M. R. DeStefano, J. T. Hupp and O. K. Farha, Chem. Mater., 2018, 30, 2193–2197 CrossRef CAS.
- R. C. Arbulu, Y.-B. Jiang, E. J. Peterson and Y. Qin, Angew. Chem., Int. Ed., 2018, 57, 5813–5817 CrossRef CAS.
- M. R. DeStefano, T. Islamoglu, S. J. Garibay, J. T. Hupp and O. K. Farha, Chem. Mater., 2017, 29, 1357–1361 CrossRef CAS.
- F. Xu, Y. Yu, J. Yan, Q. Xia, H. Wang, J. Li and Z. Li, Chem. Eng. J., 2016, 303, 231–237 CrossRef CAS.
- J. Yan, Y. Yu, J. Xiao, Y. Li and Z. Li, Ind. Eng. Chem. Res., 2016, 55, 11767–11774 CrossRef CAS.
- M. Meyn, K. Beneke and G. Lagaly, Inorg. Chem., 1993, 32, 1209–1215 CrossRef CAS.
- J. G. Flores, E. Sanchez-Gonzalez, A. Gutierrez-Alejandre, J. Aguilar-Pliego, A. Martinez, T. Jurado-Vazquez, E. Lima, E. Gonzalez-Zamora, M. Diaz-Garcia and M. Sanchez-Sanchez, et al., Greener synthesis of Cu-MOF-74 and its catalytic use for the generation of vanillin, Dalton Trans., 2018, 47, 4639–4645 RSC.
- B. Chen, N. W. Ockwig, A. R. Millward, D. S. Contreras and O. M. Yaghi, Angew. Chem., Int. Ed., 2005, 44, 4745–4749 CrossRef CAS PubMed.
- E. A. Secco and G. G. Worth, Can. J. Chem., 1987, 65, 2504–2508 CrossRef CAS.
- W. Huang, X. Zhou, Q. Xia, J. Peng, H. Wang and Z. Li, Ind. Eng. Chem. Res., 2014, 53, 11176–11184 CrossRef CAS.
- J. Lan, M. Liu, X. Lu, X. Zhang and J. Sun, ACS Sustainable Chem. Eng., 2018, 6, 8727–8735 CrossRef CAS.
- C. Chen, B. Li, L. Zhou, Z. Xia, N. Feng, J. Ding, L. Wang, H. Wan and G. Guan, ACS Appl. Mater. Interfaces, 2017, 9, 23060–23071 CrossRef CAS PubMed.
- Y. Chen, D. Lv, J. Wu, J. Xiao, H. Xi, Q. Xia and Z. Li, Chem. Eng. J., 2017, 308, 1065–1072 CrossRef CAS.
- H. Cölfen and S. Mann, Angew. Chem., Int. Ed., 2003, 42, 2350–2365 CrossRef PubMed.
- S. Yuan, L. Zou, J. S. Qin, J. Li, L. Huang, L. Feng, X. Wang, M. Bosch, A. Alsalme, T. Cagin and H. C. Zhou, Nat. Commun., 2017, 8, 15356 CrossRef CAS PubMed.
- R. Li, W. Zhang and K. Zhou, Adv. Mater., 2018, 1705512 CrossRef PubMed.
- K. Maity, C. K. Karan and K. Biradha, Chem. – Eur. J., 2018, 24, 10988–10993 CrossRef CAS PubMed.
- S. Li, Y. G. Chung, C. M. Simon and R. Q. Snurr, J. Phys. Chem. Lett., 2017, 8, 6135–6141 CrossRef CAS.
- Z. Liu, Z. Zhang, Z. Jia, L. Zhao, T. Zhang, W. Xing, S. Komarneni, F. Subhan and Z. Yan, Chem. Eng. J., 2018, 337, 290–299 CrossRef CAS.
- Y. Chen, H. Wu, D. Lv, N. Yuan, Q. Xia and Z. Li, Sep. Purif. Technol., 2018, 204, 75–80 CrossRef CAS.
- E. J. Wang, Z. Y. Sui, Y. N. Sun, Z. Ma and B. H. Han, Langmuir, 2018, 34, 6358–6366 CrossRef CAS.
- S. Chen, P. Li, S. Xu, X. Pan, Q. Fu and X. Bao, J. Mater. Chem. A, 2018, 6, 1832–1839 RSC.
Footnote |
| † Electronic supplementary information (ESI) available. See DOI: 10.1039/c8ce01489b |
| This journal is © The Royal Society of Chemistry 2019 |

