 Open Access Article
Creative Commons Attribution 3.0 Unported Licence
Finite-temperature Wigner phase-space sampling and temperature effects on the excited-state dynamics of 2-nitronaphthalene†
J. Patrick
Zobel‡
*,
Juan J.
Nogueira§
and
Leticia
González
 *
*
Institute of Theoretical Chemistry, University of Vienna, Währinger Straße 17, A-1090 Vienna, Austria. E-mail: patrick.zobel@univie.ac.at; nogueira.perez.juanjose@univie.ac.at; leticia.gonzalez@univie.ac.at
First published on 20th August 2018
Abstract
The concept of finite temperature Wigner phase-space sampling allowing the population of vibrationally excited states is introduced and employed to study temperature effects on the absorption spectrum of 2-nitronaphtalene (2NN) and its relaxation dynamics. It is found that, despite the fact that the general deactivation mechanism of 2NN after light irradiation does not change with increasing temperature, i.e., after excitation to the singlet manifold, 2NN deactivates via internal conversion in less than 100 fs and then undergoes intersystem crossing to the triplet manifold before decaying to the lowest triplet state in less than 150 fs, the intersystem crossing rate increases at higher temperatures. This increase is attributed to the appearance of a new deactivation pathway, which is not operative at lower temperatures. The present example illustrates that appropriate initial conditions beyond the idealized temperature of 0 K are indispensable to obtain reliable excited state mechanisms, which can be then related to experimental conditions.
1 Introduction
The Wigner function1W is the central quantity in the phase-space formulation of quantum mechanics,2 an alternative to the more commonly known matrix/operator formulation by Heisenberg and Schrödinger or Feynman's path integral formulation. The Wigner function is a representation of the density matrix of the system, and for a quantum system with f degrees of freedom described by the wave function Ψ(q), it reads | (1) |
The Wigner function has the properties
 | (2) |
 | (3) |
 | (4) |
The outcome of a chemical dynamics simulation in general depends strongly on an adequate sampling of initial conditions.8 In practice, it is common to perform Wigner sampling in the harmonic approximation at zero temperature,9,10 where one describes a molecule through a sum of uncoupled harmonic oscillators that are restricted to their vibrational ground state. Certainly, both approximations – the harmonic potentials and the zero-temperature formalism – are simplifications because realistic systems are anharmonic and possess a finite temperature. It is, therefore, interesting to study the effects and limitations of such approximations in chemical dynamics simulations.
Investigating the effects of anharmonic contributions to the potentials is a rather difficult task as it requires knowledge of the exact potential. Finite temperature effects, in contrast, can easily be incorporated into the harmonic approximation by allowing population of the vibrationally excited states – as was done by Mitrić, Bonačic-Koutecký, and co-workers, e.g., in ref. 11–17. Barbatti and co-workers18,19 as well as Du and Lan20 also mentioned the possibility of including temperature in Wigner sampling in dynamics. Given that initial conditions at different temperatures are available, it is possible to perform simulations for each of the initial conditions generated at different temperatures. Alternatively, it is possible to use the so-called importance sampling approach of Kossoski and Barbatti,21 in which dynamics simulations are explicitly run only at one temperature and then the properties of interest are extrapolated to other temperatures by weighting their probability distribution functions. However, despite its low computational cost, the accuracy of importance sampling can be questionable when the investigated properties are strongly temperature dependent or when they present only negligible values or when they are not present at all at the sampled temperature. In such situations, the explicit simulation of the system at different temperatures provides more accurate results.
Introducing finite temperatures into Wigner sampling can be realized in two approaches. In the first – more general – approach, one can write the temperature-dependent Wigner function W(q,p,T) as a sum of (temperature-independent) Wigner functions W[φi](q,p) of the individual vibrational states φi weighted by their temperature-dependent populations Pi, i.e.,
 | (5) |
 | (6) |
![[W with combining tilde]](https://www.rsc.org/images/entities/i_char_0057_0303.gif) (q,p,T) ≥ 0
(q,p,T) ≥ 0![[thin space (1/6-em)]](https://www.rsc.org/images/entities/char_2009.gif)
![[thin space (1/6-em)]](https://www.rsc.org/images/entities/char_2009.gif) ∀
∀ ![[thin space (1/6-em)]](https://www.rsc.org/images/entities/char_2009.gif) (q,p). However, sampling using eqn (6) comes with a loss of information about the vibrational state φn that the system occupies. Although a quantum system can be in a superposition of reference states, this superposition should collapse to a single state once the corresponding property of the system is measured, i.e., once the system is sampled. This information is retained when sampling viaeqn (5) is done instead. The discussion of which advantage is favorable when is, despite interesting, beyond the scope of the present work.
(q,p). However, sampling using eqn (6) comes with a loss of information about the vibrational state φn that the system occupies. Although a quantum system can be in a superposition of reference states, this superposition should collapse to a single state once the corresponding property of the system is measured, i.e., once the system is sampled. This information is retained when sampling viaeqn (5) is done instead. The discussion of which advantage is favorable when is, despite interesting, beyond the scope of the present work.
In this work, we systematically investigate the effects of Wigner sampling at finite temperature on the excited-state dynamics of the organic chromophore 2-nitronaphthalene (2NN). The deactivation mechanism of 2NN has been previously established by us employing nonadiabatic dynamics simulations,23 and it is summarized in Fig. 1. Initially, the system is excited to a 1ππ* state of charge-transfer (CT) character [that we label SCT(ππ*)], from which it mainly undergoes internal conversion with a time constant of τS ∼ 80 fs to a locally excited 1nπ* state [SLE(nπ*)]. Excited-state population is also transferred from the singlet to the excited triplet manifold via intersystem crossing (ISC) with a time constant of τISC ∼ 0.7 ps, before the system finally relaxes to the lowest triplet state T1 with a time constant of τT ∼ 150 fs. The ISC process proceeds via two pathways: a minor fraction (9%) of ISC occurs from the initially excited SCT(ππ*) state to a locally excited 3nπ* state [TLE(nπ*)], while the major fraction (91%) of ISC connects the SLE(nπ*) state to a locally excited 3ππ* state [TLE(ππ*)]. The predominance of the SLE(nπ*) → TLE(ππ*) pathway over the SCT(ππ*) → TLE(nπ*) pathway is explained by three key factors. First, the singlet ISC donor state of the major pathway, SLE(nπ*), is rapidly populated and longer-lived than the other singlet excited states. Second, once the SLE(nπ*) state is populated, the nuclear configurations of 2NN are very close to the configurations that allow ISC and, thus, only small geometrical arrangements are necessary to transfer to the triplet manifold. Third, at the ISC geometries, the SLE(nπ*) and TLE(ππ*) states share very similar electronic distributions and the transition between both states requires only the change of the angular momentum of one electron – allowing the remaining electronic distribution to remain static.
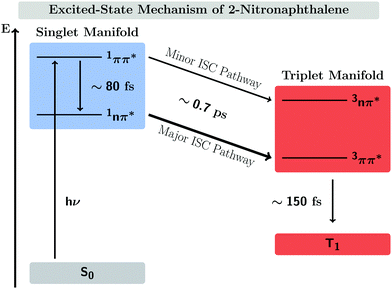 | ||
| Fig. 1 Mechanism of the excited-state dynamics of 2NN at 300 K proposed in ref. 23. | ||
Previous nonadiabatic dynamics simulations23 were started from a Wigner ensemble at T = 300 K. For this work, we have additionally performed nonadiabatic dynamics simulations using Wigner ensembles at T = 0 and T = 500 K. As the following results will demonstrate, temperature has a considerable effect on the excited-state dynamics. This is manifested by an increasing rate of ISC at higher temperatures as well as the opening of an additional ISC pathway at higher temperature that explains the increase of ISC rate.
2 Computational details
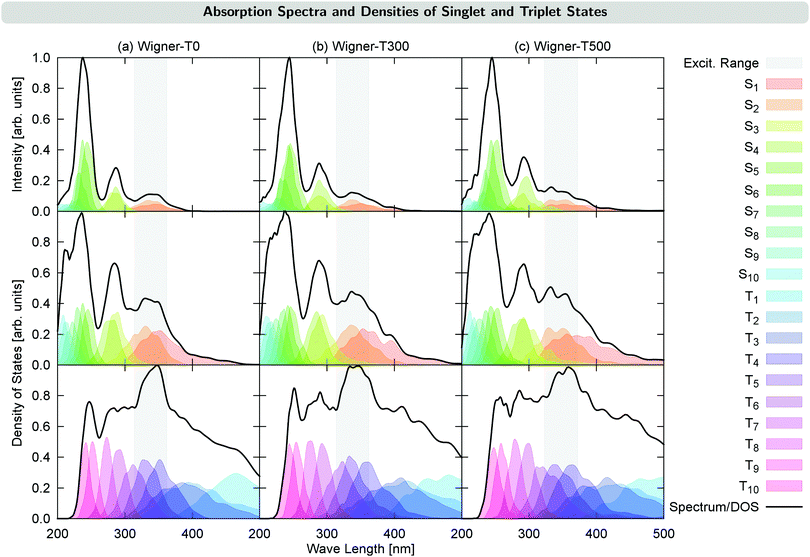
The excited-state dynamics of 2NN was simulated as in ref. 23, using the surface hopping including arbitrary couplings (SHARC) approach24–27 with energies, gradients and couplings calculated with the PBE028,29/DZP30 level of theory from the ADF2016 program package.31 The initial conditions required for the nonadiabatic simulations were obtained from Wigner distributions sampled using eqn (5) described above at T = 0, 300, and 500 K, which we shall denote as WIGNER-TX with X = 0, 300, or 500, respectively. For each of the 1000 geometries per ensemble, the ten lowest excited states were calculated and used to simulate an absorption spectrum by convoluting the resulting stick spectra with the Gaussian function using a full-width at half maximum of 0.1 eV (see Fig. 2).From each WIGNER-TX ensemble, at least 60 geometries were selected stochastically32 and trajectories were propagated for 500 fs using a nuclear time step of 0.5 fs. The trajectories were started at the corresponding bright excited state located within a 0.5 eV energy range around the maximum of the calculated absorption band (gray areas in Fig. 2), resulting in trajectories starting from the S1–S4 states depending on the initial conditions. Based on the excited states found in the excitation energy range and below, different numbers of states were included in the simulations. Due to convergence problems and hops to inactive states during the simulation time, some trajectories were excluded from the analysis. The total number of trajectories, the number of all initial states, the number of excluded trajectories, and the number of states included in the simulation are listed in Table 1 for all three ensembles.
| Ensemble | N tot | N S1 | N S2 | N S3 | N S4 | Singlets | Triplets |
|---|---|---|---|---|---|---|---|
| Wigner-T0 | 75 (2) | 32 (1) | 43 (1) | 0 (0) | 0 (0) | 3 + 2 | 6 + 2 |
| Wigner-T300 | 105 (6) | 51 (2) | 54 (4) | 0 (0) | 0 (0) | 3 + 2 | 6 + 2 |
| Wigner-T500 | 60 (2) | 12 (0) | 36 (2) | 1 (0) | 11 (0) | 5 + 2 | 6 + 2 |
3 Absorption spectra and density of states
Fig. 2 shows the UV-VIS absorption spectra calculated from each of the generated initial conditions, together with the density of states for each ensemble. These densities already reveal a temperature effect, as the excited states spread energetically with increasing temperature. This can be seen, e.g., for the S4 state (middle panel in Fig. 2): its density lies outside of the excitation energy range for T = 0 K, but it reaches inside the excitation energy range for T = 300 K, and reaches even further for T = 500 K. This effect also has the consequence that for the Wigner-T500 ensemble, a number of trajectories were started also from the S3 and S4 states, whereas for all other ensembles, all trajectories were started in either the S1 or S2 state. Notably, while the density of states is broadened for the Wigner ensembles with increasing temperature, the widths of the absorption bands are hardly affected, with the exception of the lowest-energy absorption band, which is broadened at higher temperature. Notably, however, increasing the temperature leads to a red-shift of the higher-energy absorption bands of 0.1–0.2 eV, though the lowest-energy absorption band remains approximately at the same energy. This shift agrees with a previously suggested general red-shift, which is induced by the vibrational motion of the molecule.33 For reference, we have presented a table with energies, oscillator strengths, and characters of the low-lying electronic states at the minimum-energy Franck–Condon (FC) geometry in Section S3 in the ESI.†4 Time evolution of the excited-state populations
The time evolution of the electronic state populations obtained using the three different ensembles as initial conditions for the nonadiabatic dynamics is shown in Fig. 3. The left panels display the populations of the molecular Coulomb Hamiltonian (MCH) states,26i.e., states that are characterized by their spin multiplicity and ordered according to their energy. In this description, the simulations start either on the S1 or on a higher excited singlet state, Sn, with n = 2 for the Wigner-T0/T300 ensembles and n = 2, 3 or 4 for the Wigner-T500 ensemble. As in the Wigner-T300 ensemble,23 population is initially transferred from the Sn state(s) to S1 before ISC takes place to the higher-lying triplet states Tn (n = 2–6) and subsequently decays to the T1 state.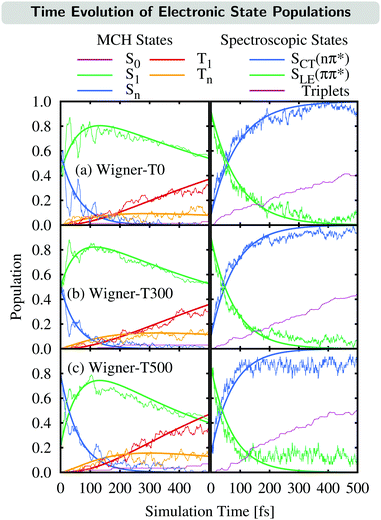 | ||
| Fig. 3 Time evolution of the electronic state populations (left-hand side: MCH states; right-hand side: spectroscopic states) for the different ensembles. Thin lines represent the actual state populations while thick lines represent fits based on the first-order kinetic mechanisms in eqn (7) and (8). The spectroscopic states SLE(nπ*) and SCT(ππ*) were characterized by μ[SLE(nπ*)] < 8 D < μ[SCT(ππ*)], while the population of the triplet states is just the sum of the T1 and Tn populations. | ||
This general mechanism is summarized as
 | (7) |
Alternatively, the dynamics occurring in the singlet manifold can also be described in terms of the so-called spectroscopic states,26i.e., states of a particular electronic character. The corresponding time evolution of the state populations is shown in the right-hand side of Fig. 3. Within the spectroscopic representation, the dynamics in the singlet manifold is best described by
 | (8) |
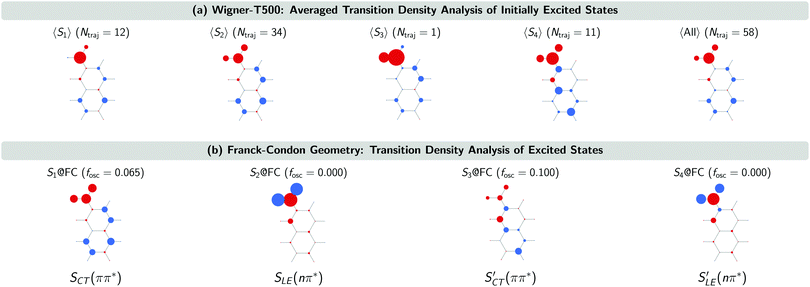
The SCT(ππ*) → SLE(nπ*) internal conversion for the Wigner-T300 ensemble was explained in detail in ref. 23. This process also dominates the beginning of the dynamics simulations of the other ensembles, including the Wigner-T500 ensemble, which involves trajectories starting from states S1 up to S4 and, thus, an additional charge-transfer SCT(ππ*) state. This conclusion is drawn from the analysis of the transition density calculated with the TheoDORE program package34–37 at the initially excited states in the trajectories and at the lowest-excited states at the minimum-energy geometry [FC geometry]. Fig. 4 shows the atomic electron–hole difference populations of the excited states that are present in the transition with respect to the ground state electron distribution.
As can be seen, the 47 trajectories starting from the S1, S2 and S3 states in the Wigner-T500 ensemble exhibit an electron–hole (e/h) difference population that is similar to that of the S1 state at the FC geometry (S1@FC), which is a bright CT 1ππ* state. For the 11 trajectories starting from the S4 state, the e/h difference populations resemble more those of the S3@FC state – especially the atomic hole population. This state is also a bright singlet CT ππ* state [SCT′(ππ*)]. As the electron population at the nitro group in the 〈S4〉 states is larger than in the S3@FC state, this suggests that there is an admixture of S1@FC state character in the 〈S4〉 states. More importantly for our interpretation of the excited-state dynamics results is to realize that all trajectories start in the CT 1ππ* states (S1@FC and S3@FC) and not in the LE 1nπ* states (S2@FC and S4@FC).
5 Temperature effects on intersystem crossing
Having explained the time evolution of the excited-state populations, (Fig. 3) we now proceed to discuss the temperature effects on the dynamics. Table 2 collects the time constants fitted according to the mechanisms proposed in eqn (7) and (8).As stated before, the initial dynamics is governed by a relaxation within the singlet manifold, where, in terms of spectroscopic states, population transfers from the bright SCT(ππ*) state to the SLE(nπ*) state. This reaction occurs for all three ensembles within similar time constants, between 81 ± 10 fs (Wigner-T300) and 95 ± 12 fs (Wigner-T0). Subsequently, the system undergoes ISC to high-lying triplet states Tn, before it relaxes to the T1 state. Also, the time constants τT describing the relaxation dynamics within the triplet manifolds are similar at the different temperatures (τT = 110–150 fs). Thus, the effect of temperature on the relaxation within both the singlet and the triplet manifolds is quite small (within the error margin), and not worth further discussion.
In contrast, the rate of the ISC process from the singlet to the triplet states shows a clear temperature dependence. The rate of the reaction increases notably with the temperature as τISC(T0) ≈ τISC(T300) > τISC(T500). A complete understanding of the reasons behind this temperature dependency of ISC requires an analysis of the electronic structure during the ISC events; as will be shown next, the ISC rate increases at higher temperatures due to an additional ISC pathway that becomes operative at higher temperatures.
Two ISC pathways, which we denoted as major [SLE(nπ*) → TLE(ππ*)] and minor [SCT(ππ*) → TLE(nπ*)], were reported in ref. 23. When characterizing all ISC events only in terms of either of these two pathways, we find in the present work that the relative contribution of the minor channel γminor increases at higher temperatures, from 5% at T = 0 K to 20% at T = 500 K, see Table 3. Table 3 also reports the average spin–orbit couplings (SOCs) at the singlet-to-triplet ISC hopping geometries and we find a considerable increase of the SOCs of the minor pathway when going from the Wigner-T0/Wigner-T300 ensembles (〈SOC〉 = 7.9–8.5 cm−1) to the Wigner-T500 ensemble (〈SOC〉 = 13.8 cm−1). Again, this is due to the additional ISC pathway involving larger SOC, which is a variation of the SCT(ππ*) → SLE(nπ*) minor pathway and becomes effective at higher temperatures (see below). This additional pathway does not exist at T = 0 K or T = 300 K.
| Ensemble | Relative contribution γ [%] | 〈SOC〉 [cm−1] | ||
|---|---|---|---|---|
| Major | Minor | Major | Minor | |
| Wigner-T0 | 95 | 5 | 39.9 | 8.5 |
| Wigner-T300 | 91 | 9 | 39.5 | 7.9 |
| Wigner-T500 | 80 | 20 | 37.8 | 13.8 |
Fig. 5 shows the natural transition orbitals (NTOs) describing the excited states involved in all the three ISC pathways in the moment of the singlet–triplet transitions. The newly identified ISC pathway is labelled as a delocalized excitation (DE) pathway as it is characterized by a transition from an SCT(ρπ*) to a TCT(ρπ*) state. Both singlet and triplet states possess the same π* electron NTO, but differ in their hole NTO that we shall refer to as being of ρ-type, a hybrid between π-type and n-type orbitals. Both states participating in this ISC transition are CT excited states. However, as the direction of CT is the same in both states, the resulting transition ρ → ρ between SCT(ρπ*) and TCT(ρπ*) does not possess any CT character. Instead, as it is delocalized over the whole chromophore, we denote the pathway containing this transition as DE. Similarly, it is possible to re-label the major and minor ISC pathways by the characters of their ISC transitions as LE and CT pathways, respectively. This is because the π → n transition in the major ISC pathway is localized at the nitro group and does not have CT character, while the n → π transition in the minor ISC pathway is of CT character, shifting electron density from the nitro group to the aromatic ring.
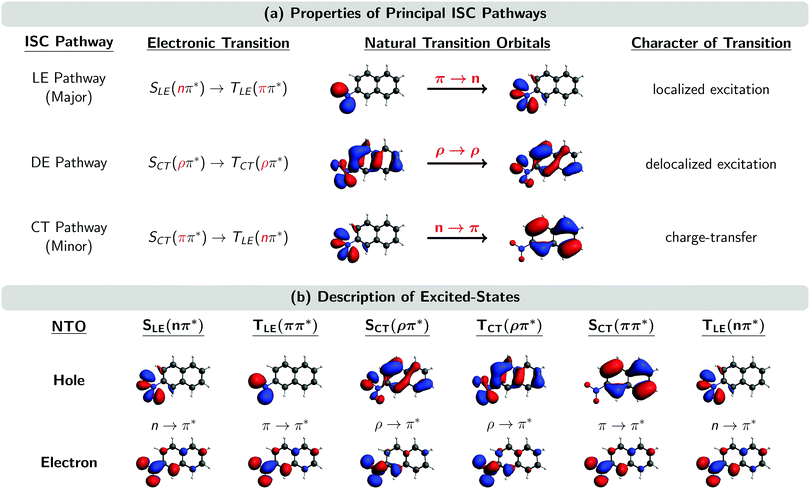 | ||
| Fig. 5 (a) Properties of the three principal ISC pathways. (b) Natural transition orbitals (NTOs) of the excited states involved in the ISC at the ISC hopping geometries. Subscripts LE, DE, and CT denote localized excitation, delocalized excitation, and charge-transfer, respectively. A ρ orbital is a hybrid between an n and a π orbital. “Major” and “minor” labels according to ref. 23. | ||
The ρ NTOs in the DE pathway are a mixture of an n orbital at the nitro group and a π orbital delocalized over the aromatic ring system, similar to the orbitals involved in the CT pathway (Fig. 5). As there is only a small variation of properties between the transitions in the DE and CT pathways – such as the exciton sizes of the participating excited states – it is very difficult to unambiguously assign an ISC hop belonging either to the DE or CT pathway, unless one manually inspects every ISC hopping event, which is an extremely tedious analysis.
Although we did not manually inspect every ISC hopping event, we inspected a small sample of ISC hops, and the analysis suggest that the SOCs between states of the DE pathway are of the order of 10–20 cm−1, i.e., larger than the SOCs of the CT pathway (<10 cm−1) but smaller than the SOCs of the LE pathway (∼40 cm−1). The larger SOCs of the DE pathway explain the larger SOCs reported for the minor pathway of the Wigner-T500 ensemble in Table 3, as the minor pathway includes both the CT and DE pathways in this preliminary analysis. The size of the SOCs in the different pathways seems to be correlated with the amount of charge relocalization that is occurring during the ISC hop. The SOCs are largest for the LE pathway, which requires only a change of the angular momentum of one electron and no further charge migration because both NTOs are located at the nitro group (see Fig. 5). In contrast, the SOCs are smallest for the CT pathway, where both NTOs are localized in different regions of the molecule. This fact was already observed in ref. 23. In the present work, we find SOCs of an intermediate size for the DE pathway, as the NTOs involved are delocalized over the complete molecule but show an important overlap, thus limiting the amount of charge redistribution necessary to connect both states.
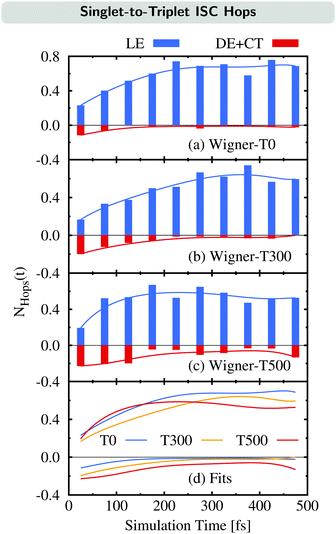
We now examine how the different ISC pathways contribute to the overall ISC rate over time. For this, we plot the time evolution of the average number of ISC hops NHops(t) during time intervals of Δt = 50 fs for trajectories in singlet states where we differentiate between ISC hops of the LE pathway (previously:23 major pathway) and ISC hops of either the DE or CT pathway (previously:23 minor pathway) in Fig. 6. For example, if NHops(t) = 0.2 at t = 25 fs, this means that on average, 20% of all trajectories that are in a singlet state within the time window of 0–50 fs hop to a triplet state in this time window. Note that these trajectories can subsequently hop back to the singlet manifold.
The time evolution of NHops can be used as a measurement of the rate of ISC via either the LE pathway or the combination of the DE and CT pathways. Besides the NHops for the three different ensembles (Fig. 6(a)–(c)), we show the fit functions over time in panel (d).
As can be seen, the number of ISC hops that occur through the LE pathway increases for the first 200–300 fs before it becomes nearly stationary in all three ensembles. This is because the population of the singlet donor state of the LE pathway, the SLE(nπ*) state, is initially zero and gets populated from the initially excited SCT(ππ*) state, and then ISC can occur. In contrast, the majority of ISC hops through either the DE or CT pathway occur at the beginning of the dynamics. It can be noted that these hops are largest for the Wigner-T500 ensemble, both at the beginning as well as throughout the full simulation time, due to the opening of the new DE pathway. This explains the temperature-dependent increase of the ISC rate at higher temperatures as most of the ISC events for the DE + CT pathway occur at short simulation times.
6 Nuclear motion
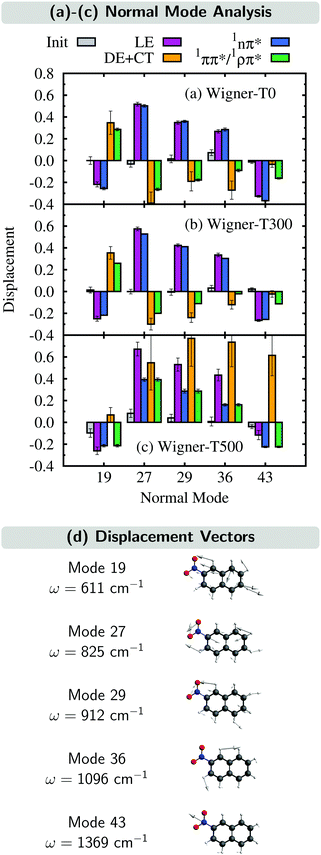
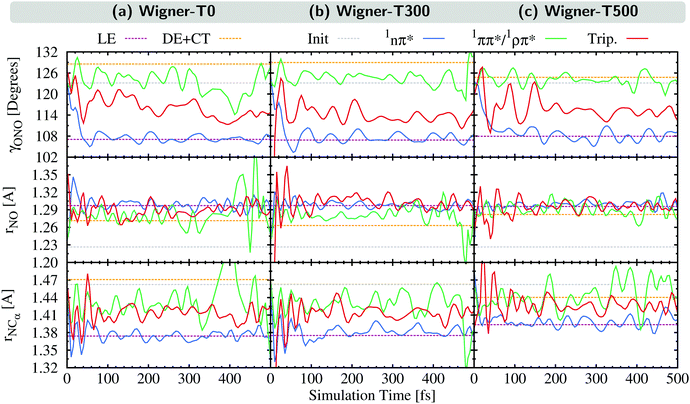
In this section, we analyze the nuclear motion involved in the deactivation dynamics of 2NN using a normal mode analysis, as was done in ref. 23. In terms of internal coordinates, we find that the most important motions affect mainly the angle γONO between the nitro-group atoms, the distances rNO between the nitrogen and oxygen atoms, and the distance rNCα between the nitrogen and its neighboring carbon atom. This was true for the Wigner-T300 ensemble23 and it also applies to the Wigner-T0 and Wigner-T500 ensembles.For all three ensembles, the most active normal modes are displayed in Fig. 7(a)–(c), where we show their displacements with respect to the optimized FC geometry at the initial geometries, at the ISC hopping geometries of the LE (“major”) and the DE + CT (“minor”) pathways, and along the dynamics of the trajectories in the 1nπ* and 1ππ*/1ρπ* states (singlet donor states in the ISC), respectively. Due to the difficulties involved in discriminating between the DE and CT pathways, we combine both sets of ISC geometries, and likewise, only distinguish between two types of singlet states, the 1nπ* state (defined with μ < 8 D) and the 1ππ*/1ρπ* state (defined with μ > 8 D). The corresponding displacement vectors of the normal modes with respect to the FC geometry are presented in Fig. 7(d).
As expected, the average displacements of the initial geometries (gray histograms in Fig. 7(a)–(c)) are small because the initial geometries are still around the FC geometry. In contrast, the displacements of the ISC geometries (violet and orange) indicate the motions required for the system to undergo ISC, and the displacements of the geometries of the trajectories in the singlet states (blue and green) show in which region of the PES the singlet trajectories spend most of the time during the simulation. Note that for an efficient ISC, it is beneficial that the displacement of the singlet states is similar to that of the ISC geometries, meaning that the system spends time in a region of the PES where ISC is possible.
As can be seen, the normal mode analyses of the Wigner-T0 and Wigner-T300 ensembles are very similar, but different from that of the Wigner-T500 ensemble, particularly at the DE + CT pathway (orange) and its donor 1ππ*/1ρπ* state (green). These differences can be best understood following the time evolution of the internal coordinates, γONO, rNO, and rNCα, associated with the most important normal modes, see Fig. 8. This figure also shows the averages of these coordinates at the initial geometries as well as at the ISC hopping geometries of the LE and DE–CT pathways. As can be seen, the average of the latter DE + CT pathway (orange dashed line) varies substantially with temperature. For example, the γONO angle for the DE + CT pathway is 128.5° (129.0°) at T = 0 K (300 K) but 124.7° at T = 500 K. Such a smaller γONO angle is then more often accessed by the trajectories in the 1ππ* state (green solid line), which are thus more frequently in regions where they can undergo ISC via the DE pathway. This situation is also true for the average rNO and rNCα of the DE + CT pathway at T = 500 K, so that they best overlap with the oscillations of the 1ππ*/1ρπ* trajectories.
In contrast to the average internal coordinates for the DE + CT pathway, the average internal coordinates of the LE pathway vary less with temperature. This is expected as the electronic states involved in the LE pathway are the same at all temperatures, and, thus, ISC takes place in the same regions of the PES. Only rNCα (violet line) increases notably when going from T = 300 K (1.37 Å) to T = 500 K (1.39 Å). However, accompanying this increase, we find that the oscillations of rNCα of the 1nπ* trajectories also increase, thus, probably cancelling any effect that the increase could have on the LE pathway.
Thus, the better overlap of the coordinates of the 1ππ* trajectories with those of the ISC hopping geometries of the DE + CT pathway at higher temperature contributes to the temperature-dependent increase of the ISC rate (see Section 5). Due to the increased energy at T = 500 K, the trajectories in the 1ππ* state are able to visit different regions of the PES where ISC is more accessible than when having less energy. This feature – in addition to the larger spin–orbit couplings due to the DE part of the DE + CT pathway – is responsible for the increase of the ISC rate at higher temperatures.
7 Conclusions
The present work explores the concept of finite-temperature Wigner phase-space sampling and investigates the effects that finite temperature can have on excited-state dynamics simulations. In Wigner sampling, a finite temperature is realized by allowing the population of vibrationally excited states, thereby increasing the vibrational energy by a thermal-energy contribution. Such populations also result in probability distributions of coordinates and momenta that are different from the vibrational ground-state distributions from a hypothetical zero-temperature case. The larger the phase space sampled and the more additional thermal energy available within the finite temperature Wigner sampling, the larger the impact on the excited-state dynamics of certain systems. Despite the trivial nature of this statement, finite temperature effects are rarely taken into account. Therefore, here, we have investigated temperature effects (T = 0, 300 and 500 K) on the absorption spectrum and the excited-state dynamics of the organic chromophore 2NN upon excitation to the lowest-energy absorption band, finding noticeable changes.In the absorption spectrum of 2NN, increasing the temperature leads to a broadening of the absorption bands. As a consequence, the individual excited states expand over a larger range of energy at T = 500 K, so that setting-up the excited state dynamics requires trajectories starting from a larger number of states than at T = 0 K and T = 300 K, despite using the same excitation-energy range.
The general excited-state decay mechanism of 2NN is found to be the same, regardless of the temperature, i.e., after initial relaxation dynamics in the singlet manifold on a ∼100 fs time scale, the system undergoes a sub-ps ISC to higher-lying triplet states before decaying to the lowest T1 state. However, the rate of ISC from the singlet to triplet states increases at higher temperature, especially when going from T = 300 K to T = 500 K. We attributed this increase to the presence of a new ISC channel that involves delocalized singlet-to-triplet transitions. This channel becomes operational only at high temperature, in addition to the two other previously identified pathways involving locally excited and charge transfer transitions.
Clearly, finite temperature Wigner sampling is a simple and straightforward extension of the zero-temperature formalism that yields an improved and more realistic phase-space sampling. As demonstrated here, the effects of the sampling size of the phase space and the energy available can have a non-negligible impact on excited-state dynamics simulations and should be taken into account. Thus, this procedure is well suited to become the new standard to generate vibrational ensembles for the calculation of absorption spectra or to generate initial conditions for excited-state dynamics when anharmonic effects are negligible.
Conflicts of interest
There are no conflicts to declare.Acknowledgements
The authors are grateful to R. Mitrić for sharing ref. 22. JPZ is a recipient of a DOC Fellowship of the Austrian Academy of Sciences at the Institute of Theoretical Chemistry at the University of Vienna. JJN and LG thank the University of Vienna. The computational results presented have been partially achieved using the Vienna Scientific Cluster.Notes and references
- E. Wigner, Phys. Rev., 1932, 40, 749–759 CrossRef CAS.
- T. L. Curtright, D. B. Fairlie and C. K. Zachos, A Concise Treatise on Quantum Mechanics in Phase Space, World Scientific Publishing Co. Pte. Ltd., 2014 Search PubMed.
- L. Sun and W. L. Hase, J. Chem. Phys., 2010, 133, 044313 CrossRef.
- M. Hartmann, J. Pittner, V. Bonačić-Koutecký, A. Heidenreich and J. Jortner, J. Chem. Phys., 1998, 108, 3096–3113 CrossRef CAS.
- R. P. Feynman, Int. J. Theor. Phys., 1982, 21, 467–488 CrossRef.
- R. P. Feynman, in Quantum Implications: Essays in Honour of David Bohm, ed. B. J. Hiley and F. D. Peat, Routledge & Kegan Paul Ltd, 1987, ch. 13 Search PubMed.
- D. Leibfried, T. Pfau and C. Monroe, Phys. Today, 1998, 51, 22–28 CrossRef.
- M. Barbatti and K. Sen, Int. J. Quantum Chem., 2016, 116, 762–771 CrossRef CAS.
- A. J. Atkins and L. González, J. Phys. Chem. Lett., 2017, 8, 3840–3845 CrossRef CAS.
- S. Mai, F. Plasser, M. Pabst, F. Neese, A. Köhn and L. González, J. Chem. Phys., 2017, 147, 184109 CrossRef.
- R. Mitrić, M. Hartmann, J. Pittner and V. Bonačić-Koutecký, J. Phys. Chem. A, 2002, 106, 10477–10481 CrossRef.
- V. Bonačić-Koutecký and R. Mitrić, Chem. Rev., 2005, 105, 11–65 CrossRef PubMed.
- V. Bonačić-Koutecký, R. Mitrić, U. Werner, L. Wöste and R. S. Berry, Proc. Natl. Acad. Sci. U. S. A., 2006, 103, 10594–10599 CrossRef PubMed.
- R. Mitrić and J. Petersen, Phys. Chem. Chem. Phys., 2012, 14, 8299–8306 RSC.
- J. Giegerich, J. Petersen, R. Mitrić and I. Fischer, Phys. Chem. Chem. Phys., 2014, 16, 6294–6302 RSC.
- P. G. Lisinetskaya, C. Braun, S. Proch, Y. D. Kim, G. Ganteför and R. Mitrić, Phys. Chem. Chem. Phys., 2016, 18, 6411–6419 RSC.
- M. I. S. Röhr, R. Mitrić and J. Petersen, Phys. Chem. Chem. Phys., 2016, 18, 8701–8709 RSC.
- M. Barbatti, A. J. A. Aquino and H. Lischka, Phys. Chem. Chem. Phys., 2010, 12, 4959–4967 RSC.
- R. Crespo-Otero and M. Barbatti, Theor. Chem. Acc., 2012, 131, 1237 Search PubMed.
- L. Du and Z. Lan, J. Chem. Theory Comput., 2015, 11, 1360–1374 CrossRef CAS.
- F. Kossoski and M. Barbatti, J. Chem. Theory Comput., 2018, 6, 3173–3183 CrossRef.
- M. Hillery, R. F. O'Connell, M. O. Scully and E. P. Wigner, Phys. Rep., 1984, 106, 121–167 CrossRef.
- J. P. Zobel, J. J. Nogueira and L. González, Chem. – Eur. J., 2018, 24, 5379–5387 CrossRef CAS.
- S. Mai, M. Richter, M. Ruckenbauer, M. Oppel, P. Marquetand and L. González, SHARC: Surface Hopping Including Arbitrary Couplings – Program Package for Non-Adiabatic Dynamics, http://sharc-md.org, 2014 Search PubMed.
- M. Richter, P. Marquetand, J. González-Vázquez, I. Sola and L. González, J. Chem. Theory Comput., 2011, 7, 1253–1258 CrossRef CAS.
- S. Mai, P. Marquetand and L. González, Int. J. Quantum Chem., 2015, 115, 1215–1231 CrossRef CAS.
- S. Mai, P. Marquetand and L. González, WIREs Comput. Mol. Sci., 2018 DOI:10.1002/wcms.1370.
- C. Adamo and V. Barone, J. Chem. Phys., 1999, 110, 6158–6170 CrossRef CAS.
- M. Ernzerhof and G. E. Scuseria, J. Chem. Phys., 1999, 110, 5029–5036 CrossRef CAS.
- D. P. Chong, E. van Lenthe, S. van Gisbergen and E. J. Bearends, J. Comput. Chem., 2004, 25, 1030–1036 CrossRef CAS.
- E. J. Baerends, T. Ziegler, A. J. Atkins, J. Autschbach, D. Bashford, A. Bérces, F. M. Bickelhaupt, C. Bo, P. M. Boerrigter, L. Cavallo, D. P. Chong, D. V. Chulhai, L. Deng, R. M. Dickson, J. M. Dieterich, D. E. Ellis, M. van Faassen, L. Fan, T. H. Fischer, C. Fonseca Guerra, M. Franchini, A. Ghysels, A. Giammona, S. J. A. van Gisbergen, A. W. Götz, J. A. Groeneveld, O. V. Gritsenko, M. Grüning, M. S. Gusarov, F. Harris, P. van den Hoek, C. Jacob, H. Jacobsen, L. Jensen, J. W. Kaminski, G. van Kessel, F. Kootstra, A. Kovalenko, M. V. Krykunov, E. van Lenthe, D. A. McCormack, A. Michalak, M. Mitoraj, S. M. Morton, J. Neugebauer, V. P. Nicu, L. Noodleman, V. P. Osinga, S. Patchkovskii, M. Pavanello, C. A. Peeples, P. H. T. Philipsen, D. Post, C. C. Pye, W. Ravenek, J. I. Rodríguez, P. Ros, R. Rüger, P. R. T. Schipper, H. van Schoot, G. Schreckenbach, J. S. Seldenthuis, M. Seth, J. G. Snijders, M. Solà, M. Swart, D. Swerhone, G. te Velde, P. Vernooijs, L. Versluis, L. Visscher, O. Visser, F. Wang, T. A. Wesolowski, E. M. van Wezenbeek, G. Wiesenekker, S. K. Wolff, T. K. Woo and A. L. Yakovlev, ADF2016, SCM, Theoretical Chemistry, Vrije Universiteit, Amsterdam, The Netherlands, 2016, http://www.scm.com Search PubMed.
- M. Barbatti, G. Grannuci, M. Persico, M. Ruckenbauer, M. Vazdar, M. Eckert-Maksić and H. Lischka, J. Photochem. Photobiol., A, 2007, 190, 228–240 CrossRef CAS.
- J. J. Nogueira and L. González, Annu. Rev. Phys. Chem., 2018, 69, 473–497 CrossRef CAS.
- F. Plasser and H. Lischka, J. Chem. Theory Comput., 2012, 8, 2777–2789 CrossRef CAS PubMed.
- F. Plasser, M. Wormit and A. Dreuw, J. Chem. Phys., 2014, 141, 024106 CrossRef PubMed.
- S. A. Mewes, J.-M. Mewes, A. Dreuw and F. Plasser, Phys. Chem. Chem. Phys., 2016, 18, 2548–2563 RSC.
- F. Plasser, TheoDORE 1.4: a package for theoretical density, orbital relaxation, and exciton analysis, available fromhttp://theodore-qc.sourceforge.net.
- S. Nangia, A. W. Jasper, T. F. Miller III and D. G. Truhlar, J. Chem. Phys., 2004, 120, 3586–3597 CrossRef CAS.
Footnotes |
| † Electronic supplementary information (ESI) available. See DOI: 10.1039/c8cp03273d |
| ‡ Present address: Kemicentrum, Lund University, P.O. Box 124, SE-221 00 Lund, Sweden. |
| § Present address: Research School of Biology, Australian National University, Canberra ACT 2601, Australia. |
| This journal is © the Owner Societies 2019 |

