Depletion of VOC in wastewater by vacuum membrane distillation using a dual-layer membrane: mechanism of mass transfer and selectivity†
Jianhua
Zhang
 *a,
Na
Li
b,
Derrick
Ng
c,
Ikechukwu A.
Ike
a,
Zongli
Xie
 c and
Stephen
Gray
*a
aVictoria University, Institute for Sustainability and Innovation, Werribee Campus, PO BOX 14428, Melbourne, Vic 8001, Australia. E-mail: jianhua.zhang@vu.edu.au; stephen.gray@vu.edu.au
bSchool of Chemical Engineering and Technology, Xi'an Jiaotong University, Xi'an, Shaanxi 710049, P.R. China
cCSIRO Manufacturing, Private bag 10, Clayton South, Vic 3169, Australia
First published on 15th November 2018
Abstract
In this paper, volatile organic compound (VOC) removal by vacuum membrane distillation with a dual-layer membrane was studied. The mass transfer mechanism and VOC selectivity of the dual-layer membrane for VOC removal were compared with that of the PTFE membrane, for which the separation relied on the liquid–vapour equilibrium of VOCs in water. The VOC mass transfer across the dual-layer membrane could not be completely described by Raoult's law, which is applicable for the performance of the PTFE membrane. The maximum VOC selectivity of the dual-layer membrane was about 4.6 times that of the PTFE membrane. It is proposed that the increase of organic selectivity is related to the reduced water content in the hydrophilic polyurethane layer, in which organic adsorption decreased the hydrophilicity of the pores. The VOC selectivity of the dual-layer membrane declined as the vacuum pressure and/or temperature increased due to the linear/exponential increase of water flux and almost constant organic flux. The dual layer hydrophilic–hydrophobic membrane swelled slightly when in contact with the synthetic organic solution during the membrane distillation (MD) process but showed good resistance to wetting, which is an important feature for practical application of the membrane for treatment of wastewater containing volatile organic compounds.
Water impactThis paper studied the performance of a dual-layer membrane in treating synthetic water simulating the composition of high VOC industrial wastewater. The VOC selectivity of the dual layer membrane was studied and compared with that of the non-selective PTFE membrane, based on its structure and material of the coating layer. |
1. Introduction
Volatile organic compounds (VOCs) are organic chemicals that have a high vapour pressure at ordinary room temperature, and exist in solvent thinners, degreasers, cleaners, lubricants, and liquid fuels. These compounds can cause an increase in chemical oxygen demand (COD) of industrial wastewaters.1 However, perhaps the greatest concern for VOC emissions is the transport of VOCs from wastewater to air.1 In the U.S. Title III of the 1990 Clean Air Act Amendments (CAAA), government owned treatment facilities were required to make an inventory of their hazardous air pollutant (HAP) emissions. Most of the HAPs were identified as VOCs, and regulated by the US EPA in discharge to surface water.2,3Membrane distillation (MD) is a membrane-based separation process that uses a hydrophobic membrane to isolate the feed and permeate. Depending on the operation mode to decrease the vapor pressure on the permeate side of the membrane,4,5 MD is classified into four major configurations: direct contact membrane distillation (DCMD), air gap membrane distillation (AGMD), sweeping gas membrane distillation (SGMD), and vacuum membrane distillation (VMD). SGMD and VMD are common configurations considered for VOC removal from aqueous solution.6–12 However, VOCs are good wetting agents for hydrophobic membranes and, therefore, challenge the use of conventional hydrophobic membranes for MD. In addition, membrane wetting is a particularly important challenge for VMD because the pressure difference between the liquid and membrane pores may be about 100 kPa, which challenges the liquid entry pressure of common membranes used for MD. Hence, wetting abatement is necessary for successful application of VMD in the removal of VOC from aqueous solutions. Another practical challenge in the use of VMD for VOC removal is that VMD can only strip VOCs from aqueous solution based on the relative volatility of the organic compounds which is described by Raoult's law, as shown in eqn (1).13
Therefore, employing a porous hydrophobic membrane for VOC removal by MD will not show a performance better than distillation, and would have a high wetting risk that compromises separation efficiency.
 | (1) |
Dual and/or multi-layer hydrophilic–hydrophobic–hydrophilic membranes were introduced for MD in 1982,14 and were employed for MD flux enhancement and long-term stable operation in the desalination process when the hydrophilic layer was facing the permeate stream.15,16 However, as we are concerned with reducing potential wetting effects from VOCs, only the configuration with the hydrophilic layer facing the feed is considered. Theoretically, the hydrophilic layer has affinity for the hydrophilic end of an amphiphilic molecule,17 and will leave the other hydrophobic end exposed to the aqueous solution. This action will theoretically convert the hydrophilic pores into partial hydrophobic pores, which will reduce the chance of water molecules accessing the second hydrophobic layer and increase the organic concentration in the hydrophilic layer.
Although there have been many studies that considered dual-layer membranes for anti-wetting operation and flux enhancement, as far as the authors are aware, there is a lack of research on the selectivity of the dual-layer membranes for VOC removal.
In this paper, a commercially available PU coated PTFE dual-layer membrane was selected, which had demonstrated anti-wettability in previous work on surfactant laden wastewater.18 The aim of this research is to identify the potential of the PU coated PTFE membrane for treatment of VOC containing industrial wastewater streams (million litres per day). A synthetic feed that simulated the VOC composition of real wastewater was used in experiments with membranes that are commercial available, so that the beneficial outcomes could be technically implemented industrially. For comparison purposes a PTFE membrane was also selected, which had demonstrated high hydrophobicity, high flux19 and similar structure to the PTFE layer in the dual-layer membrane and to other commercially available PTFE membranes.
2. Experimental
2.1 Membrane characterisation
The pore size of the PU coating layer of the M2 membrane was measured by nitrogen adsorption with analysis using the Brunauer–Emmett–Teller (BET) model (Micromeritics TriStar Surface Area and Porosity Analyser, GA, USA). Prior to analysis, the sample was degassed at 60 °C for 24 h.
2.2 VMD testing and theory
Before the synthetic feed test, deionised water was used as the feed to test the baseline flux of each type of membrane under the same conditions. The synthetic feed contained 1 wt% sodium chloride and 2.2 wt% VOCs composed of dimethoxymethane, formaldehyde and methanol at a mass ratio of 10![[thin space (1/6-em)]](https://www.rsc.org/images/entities/char_2009.gif) :
:![[thin space (1/6-em)]](https://www.rsc.org/images/entities/char_2009.gif) 2
2![[thin space (1/6-em)]](https://www.rsc.org/images/entities/char_2009.gif) :
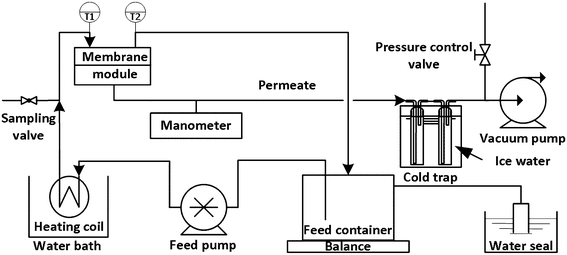
:![[thin space (1/6-em)]](https://www.rsc.org/images/entities/char_2009.gif) 1, based on an industrial wastewater composition. To minimise evaporative losses of VOCs, the feed was circulated in an air tight closed loop with a water seal, and the overall mass loss was only from the vapour transfer across the membrane. The feed was sampled every 1 h through a sampling valve, and the membrane flux was calculated based on the feed loss (weight loss of the feed tank) that was logged using a balance and a computer. The feed inlet and outlet temperatures were logged using a thermocouple data logger (PICO, TC-08, UK), and the pressure on the permeate side was monitored using a manometer (TPI-665, USA). Membrane wetting was checked after each experiment by measuring the conductivity of the permeate in the first cold trap. For each type of membrane, three pieces of membrane were used to check the repeatability of the experiments. Each experiment presented in this paper lasted at least 4 h.
1, based on an industrial wastewater composition. To minimise evaporative losses of VOCs, the feed was circulated in an air tight closed loop with a water seal, and the overall mass loss was only from the vapour transfer across the membrane. The feed was sampled every 1 h through a sampling valve, and the membrane flux was calculated based on the feed loss (weight loss of the feed tank) that was logged using a balance and a computer. The feed inlet and outlet temperatures were logged using a thermocouple data logger (PICO, TC-08, UK), and the pressure on the permeate side was monitored using a manometer (TPI-665, USA). Membrane wetting was checked after each experiment by measuring the conductivity of the permeate in the first cold trap. For each type of membrane, three pieces of membrane were used to check the repeatability of the experiments. Each experiment presented in this paper lasted at least 4 h.
The total VOC concentration in the feed was determined by measuring the total organic carbon (TOC, Shimadzu, TOC V with TNM-1 unit, Japan).
 | (2) |
 | (3) |
| ΔP = yi·Ptotal − xiPi0 | (4) |
VOC removal from the feed can be expressed as the depletion ratio as shown in eqn (5).
 | (5) |
The feed recovery was calculated by eqn (6).
 | (6) |
The water flux of the membrane was calculated by eqn (7).
 | (7) |
Here, A is the area of the membrane and t is the time.
Since the organic flux varied with VOC concentration (organic vapour pressure, eqn (3)) at different feed recovery, the normalized organic flux calculated by eqn (8) was used in this study.
 | (8) |
Because water is the main component (>96 wt%), the flux change with time due to its molar ratio variation can be ignored. Therefore, the selectivity of the VOC by the membrane is defined here as,
 | (9) |
3. Results and discussion
3.1 Membrane characterisation
Table 1 lists the contact angles of both membranes with deionised water and synthetic feed. It can be seen that the contact angles of both membranes declined due to the reduced surface tension of the feed solution by the added organics. However, the influence of the feed showed greater influence on the contact angle of the dual layer membrane than that of the PTFE membrane, due to the higher organic affinity of PU than that of PTFE.| Membrane type | Contact angle (°) | |
|---|---|---|
| Water | Synthetic feed | |
| M1 | 139 ± 2 | 134 ± 2 |
| M2 | 59 ± 2 | 51 ± 2 |
The SEM images of both membranes are shown in Fig. 2. The surface of the PTFE membrane (M1) was porous and had a network structure composed of knots and fibrils (Fig. 2-a1), but the PU layer of the dual-layer membrane (M2) was dense and rough with many protruding lumps (Fig. 2-b1). The cross section images of both membranes are shown in Fig. 2-a2 and b2. It was noted that delamination of the dual layer membrane occurred during sample preparation. M1 has a PTFE thickness of approximately 70 μm, which is about 2.4 times the overall dual layer thickness (29 μm, PU layer + PTFE layer) of the M2 membrane (excluding the textile support), and about 4 times the thickness of the M2 PTFE layer (18 μm) sandwiched between the PU coating layer and the textile support layer. Therefore, the vapour mass transfer resistance due to the PTFE membrane thickness of the M2 membrane was only 1/4 that of the M1 membrane22 (resistance proportional to thickness), assuming that only liquid water passed through the PU layer.
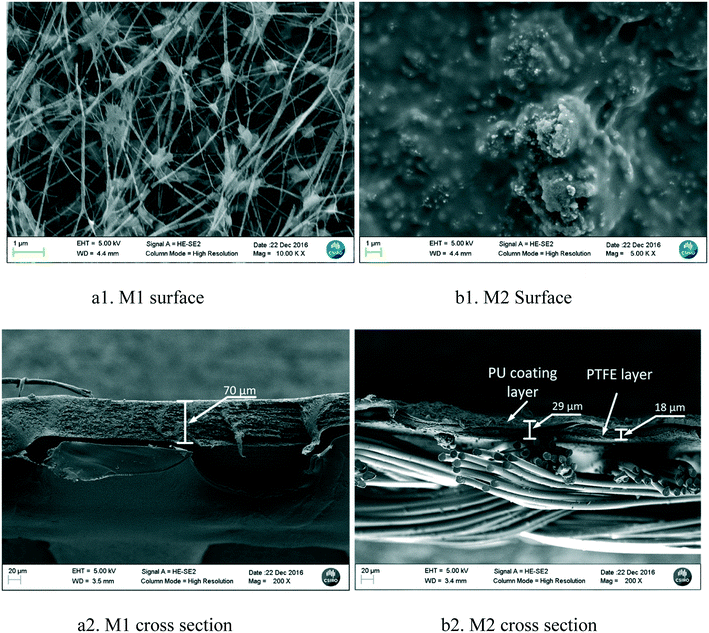 | ||
| Fig. 2 Surface and cross section morphology of the PTFE membrane (M1) and dual-layer hydrophilic and hydrophobic membrane (M2). | ||
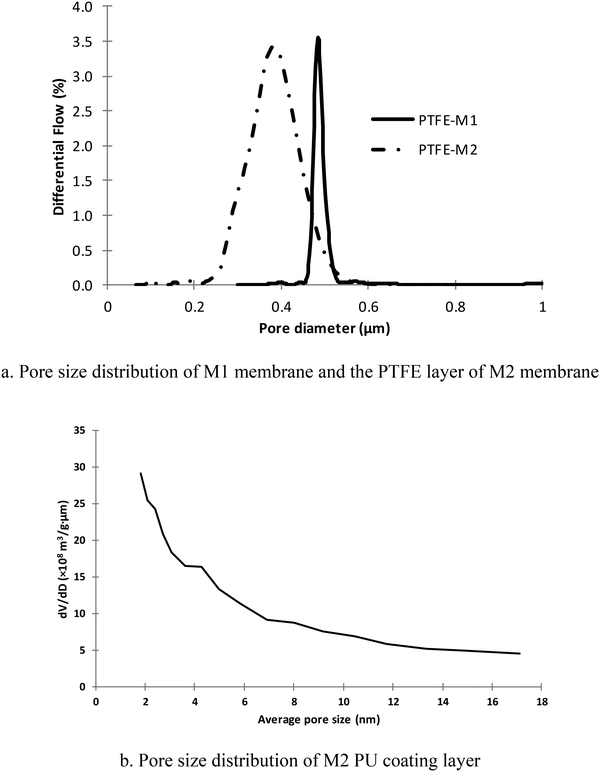
Fig. 3a shows the pore size distributions of the M1 membrane and PTFE layer of the M2 membrane. It can be seen that the PTFE layer of the M2 membrane had relatively smaller mean pore size (Table 2), but wider pore size distribution than that of the M1 membrane. Assuming that the flux has a square relationship to the membrane pore size,23 the vapour mass transfer resistance due to membrane pore size of M2 is about 1.8 times that of M1. Therefore, the estimated ratio of the mass transfer resistance of M1 to the M2 PTFE layer based on eqn (10)19 and the relative pore size and thickness measurements was about 2.2 times, assuming that the PTFE layers had similar porosity and tortuosity.24–26
 | (10) |
| Membrane | Maximum pore size (μm) | Mean flow pore size (μm) | Minimum pore size (μm) | Bubble point pressure (bar) |
|---|---|---|---|---|
| M1 | 0.57 | 0.48 | 0.30 | 1.12 |
| M2 – PTFE | 0.45 | 0.36 | 0.11 | 1.41 |
Due to its smaller size being below the detection limit of the Porometer employed, the pore size distribution of the PU layer of the M2 membrane was measured by BET. As shown in Fig. 3b, the pore size of the PU layer was largely less than 10 nm and the peak appeared at approximately 2 nm, where BET measurements were unable to detect pores less than this.
The solution uptake results are listed in Table 3. It can be seen that the PU layer absorbed less feed than deionised water. This test demonstrated that the existing amphiphilic organic molecule has partially converted the pores from hydrophilic to hydrophobic, which reduced the water content in the PU layer.
| Test | Test1 (g m−2) | Test2 (g m−2) | Average (g m−2) |
|---|---|---|---|
| Deionised water | 26.1 | 21.5 | 23.8 |
| Synthetic feed | 18.5 | 17.4 | 18.0 |
3.2 VMD testing
 | (11) |
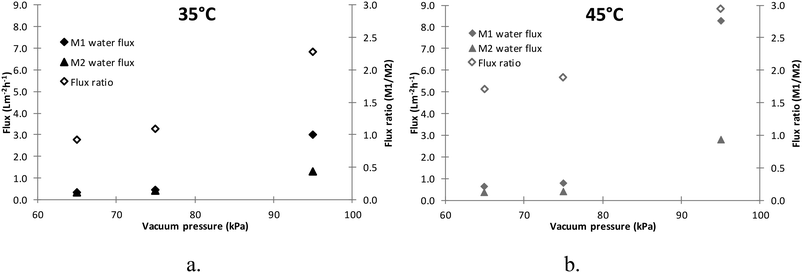 | ||
| Fig. 4 Deionised water flux of M1 and M2 at different vacuum pressures and temperatures (flowrate = 30 mL min−1, error = ±5). a. Flux at 35 °C. b. Flux at 45 °C. | ||
Here, ΔPPU is the hydraulic pressure difference across the PU layer, RPU is the mass transfer resistance of the PU layer, ΔPPTFE is the vapour pressure difference across the PTFE layer, Pfeed is the absolute hydraulic pressure of the feed, Ppermeate,PU is the absolute total pressure on the permeate side of the PU layer, the Pvap,PU is the vapour pressure on the permeate side of the PU layer, Pvap,PTFE is the vapour pressure on the permeate side of the PTFE layer, and the RPTFE is the mass transfer resistance of the PTFE layer. Since the gas phase on the PU layer permeate side was at low pressure, it could be considered an ideal gas mixture and the air partial pressure (stagnant gas) was the same across the pores. Therefore, Ppermeate,PU = Pair + Pvap,PU and Pvap,PTFE = yvap,PTFEPtotal,PTFE = yvap,PTFE(Patm − Pvacuum)
Eqn (11) can be expressed as eqn (12).
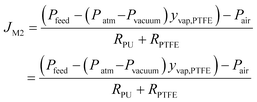 | (12) |
The feed gauge pressure is only about 1–2 kPa, thus, Pfeed approximately equals Patm.
Due to:
P vacuum = Patm − Pair, eqn (12) can be rewritten as
 | (13) |
The mass transfer across the M1 membrane can be expressed as eqn (14).
 | (14) |
Since the two membranes showed similar flux at 35 °C and 65 kPa (Fig. 4a) and the gas pumping flowrate of the vacuum pump is only related to the vacuum pressure, it can be concluded that the vapour partial pressures on the permeate side of the M1 and M2 membranes should be similar under these operating conditions. Therefore,
| (Patm − Pvacuum)ypermeate ≈ (Patm − Pvacuum)yvap,PTFE | (15) |
In a system under stable vacuum pressure, air can be considered as a stagnant component. Therefore, the air pressure in the system should be the same and no greater than the absolute pressure in the system. Thus, under 65 kPa vacuum pressure, the air pressure in the system should be less than 36 kPa (assuming that the atmospheric pressure is 101 kPa). The feed vapour pressure should be less than the vapour pressure at 35 °C due to temperature polarisation, which is only 5.6 kPa (ref. 28) in eqn (14). Since JM1 is a positive value, (Patm − Pvacuum)ypermeate should be less than 5.6 kPa. Therefore, based on eqn (15), (Patm − Pvacuum)yvap,PTFE should be less than 5.6 kPa, and the numerator in eqn (13), Pvacuum − (Patm − Pvacuum)yvap,PTFE, should be greater than (65–5.6) = 59.4 kPa. Since JM1 ≈ JM2 and the numerator in eqn (14) is less than 5.6 kPa, the denominator in eqn (13) should be greater than 10.6 times the denominator in eqn (14). Therefore, it can be concluded that the mass transfer resistance (RPU+ RPTFE) of the M2 membrane is at least about 10.6 times the RM1 of the M1 membrane. However, because the RM1 is 2.2 times the RPTFE, the major mass transfer resistance is from the PU coating layer.
Based on eqn (13) and (14), it can be found that as the vacuum pressure (Pvacuum) increased the flux of both membranes increased. The enlarged flux difference in Fig. 4a and b at high vacuum pressure between M1 and M2 membranes is due to their mass transfer resistance difference. The mass transfer resistance of the M2 membrane is at least 10.6 times that of the M1 membrane, and the mass transfer coefficient is defined as the inverse of the mass transfer resistance as shown in eqn (3) and (11). In Fig. S1,† the flux of the M2 membrane is normalised against that of the M1 membrane based on eqn (3) under the same driving force. It can be seen that as the driving force increases, the flux difference between the M1 and M2 membranes becomes greater.
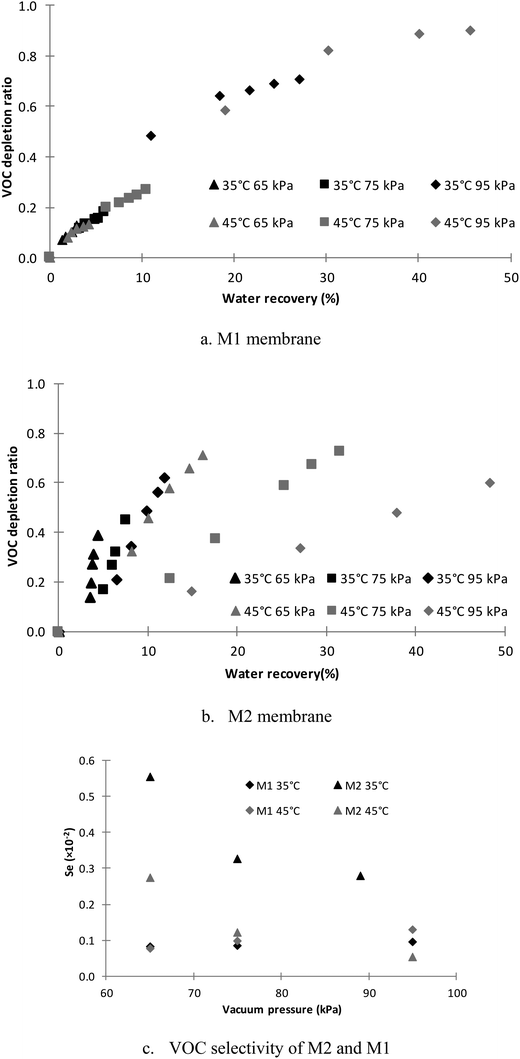 | ||
| Fig. 5 Organic depletion ratio and selectivity at different feed recoveries for various vacuum pressures (flowrate = 30 mL min−1, error = ±5%). | ||
In Fig. 5a, it can also be seen that the VOC removal of the M1 membrane showed a strong relationship to the recovery, but a weak relationship to the temperatures and vacuum pressures. As shown in Table 4, the molar ratio of the organics in the feed solution was about 0.7%. Therefore, the solution was very dilute and could be considered as an ideal solution. The partial vapour pressure and relative volatility calculated based on an ideal solution is shown in Table 4.29 For a distillation process, the separation of different components depends on the volatility difference (vapour pressure difference) as shown in eqn (2). For ideal solutions, the reduced ambient pressure (increased vacuum pressure) will accelerate the mass transfer rates of all components based on eqn (3) and (4), but will not alter the volatility difference.29 Therefore, the composition in the vapour phase will be determined by the composition in the liquid phase at the same temperature, which was also demonstrated in Fig. 5a as the VOC depletion ratio only changed with feed recovery at the same temperature. In Table 4, the vapour pressures of the components in the feed solution at different temperatures are listed. As the temperature increased from 35 °C to 45 °C, it can be seen that the water vapour pressure had the greatest increase. Therefore, based on eqn (1) and (2), the relative volatility between the VOCs and water became smaller with increasing temperature. It can also be seen from Fig. 5a that the organic depletion ratio at 35 °C was higher than that at 45 °C for recoveries lower than 20%. However, the depletion ratio difference between different temperatures reduced, because the higher VOC flux resulted in a lower VOC concentration in the feed and suppressed the VOC mass transfer rate.
| Component | Molar ratio | Partial vapour pressure (kPa) | Relative volatility to water | Vapour pressure increment (%) | ||
|---|---|---|---|---|---|---|
| 35 °C | 45 °C | 35 °C | 45 °C | |||
| Water | 0.993 | 5.6 | 9.6 | 1 | 1 | 71% |
| Formaldehyde | 0.004 | 1.32 | 1.74 | 58 | 45 | 32% |
| Methanol | 0.002 | 0.29 | 0.46 | 25 | 24 | 59% |
| Dimethoxymethane | 0.001 | 0.32 | 0.46 | 56 | 48 | 44% |
In Fig. 5b, the VOC depletion ratio using the M2 membrane is shown. It can be seen that the VOC depletion ratio varied with both the temperature and vacuum pressure. The depletion ratio at high vacuum pressure and temperature is less than that at low vacuum pressure and temperature at the same recovery. A depletion ratio of 0.4 was achieved with 4.4% feed recovery at 65 kPa and 35 °C.
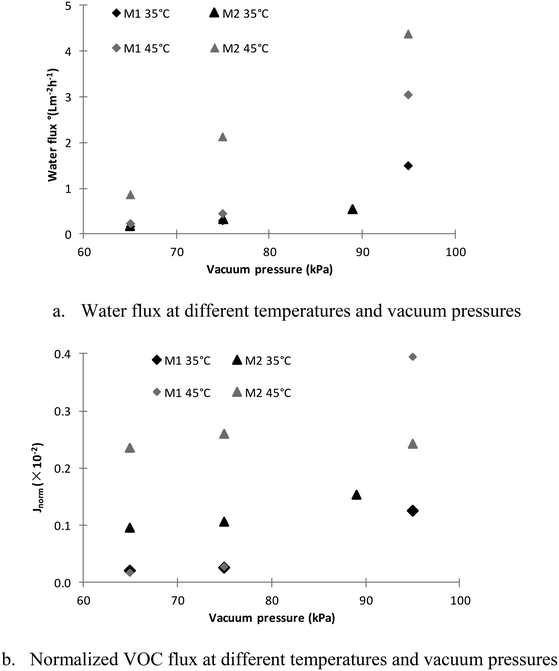
It can also be seen from Fig. 5c that the PTFE (M1) membrane selectivity only changes slightly with vacuum pressure and temperature. However, the VOC selectivity of the M2 membrane decreased dramatically with increasing vacuum pressure and temperature. The dramatic decline of the VOC selectivity can be attributed to the difference of the dominant mass transfer resistance between water and the VOC at different temperatures and vacuum pressures. From Fig. 6a and b, it can be found that as the vacuum pressure increased from 65 to 95 kPa, the M2 water flux increased by 3 and 5 times, respectively, at 35 °C and 45 °C, but the normalized VOC flux of the M2 membrane remained almost unchanged at 45 °C and increased by approximately 50% at 35 °C. The water flux of the M2 membrane is determined by the hydraulic pressure difference across the hydrophilic layer of the M2 membrane. As the vacuum pressure increased, it can be found from eqn (11) that the water flux will increase. However, the selectivity of the organics and/or the rejection of water molecules (demonstrated by the water uptake test) depend on the hydrophobicity, which will not alter under different vacuum pressures. The rate of the overall organics carried by the feed (high flux) transferred across the hydrophilic layer will become greater under higher vacuum pressure due to the higher hydraulic pressure across the PU layer (ΔPPU) as shown in eqn (11). The organic concentrated in the PU layer would be diluted more by the feed with lower organic concentration at higher flux. Therefore, it can be seen at 35 °C that the VOC flux of the M2 membrane increased (Fig. 6b) due to the increased VOC transfer rate with increasing vacuum pressure, but the VOC selectivity decreased (Fig. 5b) due to the reduced organic concentration in the hydrophilic layer.
In comparison to the M1 VOC selectivity in Fig. 5c, it can be found that the M2 membrane showed better VOC selectivity under most test conditions, except under 95 kPa at 45 °C. The maximum organic selectivity of the M2 membrane was about 4.6 times that of the M1 membrane. Since the organic selectivity of the M1 membrane is based on distillation separation following Raoult's law, the higher organic selectivity of the M2 membrane demonstrated that organic removal by the M2 membrane did not follow Raoult's law. It is proposed that the high VOC selectivity of the M2 membrane is due to the ability of PU to absorb VOC.30 Furthermore, the affinity of the hydrophilic layer to the hydrophilic end of an amphiphilic molecule17 will leave the other hydrophobic end exposed to the aqueous solution and theoretically convert the hydrophilic pores into partial hydrophobic pores, which has been demonstrated by the water uptake tests. This behaviour will reduce the chance of water molecules accessing the second hydrophobic layer (reducing wetting risk) and increase the organic concentration in the hydrophilic layer, which also facilitates the VOC selectivity of the M2 membrane.
In comparison with the water flux of the M1 membrane in Fig. 6a, it can be seen that the water flux increment of the M2 membrane increased as the temperature rose from 35 to 45 °C under the same vacuum pressure. However, in Fig. 4, the deionised water flux of the M1 membrane was higher than that of the M2 membrane under the same conditions. The operating parameters of the VOC removal tests were maintained the same as the deionised water tests, except for the VOC in the feed. Therefore, it is proposed that the interactions between the PU layer and VOCs altered the mass transfer characteristics of the PU layer at 45 °C, which also led to the almost unchanged VOC flux in Fig. 6b. Previous studies have demonstrated the swelling of the PU polymer caused by organic compounds/solvents such as ethanol and chlorobenzene31,32 that can lead to a change of the membrane porosity and pore size.33 Based on the experimental results in this study, the presence of VOC led to the swelling of the PU layer of M2 based on the increased water permeability, especially at elevated temperature.
A dramatic increase of the normalised VOC flux of the M1 membrane under a vacuum pressure of 95 kPa in Fig. 6b, which is due to the feed solution vapour pressure based on34 being greater than the reduced absolute vacuum pressure (i.e. VOCs boil at that vacuum pressure).
Therefore, the low vacuum pressure and low temperature will facilitate the selectivity of the M2 membrane as shown in Fig. 5c, which will also reduce the water vapour transfers through the membrane and reduce the vacuum energy consumption (Fig. 4). As shown in Fig. 6, although the low vacuum pressure would not have significant impact on the organic flux, the organic flux reduced 30–60% when reducing the feed temperature from 45 °C to 35 °C. Thus, there is trade-off between the selectivity and organic flux, depending on the requirement of the wastewater treatment.
3.3 Research in the future
Although the M2 membrane showed reasonable removal and anti-wetting performance for treating VOCs in VMD, the membrane is far from optimal. The PU layer seemed to swell in the organic solution and both high temperature and vacuum pressure could cause the deterioration of the VOC selectivity. Therefore, a membrane with a stable organic hydrophilic layer is necessary for organic removal at high temperature.4. Conclusion
The mechanism of a dual-layer hydrophilic–hydrophobic membrane for selective organic removal was discussed and compared to the performance of a porous PTFE membrane.The dual layer membrane showed increased VOC selectivity due to the PU coating layer absorbing VOCs and the high affinity of the PU layer to the organic hydrophilic end, which reduced the water content and increased the organic concentration in the hydrophilic layer. The maximum VOC selectivity of the dual-layer membrane was about 4.6 times that of the PTFE membrane.
Although the membrane structure was not optimised, the dual layer membrane showed relatively high selectivity of VOC at low temperature and vacuum pressure. A 0.4 organic depletion ratio (40% organic removed) was achieved with 4.4% water recovery at 35 °C and a vacuum pressure of 65 kPa. The selectivity difference of the dual layer membrane at different temperatures and vacuum pressures was due to the mass transfer competition across the hydrophilic layer. High temperature and vacuum pressure will promote both the water and VOC flux, but the magnitude of the water flux increase was greater than that of the VOC flux. The VOC selectivity of the dual layer membrane was less than that of the single layer PTFE membrane at 45 °C and 95 kPa, and it is proposed that this was due to membrane swelling. The dual layer membrane showed better wetting resistance than the single layer PTFE membrane.
Therefore, developing a membrane with a stable hydrophilic–hydrophobic layer can be promising for VOC removal.
Nomenclature
| α i,j | Relative volatility |
| A | Membrane area |
| b | Membrane thickness |
| C | VOC concentration in the feed |
| ΔC | VOC change during time t |
| C m | Membrane mass transfer coefficient |
| ε | Membrane porosity |
| J i | Flux of the component across the membrane |
| J M1 | Flux of M1 membrane |
| J norm | Normalised VOC flux |
| J voc | VOC flux at certain feed recovery |
| m | Mass of treated water |
| m 0 | Original feed mass |
| M | Molecular weight |
| P air | Absolute air pressure in the PTFE layer of the M2 membrane |
| P atm, Pvacuum | Atmospheric and vacuum pressures, respectively |
| P feed | Absolute hydraulic pressure of the feed |
| P total | Total pressure on the permeate side of the membrane |
| P permeate,PU | Absolute total pressure on the permeate side of the PU layer |
| P vap,feed | Vapour pressure on the M1 feed side |
| P vap,permeate | Vapour pressure on the M1 permeate side |
| P vap,PTFE | Vapour pressure on the permeate side of the PTFE layer |
| P vap,PU | Vapour pressure on the permeate side of the PU layer |
| P i 0, Pj0 | Vapour pressures of volatiles and water at temperature T |
| ΔP | Vapour pressure difference across the membrane |
| ΔPi | Vapour pressure difference of the component across the membrane |
| ΔPPU | Hydraulic pressure difference across the PU layer |
| ΔPPTFE | Vapour pressure difference across the PTFE layer |
| R PTFE | Mass transfer resistance of the PTFE layer of the M2 membrane |
| r | Mean membrane pore radius |
| R | Depletion ratio |
| Recovery | Percentage of the water depleted from the feed |
| R M1 | Mass transfer resistance across the M1 membrane |
| R PU | Mass transfer resistance of the PU layer |
| Se | Membrane selectivity to VOC |
| t | Time |
| τ | The membrane pore tortuosity |
| x i | Molar ratios of the volatile component in the liquid phase |
| y i | Molar ratios of volatile component in the gas phase |
| y permeate | Vapour molar ratio on the M1 permeate side |
| y vap,PTFE | Vapour molar ratio on the PTFE layer permeate side |
Conflicts of interest
There is no conflict to declare.References
- P. Hunter and S. T. Oyama, Control of volatile organic compound emissions, John Wiley, 2000 Search PubMed.
- W.-H. Cheng, S.-K. Hsu and M.-S. Chou, Volatile organic compound emissions from wastewater treatment plants in Taiwan: Legal regulations and costs of control, J. Environ. Manage., 2008, 88, 1485–1494 CrossRef CAS PubMed.
- Organic Chemicals, Plastics and Synthetic Fibers Effluent Guidelines, USEPA, 1987 Search PubMed.
- A. M. Alklaibi and N. Lior, Membrane-distillation desalination: Status and potential, Desalination, 2005, 171, 111–131 CrossRef CAS.
- K. Smolders and A. C. M. Franken, Terminology for Membrane Distillation, Desalination, 1989, 72, 249–262 CrossRef CAS.
- C. A. Rivier, M. C. García-Payo, I. W. Marison and U. von Stockar, Separation of binary mixtures by thermostatic sweeping gas membrane distillation: I. Theory and simulations, J. Membr. Sci., 2002, 201, 1–16 CrossRef CAS.
- L. Basini, G. D'Angelo, M. Gobbi, G. C. Sarti and C. Gostoli, A desalination process through sweeping gas membrane distillation, Desalination, 1987, 64, 245–257 CrossRef CAS.
- M. Khayet, P. Godino and J. I. Mengual, Theory and experiments on sweeping gas membrane distillation, J. Membr. Sci., 2000, 165, 261–272 CrossRef CAS.
- M. Khayet, P. Godino and J. I. Mengual, Nature of flow on sweeping gas membrane distillation, J. Membr. Sci., 2000, 170, 243–255 CrossRef CAS.
- M. C. Garcia-Payo, C. A. Rivier, I. W. Marison and U. von Stockar, Separation of binary mixtures by thermostatic sweeping gas membrane distillation: II. Experimental results with aqueous formic acid solutions, J. Membr. Sci., 2002, 198, 197–210 CrossRef CAS.
- S. Bandini, C. Gostoli and G. C. Sarti, Separation efficiency in vacuum membrane distillation, J. Membr. Sci., 1992, 73, 217–229 CrossRef CAS.
- G. C. Sarti, C. Gostoli and S. Bandini, Extraction of organic components from aqueous streams by vacuum membrane distillation, J. Membr. Sci., 1993, 80, 21–33 CrossRef CAS.
- I. J. Halvorsen and S. Skogestad, Distillation theory, Encyclopedia of Separation Science, 2000, pp. 1117–1134 Search PubMed.
- D. Y. Cheng and S. J. Wiersma, Composite membrane for a membrane distillation system, US4419242A, 1982.
- S. Bonyadi and T. S. Chung, Flux enhancement in membrane distillation by fabrication of dual layer hydrophilic–hydrophobic hollow fiber membranes, J. Membr. Sci., 2007, 306, 134–146 CrossRef CAS.
- F. Edwie, M. M. Teoh and T.-S. Chung, Effects of additives on dual-layer hydrophobic–hydrophilic PVDF hollow fiber membranes for membrane distillation and continuous performance, Chem. Eng. Sci., 2012, 68, 567–578 CrossRef CAS.
- A. D. McNaught and A. Wilkinson, Compendium of Chemical Terminology, in, International Union of Pure and Applied Chemistry, 1997, p. 1670 Search PubMed.
- D. Cheng, J. Zhang, N. Li, D. Ng, S. R. Gray and Z. Xie, Antiwettability and Performance Stability of a Composite Hydrophobic/Hydrophilic Dual-Layer Membrane in Wastewater Treatment by Membrane Distillation, Ind. Eng. Chem. Res., 2018, 57, 9313–9322 CrossRef CAS.
- J. Zhang, N. Dow, M. Duke, E. Ostarcevic, J.-D. Li and S. Gray, Identification of material and physical features of membrane distillation membranes for high performance desalination, J. Membr. Sci., 2010, 349, 295–303 CrossRef CAS.
- M. A. Izquierdo-Gil and G. Jonsson, Factors affecting flux and ethanol separation performance in vacuum membrane distillation (VMD), J. Membr. Sci., 2003, 214, 113–130 CrossRef CAS.
- S. Bandini, C. Gostoli and G. Sarti, Separation efficiency in vacuum membrane distillation, J. Membr. Sci., 1992, 73, 217–229 CrossRef CAS.
- J. Zhang, S. Gray and J.-D. Li, Modelling heat and mass transfers in DCMD using compressible membranes, J. Membr. Sci., 2012, 387–388, 7–16 CrossRef CAS.
- J. Zhang, J.-D. Li, M. Duke, M. Hoang, Z. Xie, A. Groth, C. Tun and S. Gray, Modelling of vacuum membrane distillation, J. Membr. Sci., 2013, 434, 1–9 CrossRef CAS.
- J. Zhang, N. Dow, M. Duke, E. Ostarcevic and S. Gray, Identification of material and physical features of membrane distillation membranes for high performance desalination, J. Membr. Sci., 2010, 349, 295–303 CrossRef CAS.
- J. Zhang, J.-D. Li and S. Gray, Effect of applied pressure on performance of PTFE membrane in DCMD, J. Membr. Sci., 2011, 369, 514–525 CrossRef CAS.
- J. Zhang, Theoretical and experimental investigation of membrane distillation, Victoria University, 2011 Search PubMed.
- J. Ní Mhurchú and G. Foley, Dead-end filtration of yeast suspensions: Correlating specific resistance and flux data using artificial neural networks, J. Membr. Sci., 2006, 281, 325–333 CrossRef.
- R. E. Sonntag, C. Borgnakke, G. J. Van Wylen and S. Van Wyk, Fundamentals of thermodynamics, Wiley New York, 1998 Search PubMed.
- J. M. Smith, M. M. Abbott and H. C. Van Ness, Introduction to chemical engineering thermodynamics, McGraw-Hill, New York, 5th edn, 1996 Search PubMed.
- E. Scholten, L. Bromberg, G. C. Rutledge and T. A. Hatton, Electrospun polyurethane fibers for absorption of volatile organic compounds from air, ACS Appl. Mater. Interfaces, 2011, 3, 3902–3909 CrossRef CAS PubMed.
- J. H. Lee and S. C. Kim, Hydrophilic-hydrophobic interpenetrating polymer networks (IPN's) synthesized under high pressure. 1. Morphology, dynamic mechanical properties, and swelling behavior of polyurethane-polystyrene IPN's, Macromolecules, 1986, 19, 644–648 CrossRef CAS.
- S. Ajithkumar, N. Patel and S. Kansara, Sorption and diffusion of organic solvents through interpenetrating polymer networks (IPNs) based on polyurethane and unsaturated polyester, Eur. Polym. J., 2000, 36, 2387–2393 CrossRef CAS.
- A. Sharma, S. P. Thampi, S. V. Suggala and P. K. Bhattacharya, Pervaporation from a Dense Membrane: Roles of Permeant–Membrane Interactions, Kelvin Effect, and Membrane Swelling, Langmuir, 2004, 20, 4708–4714 CrossRef CAS PubMed.
- Y. A. Cengel and M. A. Boles, Thermodynamics: an engineering approach, McGraw-Hill, New York, 6th edn, 2008 Search PubMed.
Footnote |
| † Electronic supplementary information (ESI) available. See DOI: 10.1039/c8ew00624e |
| This journal is © The Royal Society of Chemistry 2019 |

