 Open Access Article
Creative Commons Attribution 3.0 Unported Licence
Analysis and simulation of multiphase hydrodynamics in capillary microseparators
Lu
Yang
,
Agnieszka
Ładosz
 and
Klavs F.
Jensen
 *
*
Department of Chemical Engineering, Massachusetts Institute of Technology, Cambridge, MA 02139, USA. E-mail: kfjensen@mit.edu
First published on 17th January 2019
Abstract
The capillary microseparator is an important microfluidic device for achieving the inline separation of biphasic segmented flows. While it has found wide applications in areas such as on-chip synthesis of pharmaceuticals and fine chemicals, many aspects regarding its operating ranges and hydrodynamic details remain to be elucidated. In this work, we employ OpenFOAM computational fluid dynamics (CFD) method to systematically simulate the performance of the capillary microseparator under the retention, normal operation and breakthrough regimes. The three distinct operating regimes are in accordance with experimental observations. In addition, the simulations enable quantification of the instantaneous flow rate through each micron-scale capillary microchannel and provide detailed predictions even under very low pressure differences (∼10 Pa), both of which are difficult to achieve experimentally. Furthermore, inspired by high-resolution hydrodynamics from the CFD simulations, we develop a simple analytic expression that predicts the retention threshold of the microseparator in good agreement with the simulated results and recent computations and experimental data.
Introduction
Miniaturization of chemical processes via on-chip synthesis and manipulation has attracted considerable attention and undergone significant development in recent years.1–6 In particular, the co-introduction of biphasic flow into a single microchannel gave rise to segmented flow, where droplets of the non-wetting phase are alternated between segments of the wetting fluid while moving concomitantly through a microchannel.7–13 The segmented flow configuration exhibits enhanced heat and mass transfer performance owing to increased circulation and specific interfacial area, and has thus found many lab-on-chip applications, including multiphase reaction screening,14 kinetics determination,15 chemical synthesis,16 crystallization,17 extraction,18,19 and microchemical assays.20 These applications have proven to be more efficient and effective compared to their conventional-scale counterparts.In tandem with the segmented flow module, in most applications, the subsequent continuous separation of the multiphase flow into single phase streams is highly desirable, which necessitated the development of inline multiphase microseparators that are tailored to the characteristics of microscale flows.18,21 Conventional multiphase separation strategies, which operate based on the settling effect of gravity, cannot be scaled down directly, as the influence of the capillary force dominates over gravity on the microscale. Instead, new designs that take advantage of the capillary force have been developed to effectively separate biphasic flows, whether gas/liquid or liquid/liquid. Specifically, Gunther et al. designed a micro-fabricated PDMS device that separated alternating segments of immiscible liquids by using interfacial tension.22 As segments of wetting and non-wetting fluid travel through the capillary section, the wetting phase was drawn into the side channels due to the capillary effect (Fig. 1a). Complete separation was achieved by applying a higher pressure at the non-wetting outlet than the wetting outlet to propel the wetting phase through the capillaries.
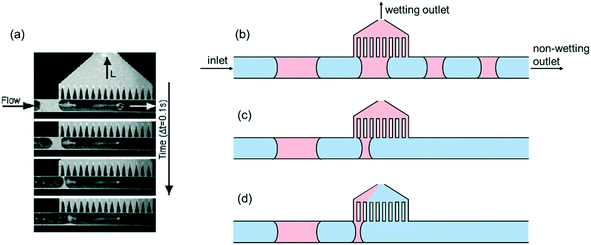 | ||
| Fig. 1 (a) A series of photographs demonstrating the separation of a gas/liquid mixture using the capillary separator22 (copyright 2005 by American Chemical Society); scheme of the different operation modes of the capillary separator when varying the pressure difference between the non-wetting and wetting outlets: (b) retention; (c) complete separation; (d) breakthrough. | ||
The concept of capillary separation has inspired a wide variety of on-chip microseparators with applications in diverse fields. Angelescu et al. employed the capillary microseparator to separate oil from emulsion and performed in situ spectroscopy for compositional analysis.23 Assmann et al. adopted similar designs for the complete separation of two immiscible liquids in the presence of an inert gas phase, and the separation of water and supercritical CO2 for the extraction of valuable chemical products.24–26 Furthermore, Castell et al. fabricated an integrated PTFE microchip device that demonstrated the successful separation of water-chloroform segmented flow.27 The system developed by Castell et al. was able to work well even when the permeate phase contained solid microparticles, which extended the range of working fluid to include particle-laden flow.
The concept of using capillary force to separate segmented flow has also found important applications in microanalytical systems with individual samples encapsulated and compartmentalized via droplets. In that case, the capillary-separator removed the continuous phase prior to sample analysis.20,28 While the above examples required the microfabrication of capillaries on a planar device, Scheiff et al. designed a simpler system by inserting a metal needle through the side wall of a piece of plastic tubing, so that water could be removed from the mixture through the needle as the biphasic segmented flow passed through the tubing.29 In another recent advancement, a section of porous capillary was inserted into the main channel to serve as an inline separator, which conveniently removes the wetting phase under a wide range of flow rates.30–32
Regardless of variations in design, the key parameter controlling the performance of the device is the pressure difference between the two outlets (ΔPoutlet), the main channel outlet (which is the non-wetting outlet) and the capillary outlet (which is the wetting outlet) (Fig. 1b). To achieve complete separation of the two phases, two conditions need to be satisfied. (1) While the wetting phase enters the capillary region, the non-wetting phase must remain in the main channel. (2) There must be a high enough pressure gradient along the capillary to propel all the wetting fluid through when the wetting slug is in contact with the capillary region.
These two conditions gave rise to two design criteria. (1) The first condition translates into the breakthrough pressure difference, which is the upper bound of the operating pressure range of the device. Above this pressure, the non-wetting fluid will also be forced into the capillary region, producing an unseparated mixture at the non-wetting outlet (Fig. 1d). Since the breakthrough phenomenon is controlled by the meniscus formed within the capillaries, this pressure threshold is determined by the Young–Laplace equation within the capillary geometry:
 | (1) |
Here σ is the interfacial tension between the two immiscible fluids, H is the height of the capillary channel, W is the width of the capillary channel, θ is the contact angle.
(2) The second condition corresponds to the lower end of the operating pressure range, which is the retention pressure threshold. Below this pressure, the pressure difference would not be high enough to propel all the wetting phase through the capillaries, thus resulting in retention of the wetting phase in the main channel. Theoretically, the retention pressure threshold is determined by the Hagen–Poiseuille equation of laminar flow in a capillary channel.
 | (2) |
Together, ΔPbreakthrough and ΔPretention define the operating window of the device. Complete separation occurs when ΔPretention < ΔPoutlet < ΔPbreakthrough, where all the wetting phase is removed through the capillaries, and all the non-wetting phase remains in the main channel. Complete understanding of the upper and lower boundaries is crucial to predicting the operating range of the capillary separator in applications.
Based on this theoretical framework, Roydhouse et al.34 studied the change of the operating pressure window as a function of feed flow rates and derived a semi-empirical correlation for predicting the onset of the retention phenomena. In particular, an exponent of 2/3 for the flow rate dependence of the pressure threshold was proposed, accounting for the non-linearity in the experimental observation. This study also gave a brief foray into the computational study surrounding the breakthrough pressure limit. In addition, in an effort to widen the operating window and increase the adaptability of the device, Gaakeer et al.35 designed a wide and shallow side channel to function as the capillary, in order to reduce hydraulic resistance without compromising the breakthrough pressure ceiling. Gürsel et al.36 also applied a slit-shaped capillary separator with rectangular channels to achieve extraction and separation on a pilot scale. While the above studies provided useful insights into the operating ranges of the device, there is still a strong need for first-principle-based modelling that would enable prediction and elucidation of the multiphase hydrodynamics and operating regimes in the microseparators.
Owing to recent advancements in computing power and algorithm development, computational fluid dynamics (CFD) has emerged as a powerful method for understanding multiphase hydrodynamics on the microscale, as demonstrated for different microfluidic devices.37–40 Compared to experimental measurements and analytical expressions, the CFD method provides instantaneously and three-dimensional physical details of the underlying hydrodynamic patterns, which enables predictions of the performance of a device under given operating conditions, reduces experimental time and cost, and provides insight into optimal reactor designs.
To our knowledge, there are no comprehensive simulations to date of capillary microseparators covering the full span of operating conditions. Therefore, in order to obtain a better understanding of the underlying physics and enable accurate predictions, we systematically model the hydrodynamics of the device under various operating conditions using CFD simulations, specifically the volume-of-fluid (VOF) method. We describe the simulation of the operating regimes of the microseparator as well as the quantification of the capillary flow rates. Additionally, we present a new analytical model for the retention pressure threshold that is easy to apply and provides predictions consistent with the CFD results.
Methods
CFD simulations
One of the most widely adopted methods for simulating multiphase flow on the microscale is the volume-of-fluid (VOF) method.41 We chose this method for the simulation of capillary microreactors, as it enables the accurate capturing of the multiphase interface with high spatial and temporal resolution. Moreover, the same approach has provided accurate predictions for related multiphase flows in microreactors.38,40,42 The characteristic feature of this VOF method is its one-fluid framework that enables treating the multiphasic mixture as one phase with spatially varying densities and viscosities. Within each mesh cell, the fluid density and viscosity are expressed as the weighted averages of the multiple phases: | (3) |
 | (4) |
Here, αk is the volume fraction of the kth phase in the cell – a key variable in the VOF method.
With the one-fluid formulation, the VOF method circumvents the difficulty of modeling each phase individually along with associated complexity of interfacial momentum exchange. In the VOF method, only one overall momentum equation is solved:
 | (5) |
| ∇·U = 0 | (6) |
Here, Fst refers to the surface tension force, which is a three-dimensional representation of the interfacial tension force formulated based on the continuous surface force (CSF) theory.43
Apart from the momentum equation, an additional equation is needed to resolve the changing phase distribution field, denoted as αk. The governing equation for αk takes the form of:
 | (7) |
 | (8) |
For the immiscible biphasic system of interest to this study, αk must transition sharply between 0 and 1 across phase boundaries. Therefore, to minimize numerical diffusion through iterations, an interfacial compression term is included in the αk governing equation:44,45
 | (9) |
 | (10) |
U r can be considered as a compression velocity to sharpen the interface, which is expressed as a function of nf, the normal vector of the cell interface. Additionally, ϕ is the mass flux through the interface, Sf is the surface area of the considered interface, and Cγ is a tuning factor that controls the strength of the compression. The hydrodynamic solver outlined here has been validated in our previous work with respect to experiments and analytic solutions for segmented flows in microreactors.38,40,42
Numerical setup and discretization
All the CFD simulations were performed with the help of the open-source C++-library OpenFOAM 2.1.1.46 The mesh for the capillary separator geometry was created by the mesh-generating software Pointwise V17.3R3 (Pointwise, Inc., Fort Worth, TX, USA). To speed up the calculation, we split the domain into multiple sections and performed parallelized computation on a 128-core high performance computing cluster (Dell PowerEdge C6220). The size of the time steps is limited by setting a maximum Courant number of 0.3, which has been reported to be sufficiently low without compromising the speed of the simulation.37 The limited linear differencing scheme was employed for spatial discretization. For the handling of the αk function, a special algorithm named Multidimensional Universal Limiter with Explicit Solution (MULES) was used to ensure the boundedness of the solution. (OpenFOAM User Guide, version 4.0, 2016, OpenCFD Ltd.)The CFD model required multiple parameters, including the main channel and capillary dimensions, the interfacial properties including wall contact angle and interfacial tension, the fluid properties including densities and viscosities, and the operating conditions, such as pressure, velocity and phase distributions.
Fig. 2 shows the geometry used in the simulation of the capillary separator. The main channel width is 400 μm, the capillary length is 200 μm, and capillary width is 20 μm. The geometry is 10.8 mm in length with a total of 322![[thin space (1/6-em)]](https://www.rsc.org/images/entities/char_2009.gif) 000 cells. The mesh is two-dimensional to save computation time and is set up such that there are 120 cells along the cross section of the main channel, and 8 cells along the cross section of each of the 16 capillary channels. The simulation has been tested to be mesh independent. The initial condition is set such that there are alternating slugs of the two phases flowing through the main channel from left to right, and the capillary region is fully wetted by the wetting phase. For demonstration purpose, the channel contains biphasic flow of water (denoted by blue) and toluene (denoted by red), and the channel wall is hydrophobic, i.e., the contact angle for toluene is zero. The fluid combination and wall hydrophilicity can be tuned by changing fluid properties, interfacial tension, and contact angle. The pressure boundary conditions are crucial to the operation of the device. The pressure at the inlet is set as zero-gradient. We set the pressure at the outlet of the capillary region, Pcapillary, to atmospheric value (Pcapillary = 0 Pa), and the back pressure at the outlet of the main channel, Pmainchannel, to a defined positive value. The most important parameter to be tuned in running the simulation is the pressure difference between the outlets, ΔPoutlet = Pmainchannel − Pcapillary.
000 cells. The mesh is two-dimensional to save computation time and is set up such that there are 120 cells along the cross section of the main channel, and 8 cells along the cross section of each of the 16 capillary channels. The simulation has been tested to be mesh independent. The initial condition is set such that there are alternating slugs of the two phases flowing through the main channel from left to right, and the capillary region is fully wetted by the wetting phase. For demonstration purpose, the channel contains biphasic flow of water (denoted by blue) and toluene (denoted by red), and the channel wall is hydrophobic, i.e., the contact angle for toluene is zero. The fluid combination and wall hydrophilicity can be tuned by changing fluid properties, interfacial tension, and contact angle. The pressure boundary conditions are crucial to the operation of the device. The pressure at the inlet is set as zero-gradient. We set the pressure at the outlet of the capillary region, Pcapillary, to atmospheric value (Pcapillary = 0 Pa), and the back pressure at the outlet of the main channel, Pmainchannel, to a defined positive value. The most important parameter to be tuned in running the simulation is the pressure difference between the outlets, ΔPoutlet = Pmainchannel − Pcapillary.
Results and discussion
CFD simulation of the capillary microseparator
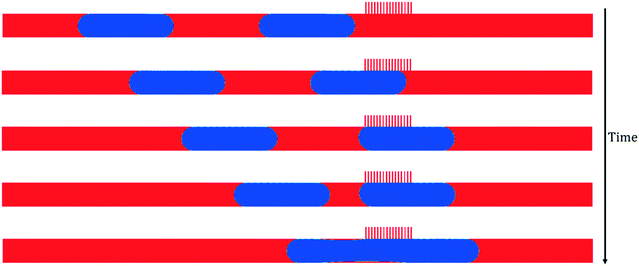
ΔPoutlet controls the three operating regimes of the capillary microseparator, and thus, the most important quantity for achieving successful and consistent separation in applications. Therefore, our first goal was to examine whether it was possible to observe the three corresponding regimes in the CFD simulation by tuning the pressure difference between the main channel outlet and the capillary region outlet.As shown by eqn (1), the breakthrough pressure threshold is determined by the capillary pressure of the meniscus within the capillaries. For our system, the calculated Young–Laplace pressure in the capillary is 3600 Pa. When the pressure difference between the outlets, ΔPoutlet, stays below this limit, normal operation was observed. Fig. 3 demonstrates the complete separation process as a train of segmented flow approaches the capillary region. When a non-wetting slug meets with the capillary region, it remains intact and moves through the main channel as if the capillary region is nonpermeable. In contrast, due to the capillary effect, the subsequent wetting slug enters into the side channels as soon as it encounters the first capillary.
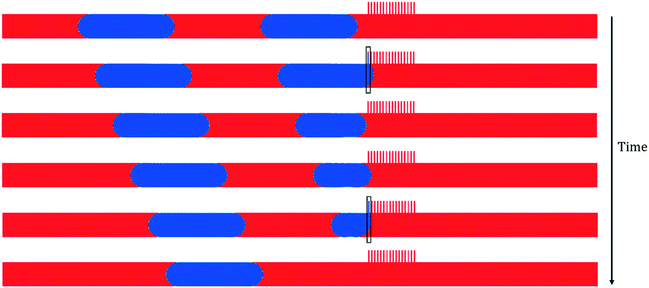
Increasing the pressure difference above the Young-Laplace limit causes breakthrough (Fig. 4). In this case, the increased pressure gradient across the capillaries pushes both the wetting and non-wetting phases through the capillary channels. The breakthrough of the leading non-wetting droplet manifest itself by the droplet gradually shrinking as it bursts through the first capillary periodically (black box marked region in Fig. 4)
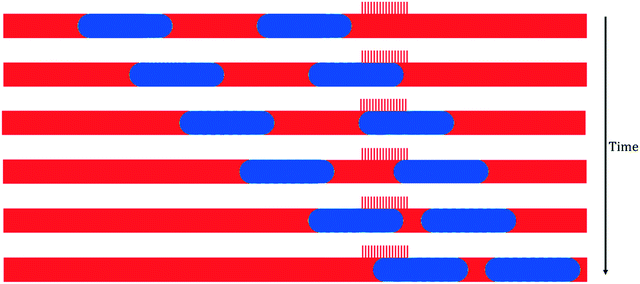
Besides breakthrough and normal operation, the third regime is retention, when the pressure difference is not high enough to remove all the wetting phase as it passes through the capillary region. Fig. 5 depicts the entire time sequence of the retention phenomenon, where at the onset, a non-wetting slug moves through the capillary region without being affected, then a wetting slug is partially going through the capillaries while retaining a residual amount in the main channel. Another non-wetting slug then follows.
We ran a series of simulations by varying the ΔPoutlet in this configuration, and discovered a retention pressure threshold of ΔPoutlet = 50 Pa based on the simulations. This is an interesting finding, as it deviates from the 12 Pa theoretical limit by more than quadrupling it. Motivated by this discrepancy, we developed an analytic model that correctly predicted CFD results, by taking into consideration the utilization rates of the capillaries through different stages of separation. The analytical model is presented in the next section. It is also worth noting that such small pressure differences on the order of 10 Pa are typically difficult to control and measure experimentally, but they can nevertheless be precisely captured in the CFD simulation, demonstrating one of the unique advantages of the modelling approach.
While the test cases shown above are based on water/toluene flow in a hydrophobic channel, in practice, the CFD model can be applied to any biphasic system as long as the wetting and fluid properties are known. In practice, the membrane separator has difficulty with partially immiscible systems with low surface tension differences.47 In addition to the cases presented here, we ran a wide range of simulations to demonstrate the robustness of the CFD method in predicting the operating ranges of the capillary separators, regardless of wetting characteristics (hydrophilic or hydrophobic channels), fluid combinations (gas/liquid or liquid/liquid), and slug configurations (single or multiple slug systems).
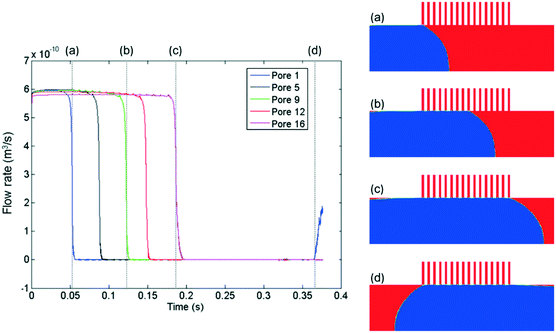
Beyond delineating the three operating regimes with high resolution, another advantage of the CFD method is its ability to provide a wide range of physical details, which allows us to capture and understand the hydrodynamic fingerprint of the device. In this aspect, one important parameter is the permeate flow rate through the capillaries. While it is possible to measure the flow rate in the main channel via experiments, it is very difficult to distinguish and quantify the flow rate through each one of the micron-scale capillaries. The CFD method provides us with the transient velocity profiles at each capillary outlet. We thus obtained the instantaneous flow rate through each capillary as a function of time by integrating the velocity profiles over the capillary cross sections (Fig. 6).
We observed several interesting patterns in accordance with the simulated hydrodynamic behavior:
(1) The flow rate decreases from a plateau value to zero as soon as a pore is temporarily blocked by the passing non-wetting segment, and increases as soon as the segment moves away. Looking at the plot for the first pore, it is initially obstructed by the non-wetting slug at time (a) and the flow rate drops to zero. Then as the slug departs at time (d), it reopens and flow through it resumes. Similarly, time points (b) and (c) correspond to when the fifth and ninth pores are blocked. Their flow rates recovered after the same interval of delay.
(2) Focusing on the plateau region at the top of the plot, we notice small periodic spikes. The plateau line of the nth pore contained n–1 spikes. A closer examination reveals that the occurrence of the small spikes is caused by the pressure disturbances as soon as a pore is blocked by the advancing non-wetting slug. Therefore, the nth pore would experience n–1 such pressure fluctuations before contacting the non-wetting slug.
The preceding examples demonstrate that the CFD model is able to simulate and predict the three distinct operating stages of the capillary separator. Moreover, the simulations offer a wealth of hydrodynamic details, such as quantification of the instantaneous flow rate through each capillary, which are difficult to measure experimentally. The physical insights lay the foundation for the development of a more accurate analytic model for the retention behavior.
Analytic model of the retention pressure threshold
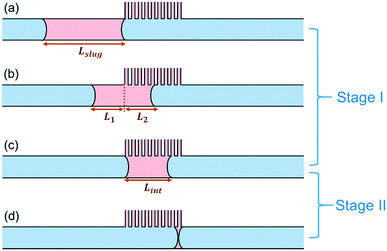
While the simulated breakthrough pressure threshold corresponds well with theoretical prediction from the Young–Laplace equation, we observed that there is a significant deviation between the simulated retention pressure threshold (50 Pa) and the pressure threshold calculated based on the Hagen–Poiseuille equation (12 Pa). In order to reconcile this discrepancy, the physical scenario surrounding the retention pressure threshold was analyzed in more detail.Suppose that the separator is operating right on the retention pressure threshold. This corresponds to the limit when the wetting slug has completely moved through the capillaries (i.e., its back meniscus touches its front meniscus) exactly at the end of the capillary region. This process can be further decomposed into two stages, as shown in Fig. 7. The first stage, the duration of which we shall name t1, starts when the front meniscus meets the beginning of the capillary region (Fig. 7a), and ends when the back meniscus arrives at the beginning of the capillary region (Fig. 7c). The second stage, the duration of which is t2, follows after the first stage, and lasts until the back meniscus catches up with the front meniscus (Fig. 7d), at which point the film-thin slug would collapse into small residual droplets attached to the wall. Those droplets do not usually move with the bulk flow and eventually become absorbed into the capillaries. The two stages in combination cover the entire separation process when the pressure operates on the retention boundary.
This model sheds light into the discrepancy between theoretical and simulation retention pressure thresholds. The theoretical model in eqn (2) implicitly assumes that the flow of the wetting phase is evenly distributed among all the capillaries, and that all the capillaries remain open throughout the separation process. However, this is not true as shown in Fig. 7. In fact, this assumption applies to neither stage: in both stages, only a fraction of the capillaries is being used. Therefore, the effective number of capillaries is smaller than the total number of capillaries, leading to a higher volumetric flow rate through each capillary, and consequently, a higher pressure threshold.
To solve for the retention pressure threshold using this model, we start by formulating the mass balance for the removal of the wetting slug during the first stage. Note that the slug in this stage consists of two sections, L1 and L2, as shown in Fig. 7b, and only L2 is in contact with the capillary region. The mass balance for the shrinking of the wetting slug during stage I therefore takes the following form:
| −d[L1(t) + L2(t)]Amain = L2(t)δQcapdt | (11) |
Here, Amain is the cross-sectional area of the main channel. Qcap is the volumetric flow rate through each capillary, δ is the capillary density, defined as the number of capillaries per unit length along the main channel. The inverse of δ is the distance occupied per capillary, which we name λ.
Since the back of the slug is constantly propelled by the linear velocity from the main channel inlet, the first section L1 shrinks steadily at the rate of Vin, which can be expressed as L1(t) = Lslug − Vint, where Vin is the linear velocity in the main channel coming from upstream of the capillary separator. Stage I ends when L1 reduces to zero, meaning that the duration of stage I is  .
.
With that, the only unknown left in eqn (11) is L2, with an initial condition of L2 = 0 at t = 0. The value of L2 at the end of stage I is equal to the length of the slug at that time point, Lint, the intermediate slug length, as shown in Fig. 7c.
The solution of eqn (11) is:
 | (12) |
Here,  , which is the ratio between the total flow rate coming in from the inlet, Qtot, and the flow rate through one capillary, Qcap. Note that Qtot = VinAmain. In most cases,
  so
so  , and the exponential term can therefore be neglected. An example will be demonstrated subsequently.
For stage II, similarly, the mass balance equation for the wetting slug is as follows:
| −dL3(t)Amain = L3δQcapdt | (13) |
L 3(t) is the total length of the slug during stage II. We know that at t = 0, L3 = Lint; and that at the end of stage II, L3 = Lfin. Lfin is the final length of the wetting slug, which can be considered as the distance occupied by one capillary, λ, since a minimum of one capillary is needed to remove the wetting phase from the main channel.
 | (14) |
Therefore, the minimum length of the capillary region is the distance travelled by the back meniscus during stage II:
 | (15) |
Neglecting the second term (which is also the second term in eqn (12), and is much smaller than the first term), the final expression is:
Lcap = λC![[thin space (1/6-em)]](https://www.rsc.org/images/entities/char_2009.gif) ln ln![[thin space (1/6-em)]](https://www.rsc.org/images/entities/char_2009.gif) C C | (16) |
n = C![[thin space (1/6-em)]](https://www.rsc.org/images/entities/char_2009.gif) ln ln![[thin space (1/6-em)]](https://www.rsc.org/images/entities/char_2009.gif) C C | (17) |
 . The developed model can be applied in two ways:
(1) Given the number of capillaries or the length of the capillary region, calculate the retention pressure threshold. One can start from eqn (16) or (17), and solve for the only unknown C. With C and Qtot, Qcap can be calculated, which is directly proportional to ΔPcap, as  . Since the retention pressure threshold is the pressure difference between the outlets, ΔPoutlet, it is also important to factor in the difference between ΔPcap and ΔPoutlet. The main difference arises from the flow resistance in the main channel beyond the capillary region, which is only about 2.4 Pa cm−1 as estimated by the Hagen–Poiseuille equation. In our geometry, this translates into a pressure difference of 1 Pa, meaning that ΔPcap − ΔPoutlet = 1 Pa. The retention pressure threshold can thus be obtained.
(2) Given an operating pressure difference of the device, ΔPoutlet, the above process can be followed in the reverse order to obtain the minimum length of the capillary region, or the minimum number of capillaries, that is needed for complete separation.
This model is able to predict the retention pressure threshold observed in the CFD simulations with high accuracy. In our test case, n = 16, therefore, C = 7.8 based on eqn (16), and  . Taking into consideration the difference between ΔPcap and ΔPoutlet due to laminar flow pressure drop, which is 1 Pa as stated previously, the model-predicted ΔPoutlet is 50 Pa, which is the same as the 50 Pa retention threshold (ΔPoutlet) that was observed in the CFD simulations.
To complete the analysis, we should also examine whether it is a valid assumption to neglect the second term in eqn (12): in this case,  . Therefore, neglecting this term would greatly simplify the model without compromising its accuracy.
Comparison of model predictions and experiments
The small dimensions and low flows through the microseparator channels raise significant challenges for detailed experiments. Fortunately, Ładosz and Rudolf von Rohr have recently published detailed experiments and computations of the operating limits of capillary separators.48 They modelled the breakthrough pressure with the Young-Laplace equation and determined the retention pressure bound with a model derived from experimental observations.As shown in Fig. 8, our results (dotted black line) overlap model results by Ładosz and Rudolf von Rohr (solid red line). When comparing the two models for the lower pressure bound it is evident that the underlying equations are identical, even though our work is based on CFD simulations and the model of Ładosz and Rudolf von Rohr on experimental observations. In our model we drop the term  and neglect the possible change in the velocity of the back of the slug if multiple slugs come into contact with the capillary region, which results in a simpler expression, free of experimental parameters. This simplified approach provides best results for the flow rate ratio Qd/Qc ≥ 1 (where Qd is the flow rate of the non-wetting phase) i.e. for large droplets and short slugs. In this case, droplets provide sufficient spacing between subsequent slugs so that isolated slugs arrive at the separator. For short droplets and elongated slugs, i.e. Qd/Qc < 1, the model over predicts the lower bound (Fig. 8F), most likely because it neglects the scenario of multiple slugs contacting the separator at once. For these more complex situations, the model of Ładosz and Rudolf von Rohr and full CFD simulations provide predictions that are more accurate. Both models perform much better than the Hagen–Poiseuille equation in predicting the behaviour of the capillary separators, and can provide a deeper understanding of hydrodynamics than is possible through experiments alone, such as the flows through individual channels. The good agreement with reported results48 and our previous validation of the VOF simulations38,40,42 provide confidence in the present capillary simulations and analysis.
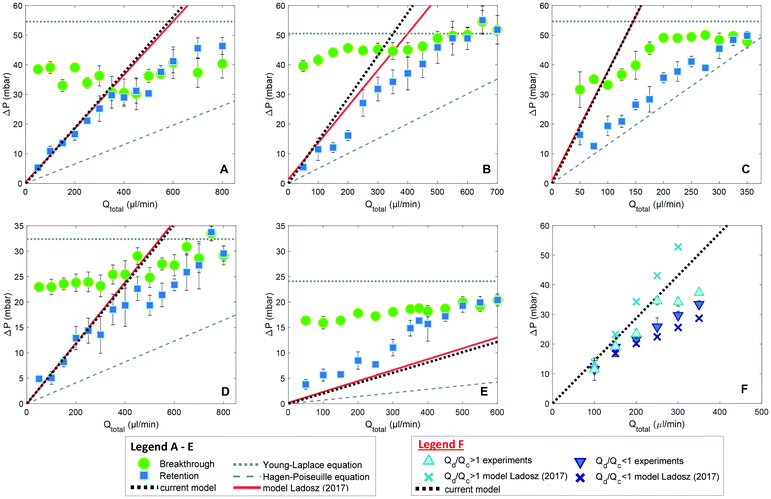 | ||
| Fig. 8 Comparison of model predictions in this work with the results of Ładosz and Rudolf von Rohr;48 A–F: flow rate ratio equal to one, five capillary geometries were tested, with capillary dimensions denoted in μm as width-length: A: 10–250; B: 10–500; C: 10–1000; D: 20–1000; E: 30–1000; F: varied flow rate ratio experiments using separator 10–500, only retention bound shown. | ||
The analytic model provides the essential connections between the retention pressure threshold, wetting phase flow rate and the design of the capillary separator, including its shape, size and number of the capillaries. Therefore, it can be used to predict not only the pressure range of a given device, but also the maximum throughput under a given pressure, as well as the minimum number of capillaries necessary to achieve complete separation under a given operating condition (Table 1).
Conclusions
In this contribution, we systematically modelled the performance of the capillary microseparator using a combination of CFD simulations and analytical methods. The OpenFOAM-based CFD model simulated the multiphase separation process at the capillary level and accurately predicted the different behaviours of the separators corresponding to the full range of pressure controls. With its high spatial and temporal resolution, the CFD model provides physical details, such as instantaneous velocity field, pressure field, and local phase distributions, which are difficult to obtain experimentally. Inspired by the observations from the CFD simulations, we developed a simple analytic expression that provided predictions of the retention pressure threshold with significantly increased accuracy. A comparison with recently published experimental data and models demonstrates the complete understanding of the mechanism of microcapillary separators.Conflicts of interest
There are no conflicts to declare.Acknowledgements
We thank Novartis-MIT Center for Continuous Manufacturing for financial support. A. L. gratefully acknowledges the Swiss National Science Foundation (SNSF) for financial support (grant number P2EZP2_175152). We thank Mr. Yi Ding for help with code compilation and graphic design.References
- R. V. Chaudhari and P. L. Mills, Chem. Eng. Sci., 2004, 59, 5337–5344 CrossRef CAS.
- M. P. Dudukovic, Ind. Eng. Chem. Res., 2007, 46, 8674–8686 CrossRef CAS.
- K. S. Elvira, X. C. I. Solvas, R. C. R. Wootton and A. J. deMello, Nat. Chem., 2013, 5, 905–915 CrossRef CAS PubMed.
- K. F. Jensen, B. J. Reizman and S. G. Newman, Lab Chip, 2014, 14, 3206–3212 RSC.
- L. Malet-Sanz and F. Susanne, J. Med. Chem., 2012, 55, 4062–4098 CrossRef CAS PubMed.
- P. L. Mills, P. A. Ramachandran and R. V. Chaudhari, Rev. Chem. Eng., 1992, 8, 1–176 CAS.
- M. Abolhasani, E. Kumacheva and A. Gunther, Ind. Eng. Chem. Res., 2015, 54, 9046–9051 CrossRef CAS.
- A. Gunther, S. A. Khan, M. Thalmann, F. Trachsel and K. F. Jensen, Lab Chip, 2004, 4, 278–286 RSC.
- R. L. Hartman, H. R. Sahoo, B. C. Yen and K. F. Jensen, Lab Chip, 2009, 9, 1843–1849 RSC.
- M. T. Kreutzer, F. Kapteijn, J. A. Moulijn and J. J. Heiszwolf, Chem. Eng. Sci., 2005, 60, 5895–5916 CrossRef CAS.
- H. Song, D. L. Chen and R. F. Ismagilov, Angew. Chem., Int. Ed., 2006, 45, 7336–7356 CrossRef CAS PubMed.
- T. Taha and Z. F. Cui, Chem. Eng. Sci., 2004, 59, 1181–1190 CrossRef CAS.
- S. Y. Teh, R. Lin, L. H. Hung and A. P. Lee, Lab Chip, 2008, 8, 198–220 RSC.
- J. M. Kohler, T. Henkel, A. Grodrian, T. Kirner, M. Roth, K. Martin and J. Metze, Chem. Eng. J., 2004, 101, 201–216 CrossRef CAS.
- B. J. Reizman and K. F. Jensen, Acc. Chem. Res., 2016, 49, 1786–1796 CrossRef CAS PubMed.
- R. L. Hartman and K. F. Jensen, Lab Chip, 2009, 9, 2495–2507 RSC.
- B. Zheng, L. S. Roach and R. F. Ismagilov, J. Am. Chem. Soc., 2003, 125, 11170–11171 CrossRef CAS PubMed.
- N. Assmann, A. Ładosz and P. Rudolf von Rohr, Chem. Eng. Technol., 2013, 36, 921–936 CrossRef CAS.
- K. Wang and G. Luo, Chem. Eng. Sci., 2017, 169, 18–33 CrossRef CAS.
- X. Z. Niu, B. Zhang, R. T. Marszalek, O. Ces, J. B. Edel, D. R. Klug and A. J. deMello, Chem. Commun., 2009, 6159–6161, 10.1039/B918100H.
- K. F. Lam, E. Sorensen and A. Gavriilidis, Chem. Eng. Res. Des., 2013, 91, 1941–1953 CrossRef CAS.
- A. Gunther, M. Jhunjhunwala, M. Thalmann, M. A. Schmidt and K. F. Jensen, Langmuir, 2005, 21, 1547–1555 CrossRef PubMed.
- D. E. Angelescu, B. Mercier, D. Siess and R. Schroeder, Anal. Chem., 2010, 82, 2412–2420 CrossRef CAS PubMed.
- N. Assmann, S. Kaiser and P. Rudolf von Rohr, J. Supercrit. Fluids, 2012, 67, 149–154 CrossRef CAS.
- N. Assmann and P. Rudolf von Rohr, Chem. Eng. Process., 2011, 50, 822–827 CrossRef CAS.
- N. Assmann, H. Werhan, A. Ładosz and P. Rudolf von Rohr, Chem. Eng. Sci., 2013, 99, 177–183 CrossRef CAS.
- O. K. Castell, C. J. Allender and D. A. Barrow, Lab Chip, 2009, 9, 388–396 RSC.
- L. Q. Ye, X. Wang, J. Han, F. Gao, L. J. Xu, Z. L. Xiao, P. M. Bai, Q. Q. Wang and B. Zhang, Anal. Chim. Acta, 2015, 863, 86–94 CrossRef CAS PubMed.
- F. Scheiff, M. Mendorf, D. Agar, N. Reis and M. Mackley, Lab Chip, 2011, 11, 1022–1029 RSC.
- J. H. Bannock, T. W. Phillips, A. M. Nightingale and J. C. deMello, Anal. Methods, 2013, 5, 4991–4998 RSC.
- H. Breisig, M. Schmidt, H. Wolff, A. Jupke and M. Wessling, Chem. Eng. J., 2017, 307, 143–149 CrossRef CAS.
- T. W. Phillips, J. H. Bannock and J. C. deMello, Lab Chip, 2015, 15, 2960–2967 RSC.
- N. A. Mortensen, F. Okkels and H. Bruus, Phys. Rev. E: Stat., Nonlinear, Soft Matter Phys., 2005, 71, 057301 CrossRef PubMed.
- M. D. Roydhouse, M. Pradas, N. Al-Rifai, B. Azizi, E. H. Cao, S. Kalliadasis and A. Gavriilidis, Chem. Eng. Sci., 2014, 114, 30–39 CrossRef CAS.
- W. A. Gaakeer, M. H. J. M. de Croon, J. van der Schaaf and J. C. Schouten, Chem. Eng. J., 2012, 207, 440–444 CrossRef.
- I. V. Gürsel, S. K. Kurt, J. Aalders, Q. Wang, T. Noël, K. D. Nigam, N. Kockmann and V. Hessel, Chem. Eng. J., 2016, 283, 855–868 CrossRef.
- D. A. Hoang, V. van Steijn, L. M. Portela, M. T. Kreutzer and C. R. Kleijn, Comput. Fluids, 2013, 86, 28–36 CrossRef.
- M. J. Nieves-Remacha, L. Yang and K. F. Jensen, Ind. Eng. Chem. Res., 2015, 54, 6649–6659 CrossRef CAS.
- M. Worner, Microfluid. Nanofluid., 2012, 12, 841–886 CrossRef.
- L. Yang, Y. X. Shi, M. Abolhasani and K. F. Jensen, Lab Chip, 2015, 15, 3232–3241 RSC.
- C. W. Hirt and B. D. Nichols, J. Comput. Phys., 1981, 39, 201–225 CrossRef.
- L. Yang, M. J. Nieves-Remacha and K. F. Jensen, Chem. Eng. Sci., 2017, 169, 106–116 CrossRef CAS.
- J. U. Brackbill, D. B. Kothe and C. Zemach, J. Comput. Phys., 1992, 100, 335–354 CrossRef CAS.
- E. Berberovic, N. P. van Hinsberg, S. Jakirlic, I. V. Roisman and C. Tropea, Phys. Rev. E: Stat., Nonlinear, Soft Matter Phys., 2009, 79, 036306 CrossRef PubMed.
- S. S. Deshpande, L. Anumolu and M. F. Trujillo, Comput. Sci. Discovery, 2012, 5, 014016 CrossRef.
- H. G. Weller, G. Tabor, H. Jasak and C. Fureby, Comput. Phys., 1998, 12, 620–631 CrossRef.
- J. Imbrogno, L. Rogers, D. A. Thomas and K. F. Jensen, Chem. Commun., 2018, 54, 70–73 RSC.
- A. Ładosz and P. Rudolf von Rohr, Microfluid. Nanofluid., 2017, 21, 153 CrossRef.
| This journal is © The Royal Society of Chemistry 2019 |


