 Open Access Article
Engineering efficient upconverting nanothermometers using Eu3+ ions†
Giacomo
Lucchini
 a,
Adolfo
Speghini
 *a,
Patrizia
Canton
 b,
Fiorenzo
Vetrone
 *cd and
Marta
Quintanilla‡
c
aNanomaterials Research Group, Dipartimento di Biotecnologie, Università di Verona and INSTM, UdR of Verona, Strada Le Grazie 15, I-37314 Verona, Italy. E-mail: adolfo.speghini@univr.it
bCentro di Microscopia Elettronica “Giovanni Stevanato”, Dipartimento di Scienze Molecolari e Nanosistemi, Università Ca' Foscari Venezia, Via Torino 155/B, Venezia-Mestre, Italy
cInstitut National de la Recherche Scientifique, Centre Énergie, Matériaux et Télécommunications (INRS – EMT), Université du Québec, 1650 Boul. Lionel-Boulet, Varennes, QC, J3X 1S2 Canada. E-mail: vetrone@emt.inrs.ca
dCentre for Self-Assembled Chemical Structures, McGill University, Montreal, QC, H3A 2K6 Canada
First published on 2nd November 2018
Abstract
Upconversion nanothermometry combines the possibility of optically sensing temperatures in very small areas, such as microfluidic channels or on microelectronic chips, with a simple detection setup in the visible spectral range and reduced heat transfer after near-infrared (NIR) excitation. We propose a ratiometric strategy based on Eu3+ ion luminescence activated through upconversion processes. Yb3+ ions act as a sensitizer in the NIR region (980 nm), and energy is transferred to Tm3+ ions that in turn excite Eu3+ ions whose luminescence is shown to be thermally sensitive. Tridoped SrF2:Yb3+,Tm3+,Eu3+ nanoparticles (average size of 17 nm) show a relative thermal sensitivity of 1.1% K−1 at 25.0 °C, in the range of the best ones reported to date for Ln3+-based nanothermometers based on upconversion emission. The present nanoparticle design allows us to exploit upconversion of lanthanide ions that otherwise cannot be directly excited upon NIR excitation and that may provide operational wavelengths with a highly stable read out to fill the spectral gaps currently existing in upconversion-based nanothermometry.
1. Introduction
The development of all-optical nanoparticle-based thermometers allows for the measurement of localized temperature with a high spatial resolution in sub-millimeter areas, which can serve as a tool for the characterization of microfluidic channels or electronic microcircuit surfaces.1–3 Particularly interesting are optical luminescent nanothermometers, that, once excited in their absorption region, exhibit a temperature-dependent emission, usually in the ultraviolet (UV), visible or near infrared (NIR) regions. Several parameters related to emission properties can serve as thermal probes, such as intensities, intensity ratios, bandwidths, luminescence lifetimes or band shifts.4–6 However, not all of them are equally advantageous when it comes to real applications. For instance, using the intensity of a single emission band can be misleading if the concentration of nanoparticles in the area under investigation is not well controlled, since it can create intensity fluctuations not related to temperature but to a different number of emitters. For this reason, it is a good option to analyze parameters that are independent of the concentration of nanoparticles, as is the case with luminescence lifetimes, bandwidths, band intensity ratios or peak shifts.3 However, from the implementation point of view, the measurement of light intensity presents the advantage of less complex optical setups than lifetime measurements and often has higher sensitivities than bandwidth or peak shift measurements. In the present investigation, a ratiometric technique was proposed to evaluate the temperature,5 where the intensity of an emission band is used as a reference for a different, separate band, to avoid the mentioned concentration-triggered uncertainty. This luminescence intensity ratio (LIR) offers a further point of reliability also by removing any inaccuracy caused by uncontrolled fluctuations of the excitation light. LIRs are often exploited for lanthanide (Ln3+)-based nanothermometers, where several thermally coupled pairs of states have already been investigated and reported in the literature.7 The emission bands of Ln3+ ions are typically narrow and well defined, and this feature permits us to restrict the range in which emission spectra need to be measured to estimate temperature values. Moreover, narrow emission bands facilitate the option of multiplexing, if more than one probe has to be used.Upconversion (UC) properties shown by several Ln3+ ions, i.e. generating photons at higher energies with respect to the excitation radiation, are due to the unique ladder-like arrangement of their 4f energy level states, coupled with the relatively long lifetimes of these levels, typically in the μs or even ms timescales.8,9 UC has interesting advantages with respect to the usual Stokes emission in the visible range. In fact, the excitation radiation can be chosen in the NIR range, where common solvents, such as water, are poorly absorbing and heat transfer to the sample from the excitation radiation is minimized. Second, UC processes are multiphoton in nature, and therefore they permit a higher spatial resolution due to the non-linear dependence of the emission on the power density of the excitation radiation. Third, since the excitation and the emission radiation are well separated in energy, the emitted radiation can be easily isolated from the excitation radiation. This avoids any interference into the detection system and therefore provides an excellent signal-to-noise ratio, which is further supported by the lack of autofluorescence from additional molecules that might be present in the environment.10
One of the most studied upconverting Ln3+-based systems for LIR nanothermometry involves Er3+ ions co-doped with Yb3+ ions, to enhance the harvesting of the excitation light in the NIR region (around 980 nm).4,7,11 However, previous studies with different materials have demonstrated that alternative Ln3+ ions, such as Dy3+ ions,12–14 Eu3+ ions15,16 or Pr3+ ions,17,18 can show better thermal sensitivities, although they are less efficiently excited through upconversion processes.19 Among these ions, Eu3+ is a particularly interesting luminescent probe in fields such as biomedicine,20 luminescent inks for anti-counterfeiting,21 and thermometry.22 However, the Eu3+ energy level structure does not permit UC emission by directly exciting with NIR radiation in the biological window (700–1200 nm), due to lack of resonant energy levels. Nonetheless, with sufficient codoping with Yb3+ ions, that are sensitizers of NIR excitation radiation at 980 nm, Eu3+ ions can show UC in the visible.23 A population of the excited states of Eu3+ ions can be obtained through a simultaneous energy transfer from two different Yb3+ ions to an Eu3+ ion, a cooperative process that has relatively low probability.24,25 On the other hand, other Ln3+ ions, for instance Tm3+, with energy levels resonant with those of Eu3+, could help in populating Eu3+ levels through energy transfer processes and therefore dramatically improve UC emission.26,27 Following these considerations, with the target of exploiting Eu3+ ion UC for nanothermometry while allowing for NIR excitation, we chose a triple doping strategy (Yb3+, Tm3+, Eu3+), implemented in water dispersible SrF2 nanoparticles in the colloidal form, which have been shown to be excellent hosts for UC luminescence and easily prepared in particle sizes as small as 15 nm.28
2. Experimental
2.1 Nanoparticle preparation
Tm3+, Yb3+ and Eu3+-tridoped SrF2 upconverting nanoparticles (UCNPs) were synthesized following a hydrothermal method.29 Briefly, SrCl2·6H2O, YbCl3·6H2O, TmCl3·6H2O and EuCl3·6H2O (Aldrich, 99.9%) were used as metal precursors (with Sr2+![[thin space (1/6-em)]](https://www.rsc.org/images/entities/char_2009.gif) :
:![[thin space (1/6-em)]](https://www.rsc.org/images/entities/char_2009.gif) Yb3+
Yb3+![[thin space (1/6-em)]](https://www.rsc.org/images/entities/char_2009.gif) :
:![[thin space (1/6-em)]](https://www.rsc.org/images/entities/char_2009.gif) Eu3+
Eu3+![[thin space (1/6-em)]](https://www.rsc.org/images/entities/char_2009.gif) :
:![[thin space (1/6-em)]](https://www.rsc.org/images/entities/char_2009.gif) Tm3+ = 0.745
Tm3+ = 0.745![[thin space (1/6-em)]](https://www.rsc.org/images/entities/char_2009.gif) :
:![[thin space (1/6-em)]](https://www.rsc.org/images/entities/char_2009.gif) 0.220
0.220![[thin space (1/6-em)]](https://www.rsc.org/images/entities/char_2009.gif) :
:![[thin space (1/6-em)]](https://www.rsc.org/images/entities/char_2009.gif) 0.030
0.030![[thin space (1/6-em)]](https://www.rsc.org/images/entities/char_2009.gif) :
:![[thin space (1/6-em)]](https://www.rsc.org/images/entities/char_2009.gif) 0.005 as the nominal molar ratio). As a reference sample, Yb3+ and Eu3+-codoped SrF2 nanoparticles (with Sr2+
0.005 as the nominal molar ratio). As a reference sample, Yb3+ and Eu3+-codoped SrF2 nanoparticles (with Sr2+![[thin space (1/6-em)]](https://www.rsc.org/images/entities/char_2009.gif) :
:![[thin space (1/6-em)]](https://www.rsc.org/images/entities/char_2009.gif) Yb3+
Yb3+![[thin space (1/6-em)]](https://www.rsc.org/images/entities/char_2009.gif) :
:![[thin space (1/6-em)]](https://www.rsc.org/images/entities/char_2009.gif) Eu3+ = 0.750
Eu3+ = 0.750![[thin space (1/6-em)]](https://www.rsc.org/images/entities/char_2009.gif) :
:![[thin space (1/6-em)]](https://www.rsc.org/images/entities/char_2009.gif) 0.220
0.220![[thin space (1/6-em)]](https://www.rsc.org/images/entities/char_2009.gif) :
:![[thin space (1/6-em)]](https://www.rsc.org/images/entities/char_2009.gif) 0.030 as the nominal molar ratio) were synthesized following the same procedure and are denoted as SrF2:Yb,Eu nanoparticles. Stoichiometric amounts of the metal chlorides (3.5 mmol of total metal ions) were dissolved in 7 mL of deionized water. This solution was then added to 25 mL of a 0.8 M sodium citrate dihydrate solution (Fluka, >99%) and 3.0 mL of a 3.5 M NH4F solution (Aldrich, 99.9%). The obtained solution was heat treated at 190 °C for 6 hours in a stainless-steel Teflon-lined digestion pressure vessel (DAB-2, Berghof). Subsequently, the UCNPs were precipitated with acetone and directly dispersed in deionized water. The colloidal dispersion is stable for at least one month.
0.030 as the nominal molar ratio) were synthesized following the same procedure and are denoted as SrF2:Yb,Eu nanoparticles. Stoichiometric amounts of the metal chlorides (3.5 mmol of total metal ions) were dissolved in 7 mL of deionized water. This solution was then added to 25 mL of a 0.8 M sodium citrate dihydrate solution (Fluka, >99%) and 3.0 mL of a 3.5 M NH4F solution (Aldrich, 99.9%). The obtained solution was heat treated at 190 °C for 6 hours in a stainless-steel Teflon-lined digestion pressure vessel (DAB-2, Berghof). Subsequently, the UCNPs were precipitated with acetone and directly dispersed in deionized water. The colloidal dispersion is stable for at least one month.
2.2 Experimental setup
TEM (HRTEM) images were obtained using a JEOL 3010 high resolution electron microscope (0.17 nm point-to-point resolution at the Scherzer defocus), operated at 300 KV, equipped with a Gatan slow-scan CCD camera (model 794) and an Oxford Instruments EDS microanalysis detector (Model 6636). The powder was dispersed in water in order to be deposited on holey-carbon copper grids.
3. Results and discussion
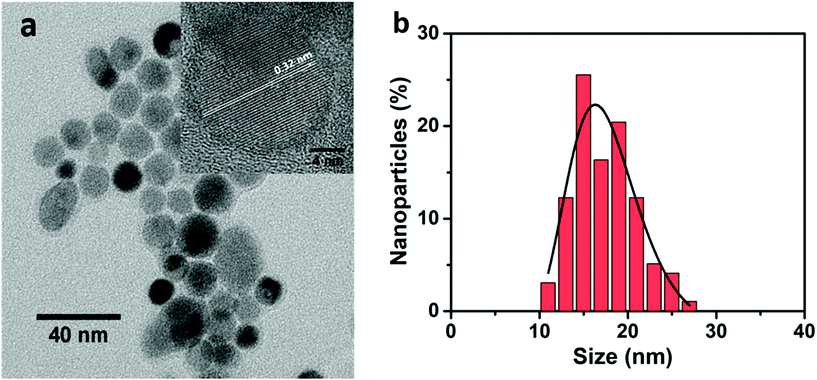
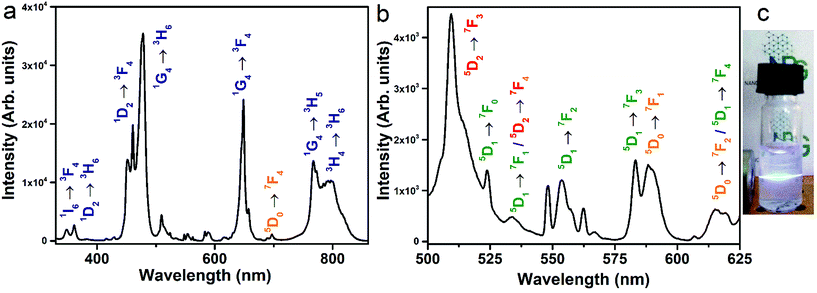
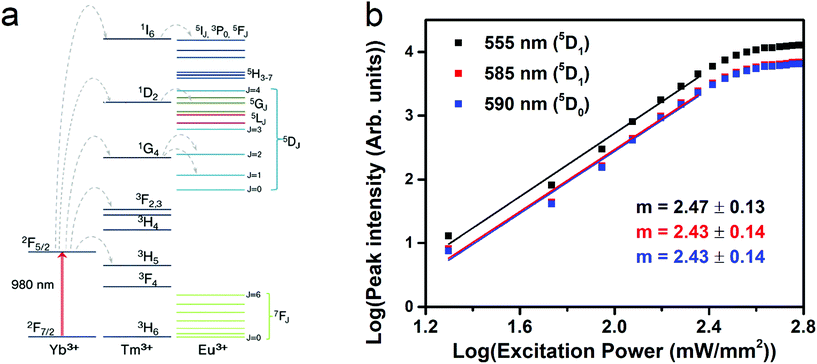
The X-ray diffraction pattern (shown in Fig. S1, ESI†) shows that the prepared UCNPs have a cubic fluorite phase, as reported for similar nanoparticles.28 EDX measurements clearly indicate the presence of Yb3+ and Eu3+, while Tm3+ ions are present at a concentration below the limit of detection of the EDX setup (Fig. S2, ESI†). Nonetheless, the presence of Tm3+ ions is clearly demonstrated by the strong UC emission (see below). A representative TEM micrograph of the UCNPs is shown in Fig. 1a, presenting a nice dispersion and average particle size of 16 nm (see Fig. 1b).Upon laser excitation at 980 nm, a large number of emission bands in the near UV, blue and red optical regions are observed for the SrF2:Yb3+,Tm3+,Eu3+ UCNPs28,30–32 as shown in Fig. 2. After 980 nm laser excitation, several Tm3+ excited states can be populated following energy transfer processes from Yb3+ to Tm3+ ions, as described by grey dashed arrows in Fig. 3a. Several emission bands are thus related to transitions from different Tm3+ excited states either to the ground state (3H6) or to lower lying excited states (see blue labels in Fig. 2).
In addition, a group of less intense bands in the 400–440 nm and 500–630 nm regions are nicely observed, as shown in Fig. 2b and S3 (ESI†), typical of emission of Eu3+ ions, which constitutes clear evidence of the population of the excited energy levels of Eu3+ ions through upconversion processes. The transition assignments for the observed bands have been carried out considering the spectroscopic investigation of Jouart et al.33 and Cortelletti et al.39 for Eu3+ centres in SrF2 using site-selective excitation techniques.
In principle, an Yb3+ → Eu3+ cooperative upconversion process could be present.23,34–36 Nonetheless, the SrF2:Yb,Eu NPs, prepared as a reference, without Tm3+ ions, do not show any Eu3+ upconversion emission upon 980 nm laser excitation under the same experimental conditions (see Fig. S4, ESI†). Therefore, the Eu3+ upconversion emission found for the tridoped SrF2:Yb3+,Tm3+,Eu3+ NPs clearly indicates that a Tm3+ → Eu3+ energy transfer is involved and it is active once the excited levels of Tm3+ ions have been populated by the Yb3+ → Tm3+ upconversion. The population of Eu3+ energy levels by means of excited Tm3+ ions is already reported in the literature.37,38 From an inspection of the energy levels of the Tm3+ ions, energy transfer processes responsible for the Eu3+ energy level population are sketched in Fig. 3. It is interesting to note that the Eu3+ emission bands shown in the upconversion spectra (see Fig. 2b) have very different relative intensities than those observed in Stokes Eu3+ emission spectra of SrF2:Eu3+ nanoparticles upon direct excitation of the Eu3+ excited energy levels, as reported by Cortelletti et al.39 This different behavior can be explained considering the different pathways populating the Eu3+ excited levels, which in the present case are fed through Tm3+ → Eu3+ energy transfer processes. A similar Tm3+ to Eu3+ energy transfer process has also been observed for tridoped Eu,Tm,Yb lithium lanthanide phosphate nanoparticles, after excitation at 975 nm with a diode laser.27
Some weak emission bands observed in the blue region around 415 and 430 nm correspond to emissions from the 5D3 level of the Eu3+ ions, indicating that an energy transfer process from the 1D2 level of Tm3+ to the 5D4, 5GJ or 5LJ levels of Eu3+ is present. A contribution to the population of the Eu3+ excited levels could be in principle also due to an energy transfer process from the 1I6 level of Tm3+, as emission from this level is observed in the UC spectrum (see Fig. 2). Nonetheless, it is reasonable to consider this contribution as much less relevant with respect to those due to energy transfer starting from the lower lying 1D2 and 1G4 excited energy levels of Tm3+ ions. This behavior is due to the much lower population of the 1I6 level with respect to the other two levels, evidenced by the very low relative intensity of the 1I6 → 3F4 band (see Fig. 2a). Moreover, the energy of the 1G4 level of Tm3+ ions is slightly higher than that of the 5D1 level of Eu3+ ions; thus a Tm3+(1G4) → Eu3+(5D1) energy transfer process is reasonably present, with possible phonon emission. A Tm3+(1G4) → Eu3+(5D2) energy transfer process can also be possible considering that the Tm3+(1G4) and Eu3+(5D2) levels are almost resonant, with small phonon absorption assistance.
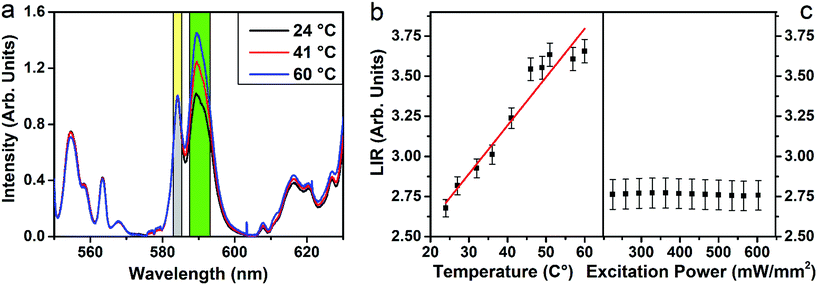
The upconversion mechanisms described in Fig. 3a, therefore, play a fundamental role in populating the Eu3+ energy levels. In order to investigate the power dependence of the Eu3+ upconverted luminescence, UC spectra were measured as a function of the 980 nm laser power density (between 20 and 500 mW mm−2), and they are shown in Fig. 3b. The peak intensities for the different transitions follow a log–log behavior for laser powers up to ∼190 mW mm−2, and then a saturation behavior is observed. The slopes, denoted as m, associated with each transition were evaluated in the linear regime, as they are related to the number of photons involved in the upconversion process. The m values are much higher than 2, indicating that a three-photon process is present and therefore suggesting that the population of the Eu3+ energy levels is mainly from energy transfer from the 1G4 level of Tm3+ ions. We point out that the Eu3+ upconversion is observable with our experimental setup for laser powers (at 980 nm) as low as 20 mW mm−2 (2 W cm−2), a value that is comparable with those employed to generate upconversion for similar water-dispersible nanoparticles.40 It is important to note that as transitions starting from 5D2, 5D1 and 5D0 energy levels of Eu3+ show the same power dependency, any intensity ratio between emissions originating from these levels is independent of the excitation power, a paramount property for a reliable luminescence thermometric system. The non-radiative relaxation probability of the 5DJ (J = 0, 1, 2) levels is in principle different, due to the different energy gaps between each level and the next lying one,28,41 and therefore the relative intensities of the emission bands could vary on changing the temperature. In addition, the energy transfer mechanisms from 1G4 (Tm3+) to the 5D1 (Eu3+) is non-resonant (see Fig. 3) and thus, dependent on the phonon density of states. The UC spectra of the SrF2:Yb3+,Tm3+,Eu3+ UCNPs were measured as a function of temperature in the 20–60 °C range. Representative examples are shown in Fig. 4a, from which it can be noted that the Eu3+ emission bands in the 580–600 nm range show a notable relative variation on changing the temperature. We define the LIR as
 | (1) |
 | (2) |
The Sr values as a function of temperature are shown in Fig. S5† and are determined to be between 0.8 and 1.1% K−1 in the 20–60 °C temperature range, with a percentage error of 5%. These values are among the highest reported in the literature for upconverting nanothermometers, as reported in Table 1.7 The performance of a thermometer is also characterized by another important parameter, that is the minimum temperature uncertainty, ΔTmin, which determines the accuracy of the temperature measurements that can be achieved under the working conditions of the thermometer,4 defined as
 | (3) |
| Host | Dopants | Average particle size (nm) | Excitation wavelength (nm) | Emission range (nm) | S r@25 °C (% K−1) | Ref. |
|---|---|---|---|---|---|---|
| ZnO | Er3+ | 80 | 978 | 535–555 | 0.5 | 44 |
| NaYF4 | Er3+, Yb3+ | 6000 | 980 | 530–555 | 1.2 | 45 |
| NaY(WO4)2 | Er3+, Yb3+ | 3000 | 980 | 530–550 | 1.0 | 46 |
| LiNbO3 | Er3+, Yb3+ | 100 | 980 | 525–550 | 0.7 | 47 |
| CaF2 | Er3+, Yb3+ | 11 | 920 | 522–538 | 1.9 | 42 |
| GdVO4 | Er3+, Yb3+ | 3.9 | 980 | 525–555 | 1.1 | 48 |
| LiLaP4O12 | Eu3+, Tm3+, Yb3+ | 40 | 975 | 450–700 | 0.34 | 27 |
| SrF2 | Eu3+, Tm3+, Yb3+ | 17 | 980 | 585–590 | 1.1 | This work |
This value is consistent with those found for similar upconverting thermometers.42 In order to better understand the physical mechanism governing the behavior of the upconversion emission as a function of temperature, the SrF2:Yb3+,Tm3+,Eu3+ UCNPs were dispersed in D2O as the solvent, at a concentration of 1 wt%, similar to the one used for experiments with H2O as the solvent. These dispersions turned out to be colloidally stable for some weeks (see Fig. S6†). It is worth mentioning that the vibrational energy cutoff for the D2O molecule is 2500 cm−1, a value that is much less than that for the H2O molecule (highest vibrational energy around 3600 cm−1)43
For this reason, multiphonon relaxation processes for lanthanide ions are much more probable if they are close to H2O molecules than for D2O ones, as the higher the vibrational energy is, the larger is the multiphonon relaxation probability of the Ln3+ excited level. We show in Fig. 5a the comparison between upconversion spectra of the SrF2:Yb3+,Tm3+,Eu3+ UCNPs using H2O and D2O as dispersing solvents, while using identical experimental conditions with respect to the geometrical setup and in particular the same power density of the laser excitation radiation. From Fig. 5a, it can be noted that in the case of D2O dispersions, the Eu3+ upconversion bands corresponding to transitions starting from the 5D1 level are more intense than for those starting from the 5D0 one. The upconversion spectra for D2O dispersions as a function of temperature (20–60 °C) do not change notably on increasing the temperature (see Fig. S7†), suggesting that the populations of the 5D0 and 5D1 levels of the Eu3+ ions do not change significantly with the temperature, at least in the investigated range. The LIR for the D2O dispersed UCNPs shows an almost constant value (around 1.0), within the experimental uncertainties, on increasing the temperature (Fig. 5b). Such a behavior indicates that the relaxation channel for the 5D1 level is much more effective in H2O dispersions than in D2O ones. This behavior is clear evidence that a significant number of Ln3+ ions lie on the nanoparticle surface, close to the solvent molecules, as their emission properties are much influenced by the solvent vibrational energies, inducing non-radiative multiphonon relaxation channels. The depopulation of the 5D1 energy level of Eu3+ is much more influenced by multiphonon relaxations than that of the 5D0 one, due to a much lower energy gap with the lower lying energy level (5D1–5D0, energy gap around 1800 cm−1; 5D0–7F6, energy gap around 12![[thin space (1/6-em)]](https://www.rsc.org/images/entities/char_2009.gif) 000 cm−1). Therefore, the multiphonon relaxation probability for the 5D1 level is almost constant in the relatively small investigated temperature range for D2O dispersions, while it is increased for H2O dispersions, due to the much higher vibrational energy of H2O with respect to D2O.
000 cm−1). Therefore, the multiphonon relaxation probability for the 5D1 level is almost constant in the relatively small investigated temperature range for D2O dispersions, while it is increased for H2O dispersions, due to the much higher vibrational energy of H2O with respect to D2O.
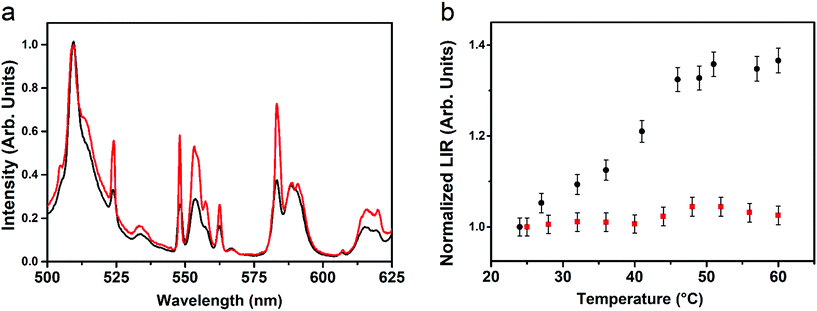 | ||
| Fig. 5 (a) Eu3+ upconversion for SrF2:Yb3+,Tm3+,Eu3+ UCNPs dispersed in H2O (black line) and in D2O (red line). (b) LIR for H2O (black squares) and D2O (red solid circles)-dispersed UCNPs. | ||
The obtained thermometric values for the SrF2:Yb3+,Tm3+,Eu3+ UCNPs demonstrate that the strategy applied to excite the Eu3+ ions offers good opportunities for thermometry in three aspects. First, a careful selection of Ln3+ dopants allows us to engineer a mechanism that exploits upconversion to excite Eu3+ ions. Second, the different upconversion paths used to excite several Eu3+ states allow the definition of a luminescence intensity ratio that remains unaffected during measurements, also for variations of the laser excitation power. Finally, the thermal sensitivity of such an intensity ratio is on par with the best upconverting nanothermometers reported to date.
4. Conclusions
In the present study, we investigated colloidal upconverting nanothermometers based on Yb3+, Tm3+ and Eu3+ ions that exploit the matching of the Tm3+ ion energy levels with the ones of Eu3+ ions. This property permits us to transfer the absorbed energy by the antenna Yb3+ ions to the final probe, Eu3+ ions. The developed nanothermometer shows a very good relative sensitivity, around 1% K−1 in the 20–60 °C range, among the highest values shown by the most popular lanthanide-based nanothermometers. Moreover, the relative sensitivity is independent of intensity fluctuations of the excitation radiation owing to the characteristics of the designed upconversion process. Very importantly, this excitation strategy constitutes a new way of engineering upconversion-based nanothermometers that exploit new ions and that are able to operate at different wavelengths.Conflicts of interest
There are no conflicts to declare.Acknowledgements
University of Verona (Italy) is gratefully acknowledged for financial support in the framework of the “Ricerca di base 2015” project. F. V. is grateful for financial support from the Natural Sciences and Engineering Research Council (NSERC) of Canada and the Fonds de recherche du Québec – Nature et technologies (FRQNT). P. Canton is grateful for financial support from Ca’ Foscari University of Venice ADIR-2016.Notes and references
- L. Aigouy, G. Tessier, M. Mortier and B. Charlot, Appl. Phys. Lett., 2005, 87, 184105 CrossRef.
- A. Benayas, B. del Rosal, A. Pérez-Delgado, K. Santacruz-Gómez, D. Jaque, G. A. Hirata and F. Vetrone, Adv. Opt. Mater., 2015, 3, 687–694 CrossRef CAS.
- B. del Rosal, E. Ximendes, U. Rocha and D. Jaque, Adv. Opt. Mater., 2017, 5, 1600508 CrossRef.
- D. Jaque and F. Vetrone, Nanoscale, 2012, 4, 4301–4326 RSC.
- C. D. S. Brites, P. P. Lima, N. J. O. Silva, A. Millán, V. S. Amaral, F. Palacio and L. D. Carlos, Nanoscale, 2012, 4, 4799–4829 RSC.
- X. Wang, O. S. Wolfbeis and R. J. Meier, Chem. Soc. Rev., 2013, 42, 7834–7869 RSC.
- M. González-Béjar and J. Pérez-Prieto, Methods Appl. Fluoresc., 2015, 3, 42002 CrossRef PubMed.
- F. Auzel, Chem. Rev., 2004, 104, 139–173 CrossRef CAS PubMed.
- J.-C. G. Bünzli and S. V Eliseeva, Chem. Sci., 2013, 4, 1939–1949 RSC.
- L. Y. Ang, M. E. Lim, L. C. Ong and Y. Zhang, Nanomedicine, 2011, 6, 1273–1288 CrossRef PubMed.
- A. Sedlmeier, D. E. Achatz, L. F. Fischer, H. H. Gorris and O. S. Wolfbeis, Nanoscale, 2012, 4, 7090–7096 RSC.
- Z. Boruc, M. Kaczkan, B. Fetlinski, S. Turczynski and M. Malinowski, Opt. Lett., 2012, 37, 5214 CrossRef CAS PubMed.
- Z. Cao, S. Zhou, G. Jiang, Y. Chen, C. Duan and M. Yin, Curr. Appl. Phys., 2014, 14, 1067–1071 CrossRef.
- M. G. Nikolić, D. J. Jovanović and M. D. Dramićanin, Appl. Opt., 2013, 52, 1716 CrossRef PubMed.
- J. Rocha, C. D. S. Brites and L. D. Carlos, Chem.–Eur. J., 2016, 22, 14782–14795 CrossRef CAS PubMed.
- C. D. S. Brites, P. P. Lima, N. J. O. Silva, A. Millán, V. S. Amaral, F. Palacio and L. D. Carlos, J. Lumin., 2013, 133, 230–232 CrossRef CAS.
- Y. Gao, F. Huang, H. Lin, J. Zhou, J. Xu and Y. Wang, Adv. Funct. Mater., 2016, 26, 3139–3145 CrossRef CAS.
- W. Tang, S. Wang, Z. Li, Y. Sun, L. Zheng, R. Zhang, B. Yang, W. Cao and M. Yu, Appl. Phys. Lett., 2016, 108, 61902 CrossRef.
- V. K. Rai, Appl. Phys. B, 2007, 88, 297–303 CrossRef CAS.
- S. S. Syamchand and G. Sony, J. Lumin., 2015, 165, 190–215 CrossRef CAS.
- J. Andres, R. D. Hersch, J. E. Moser and A. S. Chauvin, Adv. Funct. Mater., 2014, 24, 5029–5036 CrossRef CAS.
- S. H. Zheng, W. B. Chen, D. Z. Tan, J. J. Zhou, Q. B. Guo, W. Jiang, C. Xu, X. F. Liu and J. R. Qiu, Nanoscale, 2014, 6, 5675–5679 RSC.
- R. Martín-Rodríguez, R. Valiente, S. Polizzi, M. Bettinelli, A. Speghini and F. Piccinelli, J. Phys. Chem. C, 2009, 113, 12195–12200 CrossRef.
- V. Jubera, A. Garcia, J. P. Chaminade, F. Guillen, J. Sablayrolles and C. Fouassier, J. Lumin., 2007, 124, 10–14 CrossRef CAS.
- W. Strek, P. J. Deren, A. Bednarkiewicz, Y. Kalisky and P. Boulanger, J. Alloys Compd., 2000, 300, 180–183 CrossRef.
- G. H. Dieke, Spectra and Energy Levels of Rare-earth Ions in Crystals, Wiley, New York, 1968 Search PubMed.
- L. Marciniak, A. Bednarkiewicz and W. Strek, J. Lumin., 2017, 184, 179–184 CrossRef CAS.
- M. Quintanilla, I. X. Cantarelli, M. Pedroni, A. Speghini and F. Vetrone, J. Mater. Chem. C, 2015, 3, 3108–3113 RSC.
- M. Pedroni, F. Piccinelli, T. Passuello, S. Polizzi, J. Ueda, P. Haro-Gonzalez, L. M. Maestro, D. Jaque, J. Garcia-Sole, M. Bettinelli and A. Speghini, Cryst. Growth Des., 2013, 13, 4906–4913 CrossRef CAS.
- F. W. Ostermayer, J. P. Van der Ziel, H. M. Marcos, L. G. Van Uitert and J. E. Geusic, Phys. Rev. B, 1971, 3, 2698 CrossRef.
- M. Quintanilla, N. Nuñez, E. Cantelar, M. Ocaña and F. Cusso, Nanoscale, 2011, 3, 1046–1052 RSC.
- R. A. Hewes and J. F. Sarver, Phys. Rev. B: Condens. Matter Mater. Phys., 1969, 182, 427–436 CrossRef CAS.
- J. P. Jouart, C. Bissieux, G. Mary and M. Egee, J. Phys. C Solid State Phys., 1985, 18, 1539 CrossRef CAS.
- Y. Li, J. Guo, X. Liu, T. Aidilibike and W. Qin, Phys. Chem. Chem. Phys., 2016, 18, 16094–16097 RSC.
- H. S. Wang, C. K. Duan and P. a Tanner, J. Phys. Chem. C, 2008, 112, 16651–16654 CrossRef CAS.
- G. S. Maciel, A. Biswas and P. N. Prasad, Opt. Commun., 2000, 178, 65–69 CrossRef CAS.
- L. Wang, X. Xie, F. Shi, D. Zhao, D. Zhang, K. Zheng, G. Wang, C. He, R. Kim and W. Qin, Opt. Lett., 2009, 34, 2781–2783 CrossRef CAS PubMed.
- H. Lin, D. Q. Chen, Y. L. Yu, A. P. Yang, R. Zhang and Y. S. Wang, Mater. Res. Bull., 2012, 47, 469–472 CrossRef CAS.
- P. Cortelletti, M. Pedroni, F. Boschi, S. Pin, P. Ghigna, P. Canton, F. Vetrone and A. Speghini, Cryst. Growth Des., 2018, 18, 686–694 CrossRef CAS.
- M. Pedroni, F. Piccinelli, T. Passuello, S. Polizzi, J. Ueda, P. Haro-Gonzalez, L. M. Maestro, D. Jaque, J. Garcia-Sole, M. Bettinelli and A. Speghini, Cryst. Growth Des., 2013, 13, 4906–4913 CrossRef CAS.
- S. Tanabe, S. Yoshii, K. Hirao and N. Soga, Phys. Rev. B, 1992, 45, 4620–4625 CrossRef CAS.
- N. N. Dong, M. Pedroni, F. Piccinelli, G. Conti, A. Sbarbati, J. E. Ramírez-Hernández, L. M. Maestro, M. C. Iglesias-De La Cruz, F. Sanz-Rodriguez, A. Juarranz, F. Chen, F. Vetrone, J. A. Capobianco, J. G. Solé, M. Bettinelli, D. Jaque and A. Speghini, ACS Nano, 2011, 5, 8665–8671 CrossRef CAS PubMed.
- S. E. Lappi, B. Smith and S. Franzen, Spectrochim. Acta, Part A, 2004, 60, 2611–2619 CrossRef PubMed.
- D. M. Blake, P. C. Maness, Z. Huang, E. J. Wolfrum, J. Huang and W. A. Jacoby, Sep. Purif. Methods, 1999, 28, 1–50 CrossRef CAS.
- S. Zhou, K. Deng, X. Wei, G. Jiang, C. Duan, Y. Chen and M. Yin, Opt. Commun., 2013, 291, 138–142 CrossRef CAS.
- H. Zheng, B. Chen, H. Yu, J. Zhang, J. Sun, X. Li, M. Sun, B. Tian, S. Fu, H. Zhong, B. Dong, R. Hua and H. Xia, J. Colloid Interface Sci., 2014, 420, 27–34 CrossRef CAS PubMed.
- M. Quintanilla, E. Cantelar, F. Cusso, M. Villegas and A. C. Caballero, Appl. Phys. Express, 2011, 4, 22601 CrossRef.
- T. V. Gavrilović, D. J. Jovanović, V. Lojpur and M. D. Dramićanin, Sci. Rep., 2014, 4, 1–9 Search PubMed.
Footnotes |
| † Electronic supplementary information (ESI) available. See DOI: 10.1039/c8na00118a |
| ‡ Current Address: BioNanoPlasmonics Laboratory, CIC biomaGUNE, Paseo de Miramón 182, 20014 Donostia – San Sebastián (Spain). |
| This journal is © The Royal Society of Chemistry 2019 |

