 Open Access Article
The fabrication of a 3D current collector with bitter melon-like TiO2–NCNFs for highly stable lithium–sulfur batteries†
Xuzi
Zhang
a,
Zhihong
Chen
 b,
Lingling
Shui
 a,
Chaoqun
Shang
*a,
Xin
Wang
 *ac and
Guofu
Zhou
ac
aNational Center for International Research on Green Optoelectronics, South China Normal University, Guangzhou, China. E-mail: chaoqun.shang@ecs-scnu.org; wangxin@scnu.edu.cn
bShenyang Institute of Automation, Guangzhou, Chinese Academy of Sciences, Guangzhou, China
cInternational Academy of Optoelectronics at Zhaoqing, South China Normal University, Guangdong, China
First published on 5th November 2018
Abstract
The conductive 3D freestanding N-doped carbon nanofibers (NCNFs) current collector was embedded with homogeneously polar TiO2 nanoparticles. This current collector used for the sulfur cathode exhibits strong chemical adsorption for hindering the shuttle effect of polysulfides, and demonstrates a high specific capacity of 865 mA h g−1 at 0.2C and excellent cycle performance (200 cycles with capacity retention of 91%).
High-capacity and long cycling-life energy storage devices have received considerable attention because of the fast development of electronic vehicles and the popularization of portable devices. Lithium–sulfur (Li–S) batteries are believed to be the next-generation energy storage devices owing to their high energy density (2600 W h kg−1) and high theoretical capacity (1675 mA h g−1).1 In addition, they possess many advantages, such as low cost, non-toxicity and safety.2 However, there still exist unsolved barriers for their ultimate practical application.3 These barriers could be divided into two main categories: (i) the negative effects derived from the formation of the insoluble and insulated S and Li2S/Li2S2 will result in poor reaction kinetics and large volume change, which will destroy the cathode structure; (ii) the shuttle effect of soluble lithium polysulfides (Li2Sn, n = 4, 6, 8) will cause the loss of active materials, low specific capacity and coulombic efficiency, and corrosion of lithium anode.4
In recent years, different approaches have been attempted to resolve the abovementioned issues with great progress. The introduction of various types of carbon matrixes to modify the S cathode can be considered as an appropriate method because of carbon's high electrical conductivity, light weight, low cost, and favorable mechanical properties.5 Carbonaceous materials with different morphologies, such as nanocapsules,6–8 nanofibers,9–11 nanosheets12–14 and other 3D composite materials,15–21 can not only improve the conductivity of S, but also retard the volume change during lithiation and delithiation.22,23 Nevertheless, most of them possess physical confinement, which cannot efficiently suppress the shuttle effect. Combining the carbon matrixes with polar materials (e.g., Fe2O3,24,25 La2O3,26,27 and MnO2 (ref. 28 and 29)) has been demonstrated as an effective strategy to suppress shuttle effect by the strong chemical bonding between Li2Sn and polar materials.
Titanium dioxide (TiO2), as a polar material, is efficient to capture Li2Sn with high adsorption energy.30 However, the undesirable conductivity of TiO2 restricts further transformation of the adsorbed Li2Sn, which hinders the electrochemical performance of Li–S batteries.31 In this study, we encapsulated TiO2 nanoparticles in 1D carbon nanofibers (denoted as TiO2–NCNFs) to construct a bitter melon-like long-range conductive current collector for Li–S batteries. The polar TiO2 nanoparticles were employed to immobilize the soluble Li2Sn by strong chemical interactions. Moreover, the 3D N-doped CNFs network provided a continuous long-range electron pathway and more active sites, ensuring fast transformation of adsorbed Li2Sn. Taking advantage of the 3D freestanding TiO2–NCNFs current collector, the Li–S batteries could deliver a specific capacity of 865 mA h g−1 at 0.2C with a capacity retention of 91%, which was maintained over 200 cycles.
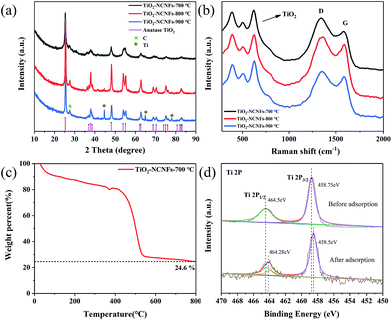
Electrospinning is an expedient method to construct 3D freestanding network structures with excellent stability and flexibility.32 The TiO2–NCNFs were obtained by the one-step carbonization of as-electrospun nanofibers at 700 °C in Ar for 2 h. The peaks in XRD patterns (Fig. 1a) indicate the composition and crystallinity of TiO2–NCNFs at different calcination temperatures compared with those of anatase TiO2 (JCPDS no. 21-1272); also, a weak amorphous carbon peak is visible at 27.6°. TiO2 comes from the decomposition of titanium butoxide (TBOT) with a trace of water in DMF. The diffraction peaks of CNF/TiO2 become sharper and stronger with the increase in the pyrolysis temperature, demonstrating the enhanced crystallinity. It should be noted that a certain amount of Ti is formed at 900 °C by carbon reduction. Raman spectra (Fig. 1b) show distinct peaks of carbon band (D band, 1350 cm−1 and G band, 1580 cm−1) and three characteristic peaks (386 cm−1, 503 cm−1 and 618 cm−1) of TiO2. The ID/IG of TiO2–NCNFs-700 °C is 1.116, which is higher than that of TiO2–NCNFs-800 °C (ID/IG = 1.069) and TiO2–NCNFs-900 °C (ID/IG = 1.066), demonstrating that the increased calcination temperature enhances the graphitization degree of carbon. TG analysis in Fig. 1c indicates that the content of TiO2 in TiO2–NCNFs-700 °C is 24.6%. The weight losses are attributed to the evaporation of traces of water and oxidation of carbon at the elevated pyrolysis temperature in air.
 | ||
| Fig. 1 XRD (a) and Raman (b) of TiO2–NCNFs spectra at different pyrolysis temperatures. (c) TG of TiO2–NCNFs-700 °C. (d) XPS spectra of Ti 2p before and after capturing Li2S6. | ||
To evaluate the chemical state and binding energy of TiO2–NCNFs, X-ray photoelectron spectroscopy (XPS) was performed, as shown in Fig. 1d and S1.† Fig. S1a† shows the survey spectra of TiO2–NCNFs-700 °C with four peaks located at about 285 eV (C 1s, Fig. S1b†), 399 eV (N 1s, Fig. S1c†), 458 eV (Ti 2p, Fig. 1d) and 530 eV (O 1s, Fig. S1d†). The Ti 2p spectrum in Fig. 1d contains two main peaks that are assigned to Ti 2p1/2 and Ti 2p3/2 of Ti–O bond of anatase TiO2. Test for confirmation of the chemical adsorption of Li2S6 on TiO2 was also conducted. After adsorption, the peak at 464.28 eV, ascribed to the Ti–S bond, can be clearly observed, with a 0.22 eV shift to lower binding energy, which demonstrates that TiO2 serves as an effective capture site for Li2S6 to improve the electrochemical performance of Li–S batteries. The presence of the element N in TiO2–NCNFs is also confirmed by the strong N 1s signals (Fig. S1c†) with four peaks at 398.3 eV, 399 eV, 400 eV and 400.9 eV, attributed to the pyridinic-N, pyrrolic-N, graphitic-N and N–O, respectively. Moreover, the S 2p spectrum (Fig. S2a and e†) is composed of two peaks at 163.5 eV (carbon–sulfur bond) and 168.6 eV (sulfate species) after immobilizing Li2S6.
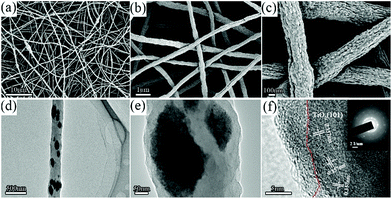
After pyrolysis, bitter melon-like TiO2–NCNFs were generated from the decomposition and carbonization of PAN. The surface of synthetic nanofibers is very rough and uninterrupted and possesses many bulges with diameter of 300 nm, resembling bitter lemons, as shown in Fig. 2a–c with different magnifications. The rough surface can afford high contact area for TiO2 to adsorb Li2Sn, further restraining the shuttling effect. Moreover, the long-range interlacing continuous CNFs provide fast conductive pathways for electron transfer to accelerate the transformation. Furthermore, the freestanding network structure and the crumpled surface can accommodate large volume variation of S species during cycling. The surface was further characterized by TEM (Fig. 2d–f). The amorphous carbon layer improves the conductivity of insulated anatase TiO2. The diameter of these nanoparticles is measured to be 50–200 nm. The high-resolution TEM (HRTEM) in Fig. 2f indicates the interplanar spacing of 0.357 nm, which is assigned to (101) plane of anatase TiO2. The EDS mapping (Fig. S3†) shows the uniform distribution of C, N and O elements. Large TiO2 nanoparticles as well as TiO2 with few nanometers are embedded in the CNFs. The TiO2 nanoparticles serve as anchoring sites for adsorbing Li2Sn. Furthermore, the N-doped CNFs can also act as polarity sites to facilitate the capture of Li2Sn on the surface of carbon nanofibers for the formation of LiSnLi+⋯N binding. N atoms can induce the charge redistribution in graphite carbon to enhance the polarity of carbon atoms around the N atom.33–35 The SAED diagram (inset of Fig. 2f) depicts several diffraction rings, which indicate the polycrystalline structure of anatase TiO2.
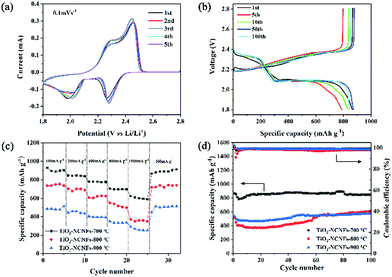
The TiO2–NCNFs composite was directly employed as a freestanding current collector for Li–S batteries without aluminum foil or conductive adhesive. Cyclic voltammetry (CV) curves were recorded and illustrated in Fig. 3a after activation, which show two distinct reduction peaks at 2.26 V and 1.98 V. These peaks are ascribed to the reduction of solid S8 to soluble Li2Sn and insoluble Li2S2/Li2S, respectively. Moreover, the main strong oxidation peak at 2.46 V has been detected in the anodic scan, which appeared as a result of oxidation of Li2S2/Li2S to Li2Sn until the complete formation of elemental S. After several cycles, no significant shift occurs, implying excellent reversibility and favorable Li2Sn adsorption performance of TiO2–NCNFs. Without activation, the CV curve in Fig. S4† shows a significant shift in the two reduction peaks to higher voltage in the first three cycles, indicating the existence of the activation process of active material diffusion to the entire TiO2–NCNFs 3D network. As shown in Fig. 3b, galvanostatic charge/discharge curves of the TiO2–NCNFs with different cycles at 0.2C display an initial discharge capacity of 865 mA h g−1 with an outstanding cycling stability for 200 cycles. Two discharge plateaus are observed at 2.37 V and 2.1 V, which is in accordance with the results of the CV test. The two plateaus at 2.37 V and 2.1 V, displayed in the first discharge curve, appear in the next 200 cycles, indicating the high transformation reversibility between elemental S and Li2S2/Li2S. Furthermore, the rate capabilities of TiO2–NCNFs prepared under different pyrolysis temperatures were investigated under different constant current density from 100 to 1500 mA g−1 (Fig. 3c). TiO2–NCNFs-700 °C exhibits a capacity of 945 mA h g−1 (100 mA g−1), which then remains at 850 mA h g−1 (200 mA g−1), 780 mA h g−1 (400 mA g−1), 705 mA h g−1 (800 mA g−1) and 620 mA h g−1 (1500 mA g−1), and recovers to 931 mA h g−1 at 100 mA g−1, indicating excellent electrochemical reversibility. Cycling performance of TiO2–NCNFs prepared under different pyrolysis temperatures is presented in Fig. 3d, where TiO2–NCNFs-700 °C shows excellent cycling stability for 100 cycles. Compared with TiO2–NCNFs-800 °C and TiO2–NCNFs-900 °C, TiO2–NCNFs-700 °C exhibits the best rate capability and cycling performance, which may be attributed to the unique 1D structure with relatively weak crystallinity. TiO2 generated at low pyrolysis temperature offers more active sites for adsorption of Li2Sn and fast electron transfer for transformation of Li2Sn due to the numerous disordered crystal planes of TiO2.
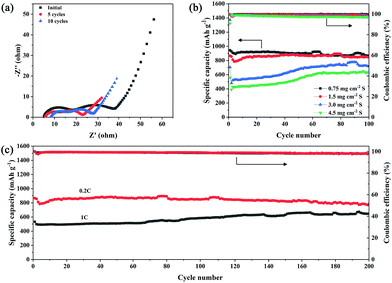
To further verify the electrochemical kinetics of TiO2–NCNFs-700 °C in Li–S batteries, electrochemical impedance spectroscopy (EIS) was performed, as shown in Fig. 4a and S5.† These Nyquist plots are all composed of two distinct semicircles in the medium–high frequency region and a straight line in the low frequency region. These two semicircles are attributed to the interface charge-transfer process, derived from the formation of insoluble and insulating Li2S layer (high frequencies), and faradic charge-transfer resistance (Rct) and double-layer capacitance (medium frequencies). The inclined line is related to the diffusion process within the cathode (Warburg resistance, W).36–38 Clearly, the Rct of TiO2–NCNFs-700 °C after activation is about 36 Ω, which is much smaller than that of pristine TiO2 (365 Ω) (Fig. S5†) because of the diffusion of active materials to the entire current collector. After cycling, the Rct of TiO2–NCNFs-700 °C (Fig. 4a) remains nearly the same, indicating the homogeneous distribution of S species on the surface of 3D TiO2–NCNFs-700 °C ensured by the outstanding adsorption performance of TiO2.
Long cycling performance of Li–S batteries with TiO2–NCNFs current collector is displayed in Fig. 4c. After 200 cycles at 0.2C with S loading of 1.5 mg cm−2, the capacity remains 786 mA h g−1 with a low decay rate of 0.045% per cycle. Even at a high rate of 1C, the capacity remains 645 mA h g−1 after 200 cycles. To demonstrate the excellent stability of Li–S batteries using TiO2–NCNFs current collector, a comparison of different titanium and carbon composites is presented in Table S1 in ESI.† To further verify the cyclic performance of TiO2–NCNFs current collector with different areal sulfur loading (Fig. 4b), long cycling-life tests were conducted at a current density of 0.2C for 100 cycles. With the increase in sulfur loading, the activation process is much more evident in the first several dozens of cycles, representing the gradually increasing capacity. The capacity remains 718 mA h g−1 (3.0 mg cm−2) and 638 mA h g−1 (4.5 mg cm−2) in the end of the 100th cycle. It should be noted that the capacity contribution of the TiO2–NCNFs current collector is negligible (Fig. S6†). Another key aspect to consider when evaluating the performance of Li–S batteries is the electrolyte/sulfur (E/S) ratio, which is basically determined by the concentration of the catholyte. In this study, the E/S ratios are about 17.3 mL g−1, 8.6 mL g−1 and 5.8 mL g−1, with sulfur loading of 1.5 mg cm−2, 3 mg cm−2 and 4.5 mg cm−2, respectively.39,40 SEM was conducted to further investigate the integrity of TiO2–NCNFs-700 °C current collector after cycling. As shown in Fig. S7,† the cycled TiO2–NCNFs-700 °C current collector maintains its original morphology without collapsing. The corresponding EDS mapping demonstrates that TiO2–NCNFs-700 °C is covered with homogenous S distribution and no sulfur agglomeration, implying excellent adsorption of TiO2–NCNFs for Li2Sn during cycling.
Conclusions
In summary, bitter melon-like 3D TiO2–NCNFs current collector for Li–S batteries has been rationally designed and successfully synthesized. The TiO2 nanoparticles work as chemical adsorption sites for Li2Sn. In addition, the 3D network can not only bare the volume change during cycling, but also serves as conductive host to improve the conductivity of TiO2 and S for fast electron transfer. Benefitting from the unique structure, the Li–S batteries with TiO2–NCNFs-700 °C current collector deliver stable cycling performance and high rate capacity. Furthermore, with high S loading of 4.5 mg cm−2, these batteries can reach a high specific capacity of 718 mA g−1. These results indicate that the TiO2–NCNFs-700 °C is a promising 3D current collector for Li–S batteries.Conflicts of interest
There are no conflicts to declare.Acknowledgements
The authors acknowledge the financial support from the National Natural Science Foundation of China Program (No. 51602111), Cultivation project of National Engineering Technology Center (2017B090903008), Xijiang R&D Team (X. W.), Guangdong Provincial Grant (2015A030310196, 2017A050506009), Special Fund Project of Science and Technology Application in Guangdong (2017B020240002) and 111 project.Notes and references
- J. Liang, Z.-H. Sun, F. Li and H.-M. Cheng, Energy Storage Mater., 2016, 2, 76–106 CrossRef.
- H.-J. Peng, J.-Q. Huang, X.-B. Cheng and Q. Zhang, Adv. Energy Mater., 2017, 7, 1700260 CrossRef.
- Y. An, Z. Zhang, H. Fei, S. Xiong, B. Ji and J. Feng, ACS Appl. Mater. Interfaces, 2017, 9, 12400–12407 CrossRef CAS PubMed.
- G. Liang, J. Wu, X. Qin, M. Liu, Q. Li, Y. B. He, J. K. Kim, B. Li and F. Kang, ACS Appl. Mater. Interfaces, 2016, 8, 23105–23113 CrossRef CAS PubMed.
- Z. L. Xu, J. K. Kim and K. Kang, Nano Today, 2018, 19, 84–107 CrossRef CAS.
- Z. Li, J. T. Zhang, B. Y. Guan, D. Wang, L. M. Liu and X. W. Lou, Nat. Commun., 2016, 7, 11 Search PubMed.
- B. B. Wang, Y. Xia, G. Wang, Y. X. Zhou and H. Wang, Chem. Eng. J., 2017, 309, 417–425 CrossRef CAS.
- W. J. Lu, M. X. Liu, L. Miao, D. Z. Zhu, X. Wang, H. Duan, Z. W. Wang, L. C. Li, Z. J. Xu, L. H. Gan and L. W. Chen, Electrochim. Acta, 2016, 205, 132–141 CrossRef CAS.
- F. Zhou, Z. Li, X. Luo, T. Wu, B. Jiang, L. L. Lu, H. B. Yao, M. Antonietti and S. H. Yu, Nano Lett., 2018, 18, 1035–1043 CrossRef CAS PubMed.
- Y. Zhu, X. Fan, L. Suo, C. Luo, T. Gao and C. Wang, ACS Nano, 2016, 10, 1529–1538 CrossRef CAS PubMed.
- J. H. Yun, J. H. Kim, D. K. Kim and H. W. Lee, Nano Lett., 2018, 18, 475–481 CrossRef CAS PubMed.
- X. Liang, A. Garsuch and L. F. Nazar, Angew. Chem., Int. Ed., 2015, 54, 3907–3911 CrossRef CAS PubMed.
- Q. Pang, D. Kundu and L. F. Nazar, Mater. Horiz., 2016, 3, 130–136 RSC.
- Q. Pang and L. F. Nazar, ACS Nano, 2016, 10, 4111–4118 CrossRef CAS PubMed.
- X. Chen, L. Yuan, Z. Hao, X. Liu, J. Xiang, Z. Zhang, Y. Huang and J. Xie, ACS Appl. Mater. Interfaces, 2018, 10, 13406–13412 CrossRef CAS PubMed.
- Z. Li, J. Zhang, B. Y. Guan and X. W. D. Lou, Angew. Chem., Int. Ed., 2017, 56, 16003–16007 CrossRef CAS PubMed.
- X. Liang, Y. Rangom, C. Y. Kwok, Q. Pang and L. F. Nazar, Adv. Mater., 2017, 29, 1603040 CrossRef PubMed.
- S. Feng, J. Song, S. Fu, C. Zhu, Q. Shi, M.-K. Song, D. Du and Y. Lin, J. Mater. Chem. A, 2017, 5, 23737–23743 RSC.
- S. Jin, S. Xin, L. Wang, Z. Du, L. Cao, J. Chen, X. Kong, M. Gong, J. Lu, Y. Zhu, H. Ji and R. S. Ruoff, Adv. Mater., 2016, 28, 9094–9102 CrossRef CAS PubMed.
- X. L. Du, Y. You, Y. Yan, D. Zhang, H. P. Cong, H. Qin, C. Zhang, F. F. Cao, K. C. Jiang, Y. Wang, S. Xin and J. B. He, ACS Appl. Mater. Interfaces, 2016, 8, 22261–22269 CrossRef CAS PubMed.
- Z. H. Chen, X. L. Du, J. B. He, F. Li, Y. Wang, Y. L. Li, B. Li and S. Xin, ACS Appl. Mater. Interfaces, 2017, 9, 33855–33862 CrossRef CAS PubMed.
- Z. Li, J. T. Zhang, Y. M. Chen, J. Li and X. W. Lou, Nat. Commun., 2015, 6, 8850 CrossRef CAS PubMed.
- K. Xie, K. Zhang, Y. Han, K. Yuan, Q. Song, J.-g. Wang, C. Shen, X. Liu and B. Wei, Electrochim. Acta, 2016, 210, 415–421 CrossRef CAS.
- C. Zheng, S. Niu, W. Lv, G. Zhou, J. Li, S. Fan, Y. Deng, Z. Pan, B. Li, F. Kang and Q.-H. Yang, Nano Energy, 2017, 33, 306–312 CrossRef CAS.
- C. Zhao, C. Shen, F. Xin, Z. Sun and W. Han, Mater. Lett., 2014, 137, 52–55 CrossRef CAS.
- F. Sun, J. Wang, D. Long, W. Qiao, L. Ling, C. Lv and R. Cai, J. Mater. Chem. A, 2013, 1, 13283–13289 RSC.
- X. Qian, D. Zhao, L. Jin, X. Shen, S. Yao, D. Rao, Y. Zhou and X. m. Xi, Mater. Res. Bull., 2017, 94, 104–112 CrossRef CAS.
- L. Ni, G. Zhao, G. Yang, G. Niu, M. Chen and G. Diao, ACS Appl. Mater. Interfaces, 2017, 9, 34793–34803 CrossRef CAS PubMed.
- Z. Liu, B. Liu, P. Guo, X. Shang, M. Lv, D. Liu and D. He, Electrochim. Acta, 2018, 269, 180–187 CrossRef CAS.
- T. Zhou, W. Lv, J. Li, G. Zhou, Y. Zhao, S. Fan, B. Liu, B. Li, F. Kang and Q.-H. Yang, Energy Environ. Sci., 2017, 10, 1694–1703 RSC.
- Z. Zhang, Q. Li, S. Jiang, K. Zhang, Y. Lai and J. Li, Chem.–Eur. J., 2015, 21, 1343–1349 CrossRef CAS PubMed.
- Y. Dai, W. Liu, E. Formo, Y. Sun and Y. Xia, Polym. Adv. Technol., 2011, 22, 326–338 CrossRef CAS.
- S. S. Zhang, Inorg. Chem. Front., 2015, 2, 1059–1069 RSC.
- J. Song, M. L. Gordin, T. Xu, S. Chen, Z. Yu, H. Sohn, J. Lu, Y. Ren, Y. Duan and D. Wang, Angew. Chem., Int. Ed., 2015, 54, 4325–4329 CrossRef CAS PubMed.
- T. Z. Hou, W. T. Xu, X. Chen, H. J. Peng, J. Q. Huang and Q. Zhang, Angew. Chem., Int. Ed., 2017, 56, 8178–8182 CrossRef CAS PubMed.
- N. A. Cañas, K. Hirose, B. Pascucci, N. Wagner, K. A. Friedrich and R. Hiesgen, Electrochim. Acta, 2013, 97, 42–51 CrossRef.
- X. Y. Zhao, J. P. Tu, Y. Lu, J. B. Cai, Y. J. Zhang, X. L. Wang and C. D. Gu, Electrochim. Acta, 2013, 113, 256–262 CrossRef CAS.
- C. Shang, L. Cao, M. Yang, Z. Wang, M. Li, G. Zhou, X. Wang and Z. Lu, Energy Storage Mater., 2018 DOI:10.1016/j.ensm.2018.1008.1013.
- Z. Z. Pan, W. Lv, Y. B. He, Y. Zhao, G. Zhou, L. Dong, S. Niu, C. Zhang, R. Lyu, C. Wang, H. Shi, W. Zhang, F. Kang, H. Nishihara and Q. H. Yang, Adv. Sci., 2018, 5, 1800384 CrossRef PubMed.
- S. H. Chung and A. Manthiram, Adv. Mater., 2018, 30, 1705951 CrossRef PubMed.
Footnote |
| † Electronic supplementary information (ESI) available. See DOI: 10.1039/c8na00160j |
| This journal is © The Royal Society of Chemistry 2019 |


