 Open Access Article
Preparation of isolated Co3O4 and fcc-Co crystallites in the nanometre range employing exfoliated graphite as novel support material†
Moritz
Wolf‡
 ,
Nico
Fischer
 and
Michael
Claeys
*
Catalysis Institute, DST-NRF Centre of Excellence in Catalysis c*change, Department of Chemical Engineering, University of Cape Town, Rondebosch 7701, South Africa. E-mail: michael.claeys@uct.ac.za
First published on 10th June 2019
Abstract
The inert nature of graphitic samples allows for characterisation of rather isolated supported nanoparticles in model catalysts, as long as sufficiently large inter-particle distances are obtained. However, the low surface area of graphite and the little interaction with nanoparticles result in a challenging application of conventional preparation routes in practice. In the present study, a set of graphitic carbon materials was characterised in order to identify potential support materials for the preparation of model catalyst systems. Various sizes of well-defined Co3O4 nanoparticles were synthesised separately and supported onto exfoliated graphite powder, that is graphite after solvent-assisted exfoliation via ultrasonication resulting in thinner flakes with increased specific surface area. The stability of the supported nanoparticles during reduction to metallic cobalt in H2 was monitored in situ by means of X-ray diffraction and smaller crystallite sizes were found to be harder to reduce than their larger counterparts. A low cobalt loading of 1 wt% was required to avoid aggregates in the parent catalyst, and this allowed for the preparation of supported cobalt nanoparticles which were resistant to sintering at reduction temperatures below 370 °C. The developed model catalysts are ideally suited for sintering studies of isolated nano-sized cobalt particles as the graphitic support material does not provide distinct metal–support interaction. Furthermore, the differently sized cobaltous particles in the various model systems render possible studies on structural dependencies of activity, selectivity, and deactivation in cobalt oxide or cobalt catalysed reactions.
1 Introduction
Traditional support materials have mostly been regarded as inert, but more recently even common metal oxide carriers have been shown to exhibit a strong effect on the catalytic behaviour1–4 and on the stability of the active phase specifically in the case of nano-sized material.5–9 These supports typically anchor the nanoparticles via metal–support interactions sometimes even forming mixed phases.10–14 On the one hand, such an interaction is desired as it increases the stability of the nanoparticles under reaction conditions, e.g. against sintering, on the other hand it is typically associated with a loss in active phase. Pristine carbon does not exhibit such stabilising properties, but may be functionalised with oxygen or nitrogen containing groups.15–17 However, even functionalised carbon shows a relative high chemical inertness except for the exposure to O2 at increased temperatures which results in combustion.17 Carbon supports are seldom applied in industry17,18 due to their lower mechanical strength compared to Al2O3 or SiO2 supports.18 However, their inert character makes carbon supports the carrier of choice for fundamental studies on the behaviour and stability of relatively isolated nanoparticles.19–22Graphitic carbon materials comprise multiple layers of sp2-hybridised carbon atoms in two-dimensional planes. The atoms are arranged in the classic honeycomb like structure of graphene and the single layers are typically separated by 3.41 Å and stacked in an ABAB order.23 The amount of stacked layers can be decreased via exfoliation techniques allowing the preparation of few-layer graphite or even graphene, a single two-dimensional plane of carbon atoms.24 The exfoliation of layered structures requires the overcoming of the weak van der Waals attractions between adjacent layers,23 which may be achieved for graphitic materials via immersion in solvents featuring a surface tension of approximately 40 mJ m−2. Dispersion of graphitic material in such solvents results in a reduced interaction of adjacent layers.23,25 Exfoliation of immersed graphite may then be achieved by applying shearing forces via ball-milling26 or ultrasonication.27–29 The latter technique may yield up to 4 wt% of graphene.28 However, pure few-layer graphite with up to 28% single-layer graphene may be achieved when applying a size-selective centrifugation.27 A second, chemical approach decreases the van der Waals forces by expanding the distance between the layers allowing for simplified exfoliation. The chemical conversion of graphite to graphene via the preparation of intercalated graphite oxide according to a modification of Hummers' method30 with subsequent exfoliation into graphene oxide31 and reduction to graphene (commonly referred to as reduced graphene oxide rGO)32 is one of the most widely applied methods due to its low cost in combination with considerable yields of the desired product.24,33,34 However, rGO differs strongly from pristine graphene obtained from aforementioned syntheses. The harsh oxidising and reducing conditions during the synthesis of rGO introduce considerable amounts of defects such as hydroxyl and epoxy groups on sp3-hybridised carbon on the basal plane disrupting its electronic properties.24,33 Defective sites originate from the incomplete reduction of oxidised tetrahedral sp3 to planar sp2 carbon atoms.33 However, modification of the synthesis may allow for the preparation of rGO with decreased concentrations of residual functional groups.35 Aside from mechanical exfoliation of graphitic precursors with the aid of suitable solvents or via intercalation of small molecules, a variety of chemical vapour deposition (CVD) techniques such as thermal CVD, plasma enhanced CVD, or a thermal decomposition on substrates are applied for the synthesis of graphene.17,24
The performance of carbon as catalyst or support material is determined by the surface chemistry of the carbon material.15 Functionalisation of carbon describes the introduction of functional groups such as carboxylic acids or carbonates on the carbon surface,15 which allow for an electronic interaction with nanoparticles, e.g. in heterogeneous catalysts. The interaction is more pronounced than for the pristine, clean surface and hence a higher stability against sintering, but also a lower reducibility, can be expected. Functionalisation techniques targeting the introduction of oxygen containing groups include acidic treatments in nitric, sulfuric, and/or phosphoric acid, as well as oxidative treatments with air, oxygen, nitrous oxide, potassium permanganate, or hydrogen peroxide.15,36–39 Functionalisation can also represent an artefact of the preparation of the carbon material, for example, aforementioned rGO contains various functional groups on the edges and the planar surfaces due to the harsh conditions applied during oxidation to graphitic oxide and reduction after exfoliation.24,33 In the present study pristine graphite is exfoliated and applied as novel support material in order to prepare rather isolated Co3O4 and, upon reduction in H2, metallic Co crystallites. The developed model system may allow for the characterisation of the physicochemical properties of isolated crystallites. For example, the stability of the crystallites may be analysed under conditions applied in catalytic processes with a minimised effect of the support material.
2 Experimental
2.1 Chemicals
Acetone, aqueous ammonia solution (25 wt%), and ethanol were purchased from Kimix (South Africa). Benzyl alcohol, cobalt(II) acetate tetrahydrate, synthetic graphite powder, and 1-methyl-2-pyrrolidone were obtained from Sigma-Aldrich. Kaylaw graphite powder is a chemically pure carbon material and was supplied by Electrochem (South Africa).2.2 Exfoliation of graphite
Kaylaw graphite powder was exfoliated to increase its surface area.27 1-Methyl-2-pyrrolidinone (NMP) facilitates the exfoliation process as its surface energy is very close to the one of graphite.28 An amount of 3300 mg graphite powder was sonicated in 1 L NMP for 12 h.28 The obtained suspension was centrifuged at 500 rpm for 45 min to separate non-exfoliated and larger flakes of graphite.27 The exfoliated graphite (EG) in the remaining supernatant was collected via centrifugation at 7000 rpm for 2 h, subsequently washed several times with acetone, and dried at 80 °C in an oven.2.3 Synthesis of Co3O4 nanoparticles
Co3O4 nanoparticles were synthesised via a surfactant-free, non-aqueous heat treatment of dissolved cobalt acetate in benzyl alcohol in the presence of ammonium hydroxide.9,14,22,40,41 Cobalt(II) acetate tetrahydrate was dissolved in benzyl alcohol under magnetic stirring at 500 rpm in a round bottom flask (Table 1). After 2 h of stirring, a 25 wt% aqueous ammonium hydroxide solution was added dropwise to the pink to purple solution forming a brown emulsion. Once the addition of ammonium hydroxide was completed, the flask including the stirrer bar was immediately transferred to a preheated oil bath of a rotary evaporation set-up and heated for a total of 3 h at 165 °C. Air was bubbled through the reaction emulsion making use of the reduced pressure in the rotary flask (900 mbar) in order to ensure adequate mixing of the reaction emulsion.9,41| Sample | Benzyl alcohol/mL | Co(C2H3O2)2·4H2O/mg | NH4OHaq (25 wt%)/mL |
|---|---|---|---|
| Co_2.8 | 140 | 800 | 35 |
| Co_3.5 | 140 | 400 | 35 |
| Co_4.9 | 70 | 1600 | 70 |
| Co_7.6 | 140 | 3200 | 140 |
After cooling-down to room temperature, the volume was tripled with diethyl ether and the mixture was centrifuged for 1 hour at 7000 rpm. The centrifugate containing the nanoparticles was re-dispersed in ethanol and washed at least three times with acetone until a clear supernatant was obtained.40,41
2.4 Supporting of nanoparticles
Co3O4 crystallites were dispersed in ethanol in an ultrasonic bath until all nanoparticles were in dispersion (>4 h). Exfoliated graphite was sonicated for 4 h in ethanol after which the dispersion of Co3O4 nanoparticles in ethanol was added dropwise targeting the desired loading of metallic Co. After sonicating for another 4 h, the dispersion was transferred to a rotary evaporator and further mixed for 1 h at 240 rpm and 80 °C. Subsequently, ethanol was evaporated from the parent sample at 462 mbar and the sample was dried at 80 °C.9,14,222.5 Characterisation
Samples were analysed via transmission electron microscopy (TEM) in a Tecnai F20 microscope (Philips) equipped with a field emission gun and operated at 200 kV (Gatan). Images were collected with a US4000 4k × 4k CCD camera (Gatan). Nanoparticles were dispersed in ethanol via ultrasonication for 30 min prior to deposition onto carbon-coated copper grids. In contrast, supported nanoparticles were mixed with acetone and dispersed in the ultrasonication bath for 1 min (parent samples) or 3 min (reduced samples) in order to prevent separation of the nanoparticles and the support. Number-based size distributions were determined by measuring the size of over 500 nanoparticles using the open-source ImageJ 1.51a software package.42 The distribution of the nanoparticles was converted to a volume-based size distribution to allow for comparison with volume-based techniques such as X-ray diffraction (XRD). The number mean sizes (dn,TEM), the volume-mean sizes (dV,TEM), and the relative volume-based standard deviations (σV,TEM) were calculated based on the measured sizes di (eqn (1)–(3)). | (1) |
 | (2) |
 | (3) |
Analysis of samples via Raman spectroscopy was conducted in an inVia Raman microscope (Renishaw) with a wavelength of the laser of 532 nm. The Raman laser was fitted with a compact fibre optics probe (Renishaw). Five repetitions were taken at 40 mW laser power and an exposure time of 30 s. The intensity ratio of the D and G band of graphitic samples allows for an estimation of the average in-plane crystallite size of the graphene layers (eqn (4)).43
 | (4) |
The surface areas of graphitic samples were analysed via physisorption according to the Brunauer–Emmett–Teller (BET) method. Physisorption was conducted using a TriStar II 3020 (Micromeritics) with N2 as analysis adsorptive and a degassing temperature of 200 °C.
Thermogravimetric analysis (TGA) of graphitic support material was conducted in a SDT 650 DSC/TGA simultaneous thermal analyser (TA Instruments). An amount of 8 to 12 mg of material was loaded into a 90 μL alumina crucible and heated from 50 to 900 °C at 5 °C min−1 in N2 to decompose functional groups associated with the surface of carbon. The measured weight loss then corresponds to such functional groups.15,44 In another analysis to determine the Co loading, the temperature was ramped from 120 to 900 °C at 10 °C min−1 with a final holding time at 900 °C of 60 min in air. The residual mass corresponds to CoO being the stable cobalt oxide at 900 °C,45 which allows for the calculation of the Co loading.
Conventional XRD was conducted at 35 kV and 40 mA in a D8 Advance X-ray diffractometer (Bruker AXS), equipped with a cobalt source (λKα1 = 0.178897 nm; slit width = 1.0 mm) and a LYNXEYE XE position sensitive detector (Bruker AXS) from 20–120° at a step size of 0.025° with an exposure time of 1 s per step. XRD analysis was also conducted at the crystallography beamline I711 of the MAX II synchrotron46 (MAX IV Laboratory, Lund, Sweden) with a wavelength of 0.9941 Å and a slit width of 0.8 mm (see ESI and Fig. S.1 for experimental set-up†). Obtained XRD patterns were compared to reference patterns of the Powder Diffraction File of the International Centre for Diffraction Data (ICDD; PDF-2 Release 2008;47 Co3O4: 00-043-1003, cubic CoO: 01-071-1178, fcc-Co: 00-015-0806, hcp-Co: 01-071-4239, graphite: 03-065-6212). Volume-mean crystallite sizes and weight fractions of the particular phases were determined by Rietveld refinement of the XRD patterns (TOPAS 5, Bruker AXS).48 The instrumental line broadening was modelled via fitting the pattern of corundum. Diffraction line broadening analysis via the Scherrer equation49 (Co3O4: 311 diffraction) with correction for the instrumental line broadening and a shape factor of 0.9 was applied as a secondary technique to estimate the crystallite size of the as prepared nanoparticles via XRD.50
2.6 In situ X-ray diffraction (XRD)
The used sample presentation device for in situ XRD was developed at the University of Cape Town51,52 and comprises an infra-red heater and a quartz capillary (outer diameter 1.0 mm, wall thickness 0.01 mm, length 75 mm; Hilgenberg GmbH), which is mounted on the sample stage via rubber ferrules and screwing caps. A K-type thermocouple detects the temperature directly in the isothermal zone of the 1.5 cm long catalyst bed in the capillary resembling a fixed-bed reactor.52 A Kapton polyimide film (DuPont) is assembled as a cover, which improves temperature control and greatly extends the axial isothermal zone. The catalyst bed is held in place by glass wool plugs.The cell was applied in in situ XRD reduction studies on a Bruker D8 Advance equipped with a Co source (λKα1 = 1.78897 Å). The device can be easily attached to the goniometer of the commercial X-ray diffractometer. The selected step size within the 2Θ-window of choice was 0.062° with an exposure time of 0.8 s. In addition, the cell was mounted to the experimental table of beamline I711 (Fig. 1) of the MAX II synchrotron46 (MAX IV Laboratory, Lund, Sweden). A wavelength of 0.9941 Å and a slit width of 0.8 mm were applied for in situ reduction studies with a high energy beam.
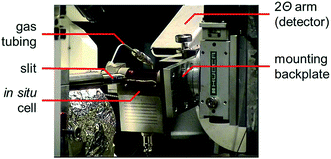 | ||
| Fig. 1 Photograph of the in situ sample presentation device mounted on the experimental table of beamline I711 of the MAX II synchrotron. | ||
Exfoliated graphite as the support material of choice was modelled using Rietveld refinement with three separate graphite structures in a modified partial or not known crystal structure (PONKCS) approach (see ESI and Fig. S.2–S.6 for detailed description†).53 The thermal expansion of graphitic samples perpendicular to the basal plane54,55 was included applying a fitted linear dependency of the c lattice parameter with the temperature (eqn (S.1)–(S.6)†).
In a typical in situ XRD study, 2–5 mg of the supported parent catalyst were loaded into the quartz capillary. The temperature was ramped in pure H2 from 50 °C to a selected holding temperature at a heating rate of 1 °C min−1. A space velocity of 10 mL min−1 mgcatalyst−1 was applied in all experiments. XRD patterns were obtained every 5 min during the ramp and every 5–20 min during a holding time. After the reduction, the screwing caps are slowly loosened to allow for diffusion of air into the capillary, which can be expected to passivate the catalysts within minutes.56
The obtained in situ XRD patterns were analysed with the help of a MATLAB (The Mathworks Inc.)57 algorithm.58 It allows for the automated analysis of all XRD patterns of one experiment by means of Rietveld refinement using the TOPAS kernel. Aside from classical XRD parameters, the output further provides the refined patterns und the single patterns of the particular structures. The algorithm was modified to a small extent in order to accommodate the developed PONKCS approach for the EG support.
3 Results and discussion
3.1 Characterisation of exfoliated graphite
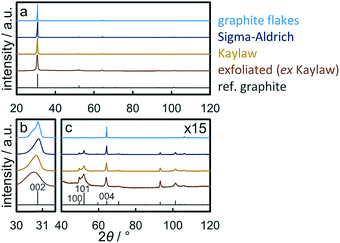
X-ray diffraction (XRD) patterns of graphite samples are dominated by the diffraction of the (002) plane at 30.9° (λCo,Kα1 = 1.78897 Å; Fig. 2a). This becomes even more pronounced for thick samples with an extended length perpendicular to the basal plane,59i.e. with high stacking numbers such as natural graphite flakes. The shape of the (002) reflection depends on the thickness of the graphite sample. Thinner graphite samples result in a broader peak with a maximum at lower diffraction angles due to the increased contribution of intercalated planes on top/bottom of graphitic flakes.59,60 XRD analysis of natural graphite flakes exhibits this dependency as the (002) reflection is bimodal indicating a wide range of stacking numbers (Fig. 2b). Application of the Scherrer equation49 on the (002) diffraction line allows for an estimation of the average number of layers.33,60 In the present study, this method was extended to Rietveld refinement of the patterns from 28–33° applying two separate graphite structures in order to obtain a range of the number of layers based on the calculated crystallite sizes (Table 2). As expected, size analysis of synthetic graphite powder (Sigma-Aldrich) and natural graphite flakes results in the former having less layers. Kaylaw graphite powder, a chemically pure carbon additive for lubricants, shows the broadest (002) reflection. Another indicator for the thickness of a graphite sample is the ratio of the reflection intensity of the interplanar distances (002) or (004) and the intraplanar (100) plane, which increases with the stacking number. This can be demonstrated by a comparison of the ratios for natural graphite flakes and commercially synthesised graphite powder (Table 2; Fig. 2c). The trend in the ratios is inversely proportional to the BET surface area (Fig. S.7†), which can be expected to increase with lower stacking numbers.| Sample | Intensity ratio | FWHM (002)/° | Approx. layersa | BET surface area/m2 g−1 | |
|---|---|---|---|---|---|
| (002)/(100) | (004)/(100) | ||||
| a Estimation of the average number of layers from the crystallite size obtained via Rietveld refinement of the (002) reflection with two graphite structures. | |||||
| Natural graphite flakes | 3225.2 | 144.7 | 0.254 | 270–664 | 1.0 ± 0.1 |
| Graphite powder (Sigma-Aldrich) | 136.3 | 4.8 | 0.331 | 136–400 | 8.1 ± 0.1 |
| Kaylaw graphite powder | 76.0 | 2.7 | 0.414 | 107–207 | 25.8 ± 0.1 |
| Exfoliated graphite (ex Kaylaw) | 22.1 | 1.0 | 0.658 | 58–100 | 47.8 ± 0.2 |
Exfoliation of Kaylaw graphite powder via ultrasonication in NMP27,28 and size selection via centrifugation29 almost doubled the surface area of the graphite phase (Fig. S.7†) while decreasing the calculated average range in the number of layers accordingly by approximately 50% (Table 2). However, the yield upon ultrasonication in fresh, anhydrous NMP and size-selective separation of the fraction of thicker graphite via centrifugation is only 5 wt% and decreases with the number of recycling steps of the valuable solvent NMP, presumably due to contamination with water from the ambient atmosphere.28 Analysis of exfoliated graphite (EG) by means of XRD showed decreased ratios of the interplanar reflections relative to the intraplanar reflections confirming a decreased thickness upon exfoliation. Less than 100 layers were estimated from the analysis of the (002) diffraction (Table 2). The actual stacking number may be even lower due to partial re-stacking of thinner few-layer graphite (Fig. S.8†) during the drying procedure,24 which is also indicated by the shift to lower diffraction angles due to an increased d-spacing of imperfect stackings.
Raman spectra of carbon materials show only few prominent features. However, Raman spectroscopy has become the standard for characterisation and analysis in carbon research.61 The G band (G for graphite) at approximately 1560 cm−1 for visual excitation is typically assigned to the bond stretching of all pairs of sp2-hybridised carbon atoms in rings or chains and is therefore associated to the graphitic structure of pristine graphite powder.61–63 The breathing modes of sp2 atoms in carbon hexagons result in the D band (D for disorder or defect) at 1360 cm−1,61–64 which is not observed in the centre of a graphite sheets, yet on the edge.65 In regard to carbon as catalyst support, the D band generally represents the functionalisation of the carbon carrier due to induced defects. The Raman spectra of Kaylaw graphite powder before and after exfoliation display similar features (Fig. 3). The ratio of the intensities of the D band over the G band (ID/IG) is inversely proportional to the in-plane crystallite size (La)43,64,66 and increases from 0.18 to 0.29, i.e. exfoliation induces a higher defect concentration as more carbon atoms are associated to the edge for a smaller in-plane dimension.64 An estimation of the in-plane crystallite size with the intensity ratio of both prominent bands according to Cançado et al.43 (eqn (4)) results in 106.8 nm for pristine Kaylaw graphite powder and 66.3 nm after exfoliation. No significant differences can be identified in the 2D band at approximately 2710 cm−1,65 formerly referred to as G′ band.67 The broad peak of said band indicates a 1![[thin space (1/6-em)]](https://www.rsc.org/images/entities/char_2009.gif) :
:![[thin space (1/6-em)]](https://www.rsc.org/images/entities/char_2009.gif) 1 intensity ratio of the 2D1 and 2D2 band suggesting relatively thin graphite flakes,61 which is supported by XRD analysis (Table 2).
1 intensity ratio of the 2D1 and 2D2 band suggesting relatively thin graphite flakes,61 which is supported by XRD analysis (Table 2).
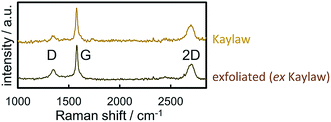 | ||
| Fig. 3 Raman spectra of pristine and exfoliated Kaylaw graphite powder displaying carbon characteristic bands. | ||
Characterisation of EG and the parent Kaylaw graphite powder under an inert N2 atmosphere by means of TGA (Fig. S.9a†) strongly supports the conclusions drawn from the analysis of Raman spectra. The weight loss during exposure to increased temperatures can be assigned to the decomposition of particular functional groups on the surface of carbon materials.15,44,68 When normalised to the available surface area as determined via BET analysis, EG and Kaylaw graphite powder show comparably low concentrations of functional groups (Fig. S.9a†). No more functional groups decompose on the graphitic samples at temperatures exceeding 500 °C. The low degree of functionalisation (weight loss: 0.06% (m2 g−1)−1) can be demonstrated when compared to the normalised weight loss of solid carbon spheres,69 which is more than 5 times the loss of Kaylaw graphite powder at 500 °C. In addition, significant amounts of functional groups and/or amorphous carbon are converted at increased temperatures. The weight loss due to decomposition of functional groups, when normalised to the BET surface area, is also lower than reported for as-grown multiwalled carbon nanotubes (CNTs; 0.11% (m2 g−1)−1).68 The weight fraction in said material has been demonstrated to increase to approximately 0.22% (m2 g−1)−1 by applying an acidic treatment in HNO3.68 In the present study, TGA was also applied to verify the chemical purity of Kaylaw graphite powder and resulted in a full conversion upon oxidation in air at 900 °C (Fig. S.9b†).
3.2 Characterisation of Co3O4 nanoparticles
Four distinct sizes of monodisperse Co3O4 crystallites were synthesised via the benzyl alcohol-route.9,40,41 TEM analysis reveals the high dispersibility of the nanoparticles which are nicely spread out over the grid (Fig. 4a–d). All four sizes show narrow size distributions (Fig. 4e) with relative standard deviations ranging from 16 to 29% (Table S.1†). Analysis by means of XRD confirmed the successful preparation of single-phase Co3O4 nanoparticles of high crystallinity (Fig. 4f). All diffractions can be assigned to a Co3O4 reference pattern, while no other phases may be detected. Comparison of the width of the diffractions (e.g. the most prominent (311) diffraction at 43°) indicates significant differences in crystallite size. Indeed, Rietveld refinement results in volume-mean crystallite sizes of 2.8, 3.5, 4.9, and 7.6 nm (denoted Co_2.8, Co_3.5, Co_4.9, and Co_7.6, respectively), which were confirmed via application of the Scherrer equation49 and TEM analysis (Table S.1†).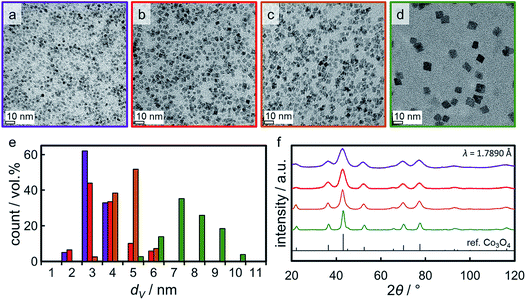 | ||
| Fig. 4 (a–d) Transmission electron micrographs of the Co3O4 nanoparticles obtained in synthesis Co_2.8, Co_3.5, Co_4.9, and Co_7.6, respectively, together with (e) the particular volume-based size distributions and (f) X-ray diffractograms with a reference pattern for Co3O4. In part reproduced from ref. 9 with permission from The Royal Society of Chemistry. | ||
3.3 Size-dependent reduction of 5 wt% Co/EG model catalysts
A couple of experimental procedures can be employed to limit the extent of sintering during the activation of metal oxide-based catalysts in H2. Minimisation of the reduction temperature and hence the thermal strain is the most obvious one as the sintering tendency strongly correlates with temperature.70 Additional parameters of sintering are the composition of reactive atmosphere,71–74 the particle size distribution,75–77 and the nature/reactivity of the support material.76,78,79 The latter is arguably the most important factor in heterogeneous catalysts as unsupported metal oxide nanoparticles experience a severe increase in size without the stabilising effect of a carrier (Fig. S.10 and S.11†). In comparison to oxidic supports, EG and graphite in general exhibit only little functionalisation of the surface.24,80 The majority of the functional groups present can be expected to be localised at the edges of the single planes within the graphite structure, which only make up a small fraction of the overall surface area.The separately synthesised nanoparticles were supported on EG in order to assess the suitability of such novel model systems for the isolated characterisation of metallic Co crystallites. The physicochemical surface properties of the support can be expected to induce differently pronounced interactions with the nanoparticles, which affect their dispersion over the support during the supporting procedure. Three model catalysts with a targeted 5 wt% Co loading were prepared and analysed by means of TGA and TEM. TGA resulted in actual Co loadings in the range of 4.4 to 5.0 wt% (Fig. S.12†), i.e. the three samples showed a similar concentration of Co. The thin flakes of exfoliated graphite and the large density difference between the support material and the Co3O4 nanoparticles allow for a clear distinction between the nanoparticles and the carrier (Fig. 5). Comparison of the parent catalysts consisting of the Co3O4 nanoparticles Co_2.8, Co_4.9, and Co_7.6 supported on EG demonstrates the different dispersion levels of the oxidic cobalt phase over the available surface area of the carrier. The larger nanoparticles in the 5 wt% Co_7.6/EG and Co_4.9/EG samples are well distributed and only small aggregates are identified. A high dispersion over the surface area of the support was achieved for the smaller nanoparticles, but the surface of the EG appears to be crowded due to the large number of small crystallites required for the 5 wt% loading.
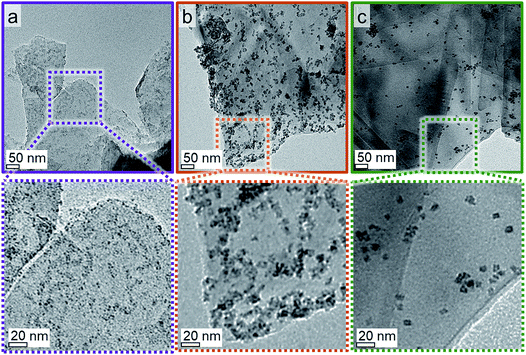 | ||
| Fig. 5 Transmission electron micrographs of 5 wt% (a) Co_2.8, (b) Co_4.9, and (c) Co_7.6 on exfoliated graphite with magnified insets. | ||
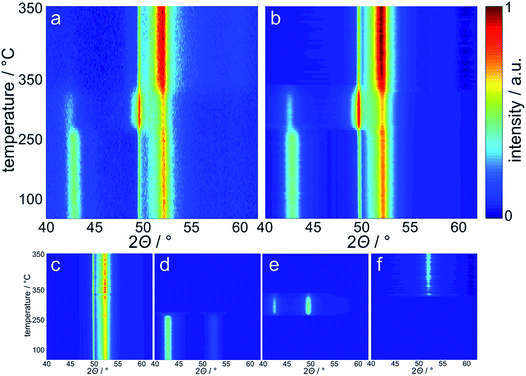
The reduction behaviour of the three model catalysts in H2 was studied from 50 °C up to the desired reduction temperature via in situ XRD. The relatively low energy level of conventional X-ray radiation sources in combination with the overlap of the Co-related reflections with the support pattern result in a lower detection limit of the cobaltous phase of approximately 5 wt%. The largest Co3O4 nanoparticles in sample Co_7.6/EG feature, as expected, narrow diffractions (most intense reflection at 43.0°) of relatively high intensity and hence a high signal-to-noise ratio, which in turn results in distinct in situ XRD patterns (Fig. 6). A successful application of the modified PONKCS analysis53 of EG is indicated by the rather constant pattern of the summed-up graphite structures during the reduction. A first reduction of the Co3O4 phase to CoO (reflections at 42.7 and 49.7°) was observed at 235 °C during the 1 °C min−1 ramp to 350 °C. The subsequent formation of fcc-Co occurred rapidly from 310 °C onwards and was delayed when compared to unsupported nanoparticles (245 °C; Fig. S.10 and S.11†). Metallic fcc-Co (reflection at 51.8°) is the only cobaltous phase identified at temperatures exceeding 340 °C.
Even though the low temperature (<400 °C) allotrope of metallic Co is reported to be hcp-Co for bulk phases,81 the formation of single-phase fcc-Co without a (detectable) fraction of hcp-Co is in good agreement with literature.82,83 Metallic Co nanoparticles, prepared via neutron sputtering at ambient temperature, are reported to consist of pure fcc-Co for crystallite sizes below 20 nm, while the concentration of the hexagonal allotrope increases significantly with size to approximately 85% in nanoparticles above 40 nm.82 However, annealing of 30 nm Co nanoparticles with an initial concentration of hcp-Co of 78% at different temperatures (in the range of 200–500 °C) resulted in an increase of the concentration of hcp-Co at 300 °C, while said phase was transformed to fcc-Co at higher temperatures. A pure fcc-Co phase was detected at 500 °C.82 A preferential formation of fcc-Co in nanoparticles below 20 nm was confirmed for Al2O3-supported Co nanoparticles.83 Reduction of several sizes (3–10 nm) of Co3O4 to metallic Co in H2 at 450 °C, similar conditions as applied in this study, resulted in single-phase fcc-Co as well. More recently, a highly intergrown fcc-hcp phase has been reported in cobalt nanoparticles supported on TiO2 as well.84
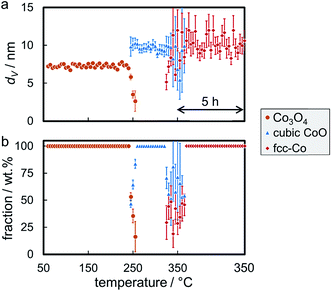
Sintering of the nanoparticles during reduction of sample Co_7.6/EG in H2 was identified (Fig. 7a) even though the nanoparticles were expected to be rather isolated with relatively large inter-particle distances. Seemingly, sintering first occurred during reduction to CoO and, to a smaller extent, during the formation of fcc-Co. The presence of aggregated crystallites in the parent sample due to the relatively high Co loading of 5 wt% and consequential crowding of the support surface may explain the observed crystallite growth. Further, carbon supports are reported to provide only little stabilisation of nanoparticles when compared to metal oxide carriers,19–21,71 which may allow for pronounced sintering via crystallite migration and collision. It has to be noted that the accuracy of the obtained crystallite sizes for fcc-Co is limited due to the overlap of the main diffraction at 51.8° with reflections of the graphitic support. Analysis of the composition of the cobaltous phases during the reduction clearly exhibits a separated two-step reduction of Co3O4 to the metallic Co phase via CoO (Fig. 7b), which is in line with literature.83,85–88
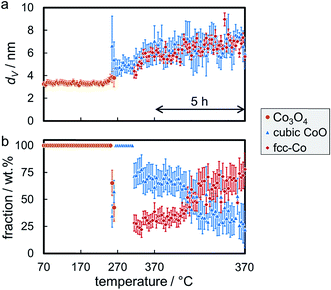
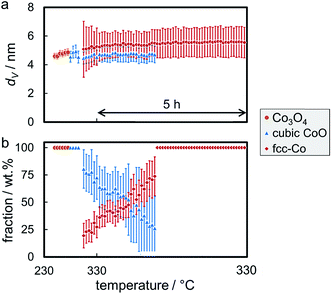
Reduction of the 4.9 nm Co3O4 nanoparticles in sample Co_4.9/EG was conducted at 350 °C with a 5 h holding time. The first reduction step to CoO was observed at 245 °C (Fig. S.13†), which is only 5 °C higher when compared to the larger nanoparticles in sample Co_7.6/EG. A subsequent slow reduction to fcc-Co was observed at temperatures exceeding 320 °C, while the volume-mean crystallite size only increased by 0.7 nm (Fig. 8a) lying within the error range of Rietveld refinement. Even though the abstraction of oxygen during reduction of Co3O4 goes along with a theoretical decrease of the crystallite size during reduction (Co3O4 to CoO: 12%, CoO to metallic Co: 43%), the change in crystallite shape from cubes to most likely spheres is expected to approximately balance the shrinkage in size. Rietveld refinement suggests no further reduction of CoO after 1 h at 350 °C (Fig. 8b) as the CoO reflection at 49.6° can be continuously identified throughout the in situ XRD pattern.
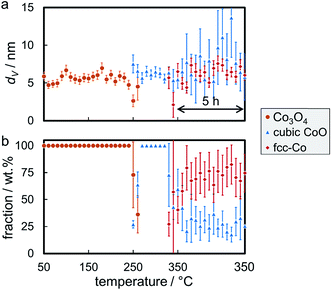
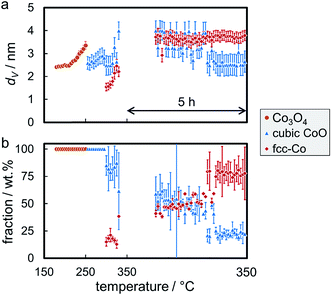
The required temperature for the first formation/detection of CoO during reduction of the smallest Co3O4 nanoparticles in H2 (Co_2.8/EG) was 250 °C (Fig. S.14†) and hence slightly increased when compared to the larger sizes (Co_2.8/EG: 245 °C; Co_7.6/EG: 240 °C). This observation may be explained by the small crystallite size resulting in broad and hence less intense reflections or potentially exhibits a weak size-dependency of the reduction behaviour of Co3O4 crystallites. Metallic fcc-Co was only formed at approximately 325 °C. Hence, the reduction of CoO to fcc-Co is seemingly hindered for this smallest size as well, which is supported by the continuous identification of the CoO phase via the reflection at 49.6°. Sintering is identified during both reduction steps, from Co3O4 to CoO and from CoO to fcc-Co (Fig. 9a). However, the sizes of both phases remain smaller than in the samples containing the initially larger crystallites. Rietveld refinement results in a final concentration of fcc-Co of almost 80 wt%, which may be increased further at extended holding times (Fig. 9b).
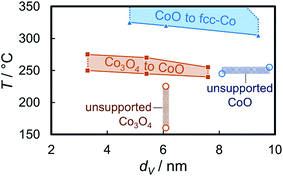
The onset temperatures of the reduction of the supported Co3O4 crystallites (240–250 °C) in the three model catalysts are significantly higher than observed for the initial reduction of unsupported crystallites of comparable size (160 °C; Fig. 10, S.10 and S.11†). The identification of sintering, as calculated via Rietveld refinement, has been considered in the comparison of the volume-mean crystallite sizes. The second reduction step to metallic Co also requires significantly increased temperatures (305–320 °C vs. 245 °C). In addition, the unsupported CoO crystallites reduce rapidly without significant further activation requirement. This may be explained by a H* spillover process from formed metallic sites to the adjacent oxidic counterpart89–91 resulting in an accelerated autocatalytic reduction.92–94 Such a mechanism may also be at play during reduction of supported aggregates to metallic Co. However, the differences in the absolute onset temperatures have to be induced by the stabilising effect of the support, which becomes more effective for smaller crystallite sizes. A size-dependent reduction behaviour of cobalt oxide in H2 has been reported in literature as well.95–97 The support limits the tendency of sintering due to the increased inter-particle distance and potentially hinders or limits H* spillover via the surface of the support.91 Hence, the facile reduction of unsupported crystallites may be driven by the potential decrease in the surface energy98,99via a facilitated sintering process during reduction to metallic Co. The hindered reducibility of supported crystallites demonstrates the stabilising effect of the support on the physicochemical properties of nanoparticles even though carbon supports are expected to provide a low degree of interaction, often quoted as ‘inert’ in literature.19–21 Especially the second reduction step forming metallic Co has been reported to be strongly affected by the nature of the support material95 and can be expected to shift to increased temperatures for metal oxide carriers.
Post-run analysis of the reduced samples after (passivating) exposure to air by means of TEM confirmed the previously described increases of the volume-mean crystallite size in all three samples with 5 wt% Co loading (Fig. 11). Size analysis of over 500 nanoparticles in the reduced 5 wt% Co_2.8/EG model catalyst resulted in a volume-mean particle size of 8.5 nm with a standard deviation of 3.9 nm, which is in line with the crystallite sizes obtained via Rietveld refinement of the in situ XRD patterns (7.5–8 nm). The number-based size distribution shows a broadening of the initial narrow distribution to larger sizes up to 14 nm and resembles to a log-normal size distribution as typically observed after sintering.73,100 The size of the sintered crystallites in samples Co_4.9/EG and Co_7.6/EG with the initially larger Co3O4 crystallites were seemingly underestimated by analysis of the XRD patterns. TEM analysis resulted in volume-mean particle sizes of 10.3 ± 3.2 nm for Co_4.9/EG and 15.0 ± 4.9 nm for Co_7.6/EG, while Rietveld refinement suggested volume-mean crystallite sizes in the range of 6–7 nm and 9–12 nm, respectively. However, the trend was confirmed and the log-normal-type size distribution indicates the expected occurrence of sintering during reduction of the model catalysts. The low Co loading and the relatively small change of the peak width above 7 nm may be accounted for the underestimation of the sizes by means of XRD.
3.4 Reduction behaviour of isolated Co3O4 nanoparticles
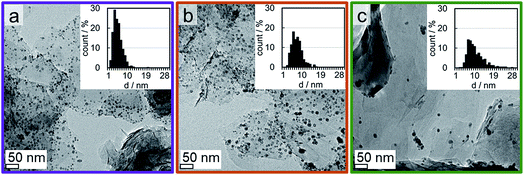
XRD reduction studies have shown that unsupported Co3O4 allows for a facile reduction when compared to supported nanoparticles (Fig. 10). Hence, a significant fraction of the observed reduction of Co3O4/EG to metallic crystallites may be attributed to aggregates of nanoparticles, which show a H* spillover-assisted, autocatalytic reduction behaviour similar to unsupported crystallites and tend to sinter as only little or no stabilisation is provided within the agglomerate. Dispersed nanoparticles exhibit a pronounced stabilisation by the support, which in turn increases the required temperature for their reduction to metallic Co. The extreme case of an isolated nanoparticle with large inter-particle distances is expected to require the harshest reduction condition, that is the highest temperature. In order to reduce the extent of sintering of the well-defined Co3O4 crystallites, the loading of Co has been reduced to 1 wt% and EG has been decorated with several sizes of Co3O4 nanoparticles (2.8, 3.5, and 7.6 nm denoted Co_2.8, Co_3.5, and Co_7.5, respectively). TGA resulted in Co loadings of 0.9 to 1.1 wt% (Fig. S.15†). The samples comprising the smaller sizes show a high dispersion of nanoparticles over the support surface (Fig. 12). In contrast, some small aggregates were identified by means of TEM in the samples comprising the larger nanoparticles. However, the fraction of well-dispersed isolated crystallites increased drastically compared to the sample with a 5 wt% Co loading. Synchrotron radiation-based high energy XRD allows for the detection of loadings of 1 wt% of Co on EG as long as the crystallite size is sufficiently large, i.e. the XRD patterns feature well-defined reflections. However, the difference between the bare support and the parent Co_2.8/EG sample is marginal prohibiting a viable in situ analysis (Fig. S.16†). Especially the main (311) reflection of Co3O4 at 23.5° can be identified for the two larger sizes. Hence, in situ XRD reduction studies in H2 were only conducted for the larger supported nanoparticles utilising synchrotron-generated X-rays with the selected wavelength of 0.9941 Å.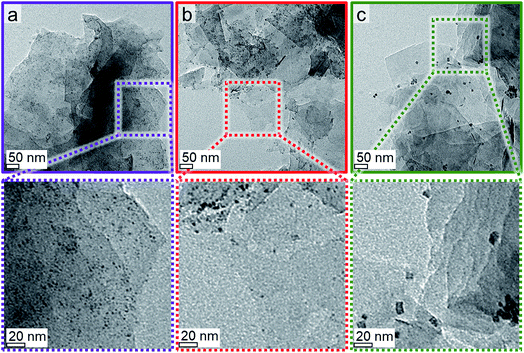 | ||
| Fig. 12 Transmission electron micrographs of 1 wt% (a) Co_2.8, (b) Co_3.5, and (c) Co_7.6 on exfoliated graphite with magnified insets. | ||
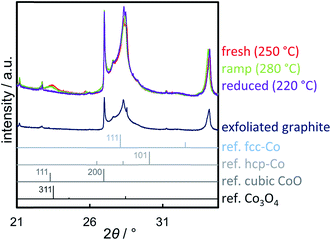
A reduction temperature of 330 °C was selected for the 1 wt% Co_7.6/EG sample based on the observed rapid reduction of the 5 wt% Co_7.6 nanoparticles on EG at 350 °C (Fig. 6). Even though this model catalyst has a relatively large size of Co3O4 nanoparticles, most of the features in the top-view of the in situ XRD patterns during reduction in H2 are related to the support (Fig. S.17†). Superimposition of the XRD pattern obtained prior to reduction, the pattern exhibiting the maximum concentration of CoO during the temperature ramp, and the pattern after reduction aids the visual identification of the particular phases present in the sample (Fig. 13). The (311) plane in Co3O4 crystallites results in a diffraction at 23.5°, which shifts to marginally lower diffraction angles upon first reduction due to the (111) plane in CoO. Furthermore, the major (200) diffraction of CoO at 27.0° results in a shoulder at lower angles for the support reflections in the range of 26.8–30.5°, which also increases the intensity of the reflection of EG at 26.9°. The (111) diffraction of fcc-Co at 28.0° increases the intensities of the reflections of EG at 28.2° and results in an increased intensity between the major reflections of EG between 27 to 28°.
Rietveld refinement, including the application of a modified PONKCS approach53 for EG, results in viable patterns for the particular cobalt phases, as well as for the support (Fig. S.17†). However, no clear transition region could be modelled for the first reduction step, i.e. only one of the cobalt oxides may be fitted per pattern even though the experimentally obtained in situ XRD patterns suggest a transition period with the simultaneous presence of both oxides. The required temperature of approximately 265 °C for the reduction to CoO is significantly higher than for the same nanoparticles in the 5 wt% Co_7.6/EG sample (240 °C). This shift to higher temperatures, when compared to a higher loading, demonstrates an improved dispersion and hence a pronounced stabilisation of the nanoparticles by the support. Increased inter-particle distances due to the decreased loading and less aggregates can cause this effect, which was already displayed when comparing the 5 wt% samples to unsupported crystallites (Fig. 10). The intensity of the (111) reflection of CoO peaks at 280 °C. Low concentrations of fcc-Co can be fitted from 300 °C onwards, but significantly higher concentrations are only obtained at the maximum reduction temperature of 330 °C. The onset temperature is comparable to the 5 wt% loaded sample (305 °C), however the rate of reduction is slower. As observed for higher loadings, no formation of hcp-Co is detected upon reduction to metallic Co. The obtained crystallite sizes of the cobalt oxides from in situ synchrotron radiation-based XRD of 4.5–5.5 nm represent an underestimation of the actual size seeing the initial size of 7.6 nm (identified via TEM and Rietveld refinement of the XRD pattern of the unsupported nanoparticles; Table S.1†). However, no significant increase of the crystallite size is identified during reduction to CoO and fcc-Co indicating the absence of major sintering (Fig. 14a). A continuous reduction of CoO to fcc-Co was modelled at the reduction temperature of 330 °C during the first 2 h of the holding time (Fig. 14b).
The smaller Co3O4 nanoparticles in sample Co_3.5/EG were reduced at 350 °C, which is sufficiently high to obtain high concentrations of fcc-Co as indicated by the increased intensity of the diffraction of the support at 28° (Fig. S.18 and S.19†). It has to be noted that no measurements were taken during the first hour at 350 °C due to beam instability. As for the larger size, the transition period from Co3O4 to CoO could not be modelled with both oxidic phases in one pattern. The onset temperature of the reduction to CoO was approximately 270 °C and therefore higher than for sample Co_2.8/EG with 5 wt% loading (250 °C). The maximum concentration of CoO was observed at an increased temperature when compared to the larger sized crystallites in Co_7.6/EG (295 vs. 280 °C). Both observations indicate an improved isolation of the crystallites due to the decreased loading of Co. Metallic fcc-Co was first identified at 310 °C, which is lower than in 5 wt% Co_2.8/EG at 325 °C. This observation may be due to the increased sensitivity of the synchrotron radiation-based XRD seeing the relatively low fraction of Co of 10–15 wt% in combination with the slow reduction at said temperatures and the marginally increased crystallite size (Fig. 15). Approximately half of the Co has been reduced to its metallic state after one hour at 350 °C. The initial size of Co3O4 crystallites is seemingly underestimated by 1 nm, while the resulting final size of fcc-Co lies within the expected range of 3.5–4 nm. Rietveld refinement further suggests a constant crystallite size of the metallic phase during the last 4 h of the holding time at 350 °C. The absence of reflections of the two oxide phases in the post-reduction XRD pattern indicates a high DOR (Fig. S.18†) even though Rietveld refinement suggests a fraction of 25 wt% CoO (Fig. 15b). Once again, the difficulty in the identification of the Co phase demonstrates the operation close to the detection limits for the studied model system. A decreasing intensity ratio of the support reflections at 27.0° and 28.4° in the superimposed patterns provides further proof for the formation of metallic fcc-Co (Fig. S.19†).
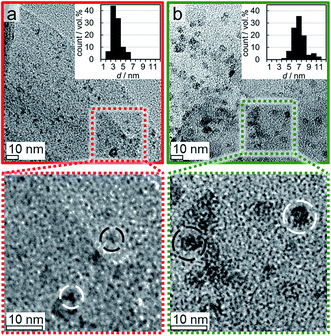
Post-run analysis of the reduced and passivated samples Co_7.6/EG and Co_3.5/EG with a 1 wt% loading of Co by TEM confirmed the high resistance of both samples against sintering. Volume-mean crystallite sizes of 7.1 ± 1.4 (1 wt% Co_7.6/EG) and 3.6 ± 1.0 nm (1 wt%. Co_3.5/EG) were measured (Fig. 16). The size distribution of the larger crystallites in Co_7.6/EG suggests an slight bimodal distribution, which is an indicator for sintering of a small fraction of the nanoparticles.73,100 Less than 10 wt% of the Co fraction participated in sintering, i.e. most of the nanoparticles displayed a high stability during reduction in H2 as supported by in situ XRD. In contrast, almost all of the smaller nanoparticles in Co_3.5/EG maintained their initial size, potentially due to a superior initial distribution of the nanoparticles over the support. Pronounced metal–support interaction due to the decreased size can also be expected to result in an enhanced stabilisation of the nanoparticles by the support.
4 Conclusions
Graphitic carbon materials were characterised and tested for their suitability as support material for cobaltous nanoparticles in model catalyst systems. When compared to pristine graphite powder, exfoliated graphite was shown to provide a significantly increased surface area allowing for a high dispersion of nanoparticles over the support surface. However, a cobalt loading as low as 1 wt% is required in order to minimise the formation of aggregates which sinter easily during reduction in hydrogen. A mildly size-dependent reduction behaviour of Co3O4 crystallites in H2 was identified utilising this newly developed model catalyst system exhibiting a delayed reduction of smaller nanoparticles to CoO, as well as to fcc-Co in the second reduction step. The model catalysts were highly reducible at moderate temperatures due to the weak interaction of the relatively inert exfoliated graphite support with the nanoparticles. The developed model catalyst provides great opportunities in order to study isolated Co3O4 and fcc-Co nanoparticles in various applications. Exfoliated graphite as support material further allows for fundamental insight into the physicochemical properties of supported nanoparticles by limiting the influence of the carrier material.Conflicts of interest
There are no conflicts to declare.Acknowledgements
Financial support from the DST-NRF Centre of Excellence in Catalysis (c*change), the University of Cape Town (UCT), and the German Academic Exchange Service (DAAD) is gratefully acknowledged. The kind support of the scientific staff at beamline I711 and the MAX II synchrotron in general is highly acknowledged.References
- E. Iglesia, S. L. Soled and R. A. Fiato, J. Catal., 1992, 137, 212–224 CrossRef CAS.
- Ø. Borg, S. Eri, E. A. Blekkan, S. Storsæter, H. Wigum, E. Rytter and A. Holmen, J. Catal., 2007, 248, 89–100 CrossRef.
- S. Lögdberg, M. Boutonnet, J. C. Walmsley, S. Järås, A. Holmen and E. A. Blekkan, Appl. Catal., A, 2011, 393, 109–121 CrossRef.
- F. Bertella, P. Concepción and A. Martínez, Catal. Today, 2016, 289, 181–191 CrossRef.
- A. Kogelbauer, J. C. Weber and J. G. Goodwin Jr, Catal. Lett., 1995, 34, 259–267 CrossRef CAS.
- B. Jongsomjit, J. Panpranot and J. G. Goodwin Jr, J. Catal., 2001, 204, 98–109 CrossRef CAS.
- D. J. Moodley, A. M. Saib, J. van de Loosdrecht, C. A. Welker-Nieuwoudt, B. H. Sigwebela and J. W. Niemantsverdriet, Catal. Today, 2011, 171, 192–200 CrossRef CAS.
- N. E. Tsakoumis, J. C. Walmsley, M. Rønning, W. van Beek, E. Rytter and A. Holmen, J. Am. Chem. Soc., 2017, 139, 3706–3715 CrossRef CAS PubMed.
- M. Wolf, H. Kotzé, N. Fischer and M. Claeys, Faraday Discuss., 2017, 197, 243–268 RSC.
- S. J. Tauster, S. C. Fung, R. T. K. Baker and J. A. Horsley, Science, 1981, 21, 1121–1125 CrossRef PubMed.
- S. J. Tauster, Acc. Chem. Res., 1987, 20, 389–394 CrossRef CAS.
- N. Fischer, M. Minnermann, M. Baeumer, E. van Steen and M. Claeys, Catal. Lett., 2012, 142, 830–837 CrossRef CAS.
- G. L. Haller and D. E. Resasco, Adv. Catal., 1989, 36, 173–235 CAS.
- M. Wolf, E. K. Gibson, E. J. Olivier, J. H. Neethling, C. R. A. Catlow, N. Fischer and M. Claeys, ACS Catal., 2019, 9, 4902–4918 CrossRef CAS.
- J. L. Figueiredo, M. F. R. Pereira, M. M. A. Freitas and J. J. M. Órfão, Carbon, 1999, 37, 1379–1389 CrossRef CAS.
- N. Karousis, N. Tagmatarchis and D. Tasis, Chem. Rev., 2010, 110, 5366–5397 CrossRef CAS PubMed.
- D. S. Su, S. Perathoner and G. Centi, Chem. Rev., 2013, 113, 5782–5816 CrossRef CAS PubMed.
- J. van de Loosdrecht, M. Datt and J. L. Visagie, Top. Catal., 2014, 57, 430–436 CrossRef.
- G. L. Bezemer, J. H. Bitter, H. P. C. E. Kuipers, H. Oosterbeek, J. E. Holewijn, X. Xu, F. Kapteijn, A. J. van Dillen and K. P. de Jong, J. Am. Chem. Soc., 2006, 128, 3956–3964 CrossRef CAS PubMed.
- M. Trépanier, A. K. Dalai and N. Abatzoglou, Appl. Catal., A, 2010, 374, 79–86 CrossRef.
- F. Rodríguez-Reinoso, Carbon, 1998, 36, 159–175 CrossRef.
- M. Wolf, B. K. Mutuma, N. J. Coville, N. Fischer and M. Claeys, ACS Catal., 2018, 8, 3985–3989 CrossRef CAS.
- M. Cai, D. Thorpe, D. H. Adamson and H. C. Schniepp, J. Mater. Chem., 2012, 22, 24992–25002 RSC.
- V. Singh, D. Joung, L. Zhai, S. Das, S. I. Khondaker and S. Seal, Prog. Mater. Sci., 2011, 56, 1178–1271 CrossRef CAS.
- J. N. Coleman, M. Lotya, A. O'Neill, S. D. Bergin, P. J. King, U. Khan, K. Young, A. Gaucher, S. De, R. J. Smith, I. V. Shvets, S. K. Arora, G. Stanton, H.-Y. Kim, K. Lee, G. T. Kim, G. S. Duesberg, T. Hallam, J. J. Boland, J. J. Wang, J. F. Donegan, J. C. Grunlan, G. Moriarty, A. Shmeliov, R. J. Nicholls, J. M. Perkins, E. M. Grieveson, K. Theuwissen, D. W. McComb, P. D. Nellist and V. Nicolosi, Science, 2011, 331, 568–571 CrossRef CAS PubMed.
- W. Zhao, M. Fang, F. Wu, H. Wu, L. Wang and G. Chen, J. Mater. Chem., 2010, 20, 5817–5819 RSC.
- Y. Hernandez, V. Nicolosi, M. Lotya, F. M. Blighe, Z. Sun, S. De, I. T. McGovern, B. Holland, M. Byrne, Y. K. Gun'Ko, J. J. Boland, P. Niraj, G. Duesberg, S. Krishnamurthy, R. Goodhue, J. Hutchison, V. Scardaci, A. C. Ferrari and J. N. Coleman, Nat. Nanotechnol., 2008, 3, 563–568 CrossRef CAS PubMed.
- U. Khan, A. O'Neill, M. Lotya, S. De and J. N. Coleman, Small, 2010, 6, 864–871 CrossRef CAS PubMed.
- U. Khan, A. O'Neill, H. Porwal, P. May, K. Nawaz and J. N. Coleman, Carbon, 2012, 50, 470–475 CrossRef CAS.
- W. S. Hummers Jr and R. E. Offeman, J. Am. Chem. Soc., 1958, 80, 1339 CrossRef.
- J. I. Paredes, S. Villar-Rodil, A. Martínez-Alonso and J. M. D. Tascón, Langmuir, 2008, 24, 10560–10564 CrossRef CAS PubMed.
- Y. Si and E. T. Samulski, Nano Lett., 2008, 8, 1679–1682 CrossRef CAS PubMed.
- B. F. Machado and P. Serp, Catal. Sci. Technol., 2012, 2, 54–75 RSC.
- S. Stankovich, D. A. Dikin, G. H. B. Dommett, K. M. Kohlhaas, E. J. Zimney, E. A. Stach, R. D. Piner, S. T. Nguyen and R. S. Ruoff, Nature, 2006, 442, 282–286 CrossRef CAS PubMed.
- W. Gao, L. B. Alemany, L. Ci and P. M. Ajayan, Nat. Chem., 2009, 1, 403–408 CrossRef CAS PubMed.
- H. Zhang, C. Lancelot, W. Chu, J. Hong, A. Y. Khodakov, P. A. Chernavskii, J. Zheng and D. Tong, J. Mater. Chem., 2009, 19, 9241–9249 RSC.
- H. Xiong, L. L. Jewell and N. J. Coville, ACS Catal., 2015, 2640–2658 CrossRef CAS.
- J. R. C. Salgado, R. G. Duarte, L. M. Ilharco, A. M. Botelho do Rego, A. M. Ferraria and M. G. S. Ferreira, Appl. Catal., B, 2011, 102, 496–504 CrossRef CAS.
- W. Xia, C. Jin, S. Kundu and M. Muhler, Carbon, 2009, 47, 919–922 CrossRef CAS.
- N. Shi, W. Cheng, H. Zhou, T. Fan and M. Niederberger, Chem. Commun., 2015, 51, 1338–1340 RSC.
- M. Wolf, N. Fischer and M. Claeys, Mater. Chem. Phys., 2018, 213, 305–312 CrossRef CAS.
- W. Rasband, ImageJ 1.51a, National Institute of Mental Health, Bethesda, USA, 2016 Search PubMed.
- L. G. Cançado, K. Takai, T. Enoki, M. Endo, Y. A. Kim, H. Mizusaki, A. Jorio, L. N. Coelho, R. Magalhães-Paniago and M. A. Pimenta, Appl. Phys. Lett., 2006, 88, 12–14 CrossRef.
- S. A. El-Khodary, G. M. El-Enany, M. El-Okr and M. Ibrahim, Electrochim. Acta, 2014, 150, 269–278 CrossRef CAS.
- M. Chen, B. Hallstedt and L. J. Gauckler, J. Phase Equilib., 2003, 24, 212–227 CrossRef CAS.
- Y. Cerenius, K. Ståhl, L. A. Svensson, T. Ursby, Å. Oskarsson, J. Albertsson and A. Liljas, J. Synchrotron Radiat., 2000, 7, 203–208 CrossRef CAS PubMed.
- ICDD, PDF-2 Release 2008 (Database), International Centre for Diffraction Data, Newtown Square, USA, 2008 Search PubMed.
- A. A. Coelho, J. Appl. Crystallogr., 2003, 36, 86–95 CrossRef CAS.
- P. Scherrer, Nachr. Ges. Wiss. Goettingen, Math.-Phys. Kl., 1918, 98–100 Search PubMed.
- G. Bergeret and P. Gallezot, in Handbook of Heterogeneous Catalysis, eds. G. Ertl, H. Knözinger, F. Schüth and J. Weitkamp, Wiley-VCH, Weinheim, Germany, 2nd edn, 2008, pp. 738–765 Search PubMed.
- M. Claeys and N. Fischer, US Pat., 8,597,598, 2013, p.1.
- N. Fischer and M. Claeys, Catal. Today, 2016, 275, 149–154 CrossRef CAS.
- N. V. Y. Scarlett and I. C. Madsen, Powder Diffr., 2006, 21, 278–284 CrossRef CAS.
- J. P. Nelson and D. P. Riley, Proc. Phys. Soc., London, 1945, 57, 477–485 CrossRef CAS.
- D. P. Riley and J. P. Nelson, Proc. Phys. Soc., London, 1945, 57, 486–495 CrossRef CAS.
- M. Wolf, N. Fischer and M. Claeys, Catal. Today, 2016, 275, 135–140 CrossRef CAS.
- MATLAB Release R2015b, The MathWorks, Inc., Natick, United States, 2015 Search PubMed.
- M. Wolf, N. Fischer and M. Claeys, in preparation.
- H. Fujimoto, Carbon, 2003, 41, 1585–1592 CrossRef CAS.
- C. N. R. Rao, K. Biswas, K. S. Subrahmanyam and A. Govindaraj, J. Mater. Chem., 2009, 19, 2457–2469 RSC.
- A. C. Ferrari, Solid State Commun., 2007, 143, 47–57 CrossRef CAS.
- M. S. Dresselhaus, A. Jorio, A. G. Souza Filho and R. Saito, Philos. Trans. R. Soc., A, 2010, 368, 5355–5377 CrossRef CAS PubMed.
- C. Castiglioni, F. Negri, M. Rigolio and G. Zerbi, J. Chem. Phys., 2001, 115, 3769–3778 CrossRef CAS.
- F. Tuinstra and J. L. Koenig, J. Chem. Phys., 1970, 53, 1126–1130 CrossRef CAS.
- A. C. Ferrari, J. C. Meyer, V. Scardaci, C. Casiraghi, M. Lazzeri, F. Mauri, S. Piscanec, D. Jiang, K. S. Novoselov, S. Roth and A. K. Geim, Phys. Rev. Lett., 2006, 97, 1–4 Search PubMed.
- D. S. Knight and W. B. White, J. Mater. Res., 1989, 4, 385–393 CrossRef CAS.
- R. P. Vidano, D. B. Fischbach, L. J. Willis and T. M. Loehr, Solid State Commun., 1981, 39, 341–344 CrossRef CAS.
- M. A. M. Motchelaho, H. Xiong, M. Moyo, L. L. Jewell and N. J. Coville, J. Mol. Catal. A: Chem., 2011, 335, 189–198 CrossRef CAS.
- B. K. Mutuma, B. J. Matsoso, K. Ranganathan, J. M. Keartland, D. Wamwangi and N. J. Coville, RSC Adv., 2017, 7, 21187–21195 RSC.
- C. H. Bartholomew, Appl. Catal., A, 2001, 212, 17–60 CrossRef CAS.
- G. L. Bezemer, T. J. Remans, A. P. van Bavel and A. I. Dugulan, J. Am. Chem. Soc., 2010, 132, 8540–8541 CrossRef CAS PubMed.
- M. Claeys, M. E. Dry, E. van Steen, P. J. van Berge, S. Booyens, R. Crous, P. van Helden, J. Labuschagne, D. J. Moodley and A. M. Saib, ACS Catal., 2015, 5, 841–852 CrossRef CAS.
- M. Sadeqzadeh, J. Hong, P. Fongarland, D. Curulla-Ferré, F. Luck, J. Bousquet, D. Schweich and A. Y. Khodakov, Ind. Eng. Chem. Res., 2012, 51, 11955–11964 CrossRef CAS.
- R. Ouyang, J.-X. Liu and W.-X. Li, J. Am. Chem. Soc., 2013, 135, 1760–1771 CrossRef CAS PubMed.
- D. A. Chen, M. C. Bartelt, S. M. Seutter and K. F. McCarty, Surf. Sci., 2000, 464, L708–L714 CrossRef CAS.
- G. Prieto, J. Zečević, H. Friedrich, K. P. de Jong and P. E. de Jongh, Nat. Mater., 2013, 12, 34–39 CrossRef CAS PubMed.
- K. Wettergren, F. F. Schweinberger, D. Deiana, C. J. Ridge, A. S. Crampton, M. D. Rötzer, T. W. Hansen, V. P. Zhdanov, U. Heiz and C. Langhammer, Nano Lett., 2014, 14, 5803–5809 CrossRef CAS PubMed.
- J. Sun, D. Ma, H. Zhang, X. Liu, X. Han, X. Bao, G. Weinberg, N. Pfänder and D. Su, J. Am. Chem. Soc., 2006, 128, 15756–15764 CrossRef CAS PubMed.
- S. L. Hemmingson and C. T. Campbell, ACS Nano, 2017, 11, 1196–1203 CrossRef CAS PubMed.
- J.-F. Dai, G.-J. Wang, L. Ma and C.-K. Wu, Rev. Adv. Mater. Sci., 2015, 40, 60–71 CAS.
- B. W. Lee, R. Alsenz and A. Ignatiev, Phys. Rev. B: Solid State, 1978, 17, 1510–1520 CrossRef CAS.
- O. Kitakami, H. Sato, Y. Shimada, F. Sato and M. Tanaka, Phys. Rev. B: Condens. Matter Mater. Phys., 1997, 56, 13849–13854 CrossRef CAS.
- N. Fischer, E. van Steen and M. Claeys, Catal. Today, 2011, 171, 174–179 CrossRef CAS.
- S. W. T. Price, D. J. Martin, A. D. Parsons, W. A. Sławiński, A. Vamvakeros, S. J. Keylock, A. M. Beale and J. F. W. Mosselmans, Sci. Adv., 2017, 3, e1602838 CrossRef PubMed.
- P. Arnoldy and J. A. Moulijn, J. Catal., 1985, 93, 38–54 CrossRef CAS.
- D. Schanke, A. M. Hilmen, E. Bergene, K. Kinnari, E. Rytter, E. Ådanes and A. Holmen, Catal. Lett., 1995, 34, 269–284 CrossRef CAS.
- R. Dehghan, T. W. Hansen, J. B. Wagner, A. Holmen, E. Rytter, Ø. Borg and J. C. Walmsley, Catal. Lett., 2011, 141, 754–761 CrossRef CAS.
- A. M. Beale, S. D. M. Jacques, M. Di Michiel, J. F. W. Mosselmans, S. W. T. Price, P. Senecal, A. Vamvakeros and J. Paterson, Philos. Trans. R. Soc., A, 2017, 376, 20170057 CrossRef.
- D. Nabaho, J. W. Niemantsverdriet, M. Claeys and E. van Steen, Catal. Today, 2015, 261, 17–27 CrossRef.
- R. Prins, Chem. Rev., 2012, 112, 2714–2738 CrossRef CAS PubMed.
- W. Karim, C. Spreafico, A. Kleibert, J. Gobrecht, J. VandeVondele, Y. Ekinci and J. A. van Bokhoven, Nature, 2017, 541, 68–71 CrossRef CAS PubMed.
- H. Knözinger, in Handbook of Heterogeneous Catalysis, ed. G. Ertl, H. Knözinger, F. Schüth and J. Weitkamp, Wiley-VCH, Weinheim, Germany, 2nd edn, 2008, pp. 1080–1096 Search PubMed.
- S. P. S. Andrew, Chem. Eng. Sci., 1981, 36, 1431–1445 CrossRef CAS.
- O. Levenspiel, Chemical Reaction Engineering, Wiley, New York, 3rd edn, 1999 Search PubMed.
- G. Jacobs, Y. Ji, B. H. Davis, D. Cronauer, A. J. Kropf and C. L. Marshall, Appl. Catal., A, 2007, 333, 177–191 CrossRef CAS.
- B. Zeng, B. Hou, L. Jia, J. Wang, C. Chen, Y. Sun and D. Li, ChemCatChem, 2013, 5, 3794–3801 CrossRef CAS.
- T. Jermwongratanachai, G. Jacobs, W. D. Shafer, V. R. R. Pendyala, W. Ma, M. K. Gnanamani, S. Hopps, G. A. Thomas, B. Kitiyanan, S. Khalid and B. H. Davis, Catal. Today, 2014, 228, 15–21 CrossRef CAS.
- W. Thomson, Philos. Mag., 1871, 42, 448–452 Search PubMed.
- P. R. Couchman and W. A. Jesser, Nature, 1977, 269, 481–483 CrossRef CAS.
- B. M. Xaba and J. P. R. de Villiers, Ind. Eng. Chem. Res., 2016, 55, 9397–9407 CrossRef CAS.
Footnotes |
| † Electronic supplementary information (ESI) available. See DOI: 10.1039/c9na00291j |
| ‡ Present address: Institute of Chemical Reaction Engineering, University of Erlangen-Nuremberg, 91058 Erlangen, Germany. |
| This journal is © The Royal Society of Chemistry 2019 |

