 Open Access Article
Manipulating acoustic and plasmonic modes in gold nanostars†
Sharmistha
Chatterjee
 abc,
Loredana
Ricciardi
 bc,
Julia I.
Deitz
de,
Robert E. A.
Williams
d,
David W.
McComb
de and
Giuseppe
Strangi
 *abc
*abc
aDepartment of Physics, Case Western Reserve University, 10600 Euclid Avenue, Cleveland, OH 44106, USA. E-mail: Gxs284@case.edu
bCNR-NANOTEC Istituto di Nanotecnologia, Department of Physics, University of Calabria, 87036-Rende, Italy
cFondazione con Il Cuore, Via Roma 170, 88811 Cirò Marina, Italy
dCenter for Electron Microscopy and Analysis, The Ohio State University, Columbus, OH 43212, USA
eDepartment of Material Science and Engineering, The Ohio State University, Columbus, OH 43210, USA
First published on 27th May 2019
Abstract
In this contribution experimental evidence of plasmonic edge modes and acoustic breathing modes in gold nanostars (AuNSs) is reported. AuNSs are synthesized by a surfactant-free, one-step wet-chemistry method. Optical extinction measurements of AuNSs confirm the presence of localized surface plasmon resonances (LSPRs), while electron energy-loss spectroscopy (EELS) using a scanning transmission electron microscope (STEM) shows the spatial distribution of LSPRs and reveals the presence of acoustic breathing modes. Plasmonic hot-spots generated at the pinnacle of the sharp spikes, due to the optically active dipolar edge mode, allow significant intensity enhancement of local fields and hot-electron injection, and are thus useful for size detection of small protein molecules. The breathing modes observed away from the apices of the nanostars are identified as stimulated dark modes – they have an acoustic nature – and likely originate from the confinement of the surface plasmon by the geometrical boundaries of a nanostructure. The presence of both types of modes is verified by numerical simulations. Both these modes offer the possibility of designing nanoplasmonic antennas based on AuNSs, which can provide information on both mass and polarizability of biomolecules using a two-step molecular detection process.
1. Introduction
Label-free detection of protein molecules in their natural state at ultralow concentration is considered as the holy grail of biomedical research.1 But, because of the acutely small size (<3 nm) of single protein molecules, their detection becomes exceptionally challenging.2 One method to deal with this problem is to use the well-known localized surface plasmon effect of noble metal nanoparticles (NPs) which has been used for a wide variety of applications3–7 including sensing,8–10 imaging,11 surface enhanced Raman spectroscopy (SERS),12,13 quantum technologies and miniaturized photonic circuits.14,15 Localized surface plasmon resonance (LSPR) of noble metal NPs can be tuned by changing their size, shape, material and the surrounding dielectric matrix.16,17 NPs with sharp corners like nanotriangles,18 nanocubes,19,20 nanorods,21,22 nanostars,23–26 or octahedral nanoparticles27,28 are able to confine light in ultra-small regions tightly because of the lightning rod effect and the plasmonic resonance effect, resulting in higher electromagnetic energy concentration and thus higher electric field intensity at their hot-spots compared to the non-spiky NPs.29–31 Thus spiky gold nanoparticles are ideal for plasmonic sensing because of their biocompatibility tunability and the large field enhancement at their hotspots. A small change in the surrounding dielectric media after the adsorption of protein molecules at the hot-spots results in a shift of the NP LSPR and thus helps to detect the presence of biomolecules. This opens new opportunities for design of next generation nano-devices for sensing applications.Surface plasmons confined within the geometrical boundaries of flat nanoparticles give rise to radially symmetric plasmonic breathing modes.32,33 A flat metal NP not only has edge modes34 (dipolar, quadrupolar and higher order multipolar modes) because of LSPR, but also supports film modes. Breathing modes are dark modes that cannot be detected by photons as their net dipole moment is zero. However such modes can be detected by inelastic electron scattering in electron energy-loss spectroscopy as the electron wavelength is much smaller than the nanoparticle size.35,36 The breathing modes are very important for near field coupling effects as they have a very high optical mode density. Several groups have investigated breathing modes of different metal nanostructures such as nanodisks,32,35,37 nanoplates,36 core–shell nanoparticles,38,39 nanotriangles,40 nanowires,41,42 nanosphere–nanodisk trimers,43 metal oligomers,44 and graphene nanoellipses45 but breathing modes of AuNSs have never been reported before.
AuNSs, because of having several polarization insensitive hot-spots generated after the interaction of light at the tip of the spikes randomly distributed over their core, are more advantageous than the other spiked nanoantennas like nanoellipsoids and nanorods46–51 which have the ability to concentrate light like nanostars. AuNSs which are well known for their biomedical applications due to their low-toxicity, biocompatibility, high tunability and high electric field intensity enhancement at their hot-spots46–49 have been synthesized using nano-chemistry strategies, including environmentally sensitive “green” synthesis routes52–58 and surfactant-free routes. Here, for our study we have synthesized these highly tunable, stable, efficient AuNSs using a low-cost, simple, one-step (seedless), surfactant-free, high-yield wet chemistry method.59
In this contribution we report experimental evidence of both the plasmonic edge modes and acoustic breathing modes in AuNSs. Results of optical and electron spectroscopy characterization of these highly stable nanoparticles (stability > 5 months in aqueous solution) are reported. Optical characterization provided integrated information regarding the collective behaviour of AuNSs in aqueous suspension while electron energy-loss spectroscopy (EELS), performed using a scanning transmission electron microscope (FEI Titan3 G2 STEM), provided local plasmonic responses of a single AuNS with high spatial resolution. Several groups have investigated plasmonic nanostructures including AuNSs via EELS,60–74 but this high-resolution, low-loss EELS investigation into AuNSs has shown the presence of regular edge plasmon modes along with radial breathing modes, irrespective of the spike length.
This study is also supported by extensive theoretical investigations. The effect of tip displacement in response to excitation of the breathing modes has been calculated using the structural mechanics model of Comsol 5.4 which is based on the Finite Element Method. The maximum intensity enhancement of a single AuNS antenna has been calculated using the Radio Frequency (RF) module of Comsol 5.4. All these results indicate the possibility of creating a device based on the acousto-plasmonic AuNS antenna which will be useful for two-step clinical diagnostics.
2. Results and discussion
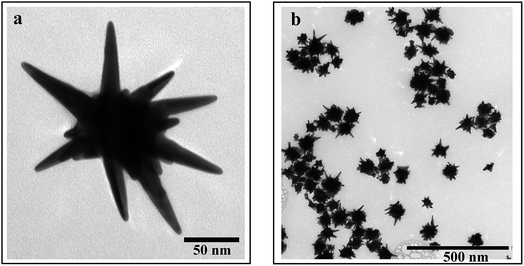
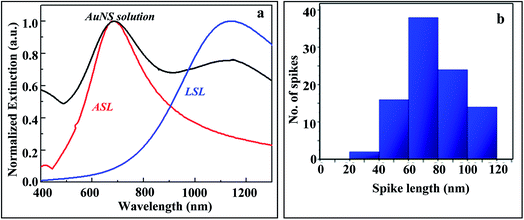
Gold nanostars are synthesized using a one-step (without seed) surfactant-free wet chemistry method as described elsewhere.59 This method is briefly described in the Experimental section. Fig. 1(a) shows a typical high magnification TEM image of a gold nanoparticle while Fig. 1(b) shows a low magnification TEM image where almost all the nanoparticles have at least one spike on their surface, confirming the relatively high yield of the synthesis method. X-ray energy dispersive spectroscopy (XEDS) of the synthesized AuNSs confirms the presence of Au in the nanostars (Fig. S1†).Fig. 2(a) shows a comparative study between the normalized experimental extinction spectrum of the stable AuNS solution collected using a PerkinElmer Lambda 900 spectrophotometer and the corresponding theoretical investigations. Notably, in the experimental extinction spectra two major modes can be seen. The histogram for spike lengths of synthesized AuNSs is shown in Fig. 2(b). The average spike length (ASL) of the nanostars was measured and averaged from TEM images of nearly 100 AuNS nanoparticles and was found to measure 70 nm while the average diameter of the core measured almost 60 nm. The tip radius of the AuNS spike is varied here from 5 nm to 1 nm depending on the spike length. From the histogram in Fig. 2(b) one may observe that the AuNSs with an ASL of 70 nm are dominant in solution. AuNSs with a large spike length (LSL) of 90 nm are the second most dominant type of nanostar in the solution. The histogram in Fig. 2(b) supports the origin of the two peaks observed in the experimental extinction spectra. Complementarily, Finite Element Method (FEM) simulations were performed using Comsol 5.4 for the AuNSs with an ASL of 70 nm and LSL of 90 nm and the same core diameter (60 nm), permitting determination of extinction characteristics. The red and blue curves, shown in Fig. 2(a), represent the theoretically calculated normalized extinction spectra for AuNSs of spike lengths 70 nm and 90 nm, the convolution of which gives the resultant theoretical extinction spectra of the AuNS solution. From this figure we can conclude that the resultant theoretical extinction characteristics match well with the experimental ones, thus confirming our hypothesis.
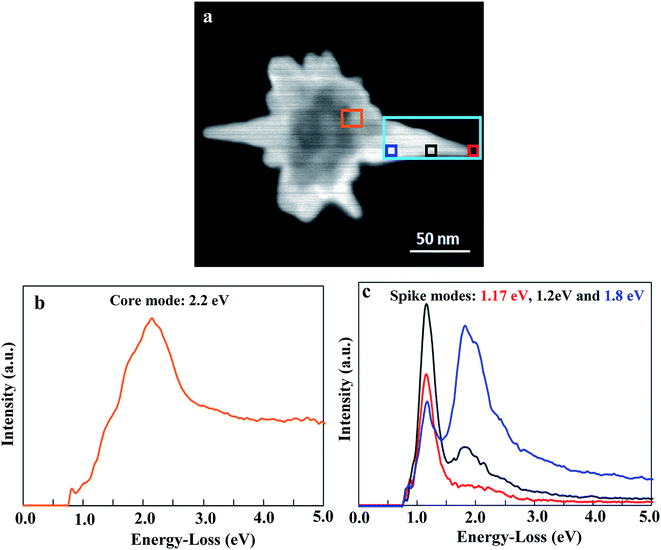
Although optical and computational studies of AuNSs dissolved in aqueous solution provided integrated information about the ensemble behaviour of AuNSs, STEM-EELS measurements revealed localized information about the plasmonic field distribution and resonances for different locations across a single nanostructure. Fig. 3 illustrates the EELS analysis for synthesized AuNSs with a LSL. EELS experiments allowed mapping of plasmonic edge modes in AuNSs and also the excitation and observation of optically dark radial breathing modes. The STEM-HAADF (High Angle Annular Dark Field) image of an AuNS with the LSL which was used for EELS analysis is shown in Fig. 3(a). The regions from which the EELS spectra were mapped and acquired are indicated by the colored boxes on the STEM image. Fig. 3(b) and (c) show the EELS spectra taken at the nanostar core and the nanostar spike. Fig. 3(b) shows a peak at 2.2 eV, which corresponds to the core mode of the AuNS as confirmed by the FEM simulation (Fig. S2†), which shows LSPR at 550 nm (2.2 eV) for a gold core of 60 nm. The strongest mode observed, at the pinnacle of the AuNS spike, was 1.17 eV, corresponding with one extinction peak from the UV-Vis-NIR spectra. FEM simulations carried out on similar types of AuNSs, having an 88 nm spike length and 60 nm core, indicate that the LSPR is expected to occur at 1060 nm (1.17 eV) and thereby confirm the dipolar (bright) edge mode nature at the pinnacle (see Fig. S3†).
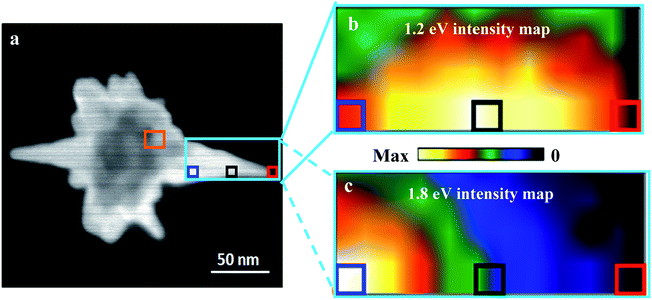
The EELS intensity maps for 1.2 eV and 1.8 eV, shown in Fig. 4(b) and (c), confirm the non-plasmonic edge nature observed at the spike of this AuNS.
During STEM-EELS mapping, a 1.2 eV mode (Fig. 4(b)) was excited and observed in the central region of the spike. This mode shows a very different spatial and intensity distribution with respect to the edge mode. In addition, further away from the pinnacle, a similarly structured mode was observed at 1.8 eV. The comparison of the optical and EELS spectra of several nanostar spikes (small and large spike lengths) shows that the modes in the body of the spike are dark modes, since they cannot be excited by light and they are not observed in the optical spectra. To further confirm their non-plasmonic edge mode character a computational study was performed using FEM based Comsol 5.4 by analysing the mode shape at each mode frequency. Comsol simulations confirmed that the 1.2 eV mode possesses all the features of a radial breathing mode (Fig. 6) and it does not present the characteristic spatial distribution of plasmonic edge modes (dipolar, quadrupolar and higher order modes). However, the EELS maps were obtained by exciting the entire AuNS with a defocused electron beam, unlike the spectra in Fig. 3 obtained by spectrum imaging (SI) with a sub-nm electron probe. EELS intensity maps at 1.2 eV and 1.8 eV clearly show the mode localization away from the AuNS tip.
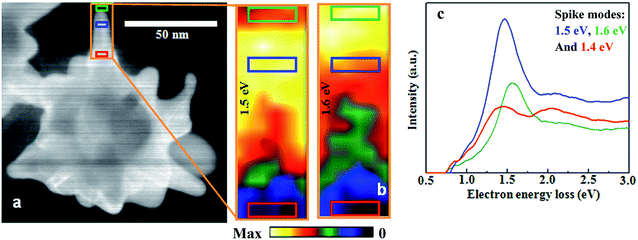
The presence of radial breathing modes and a dipolar edge mode is more evident for short spike than for long spike AuNSs, because of its larger interaction volume. The details of the EELS analysis of the AuNS with a small spike length (SSL) are shown in Fig. 5 and the relevant numerical results are given in Fig. 6.
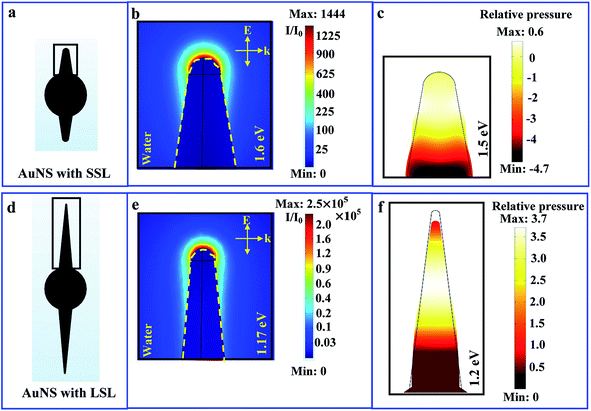
Fig. 6 illustrates the numerical study performed for the various observed modes, both edge and non-edge modes, in a single AuNS with a large spike length (LSL) and a small spike length (SSL), when excited by light and electron beams. Fig. 6(a) shows an illustration of a plasmonic SSL nanostar antenna determined by the quantitative parameters measured from the STEM images. Fig. 6(b) shows the resultant mode distribution at 1.6 eV when excited by light; the mode has its highest intensity at the pinnacle of the AuNS spike, as also observed in the EELS intensity map (Fig. 5(b)). Considering that the skin depth of gold in the wavelength range of 400–1200 nm is smaller than 5 nm, any plasmonic edge mode is not expected to penetrate into the body of the nanoparticle, rather it is confined at the metal–dielectric interface. Moreover, extinction studies also confirm the LSPR of this structure at 1.6 eV; thereby, this mode is a dipolar edge mode. Of note, the yellow dashed line in Fig. 6(b) represents the nanoparticle edge and does not appear to show evidence of structural modification. The intensity map in Fig. 5(b) exhibits an unexpected shape for the 1.5 eV mode; this mode was not observed in the optical extinction spectra, thereby indicating that it is formed by a non-plasmonic nature, as also supported by the simulations. The hypothesis that these modes are of an acoustic nature originated from multiple observations: the appearance of the highest intensity position away from the metal–dielectric interface, the radially symmetric nature of the mode and the corresponding absence of this mode in the extinction spectra, both for theoretical and experimental studies. To confirm this hypothesis, the mode at 1.5 eV of the SSL AuNS was investigated numerically using the structural mechanics module of Comsol 5.4 (the parameters for the simulation are given in the Numerical simulation section).75–77Fig. 6(c) shows the 1.5 eV mode shape and distribution obtained via Comsol simulations for the SSL AuNS. The map of the relative pressure calculated via the structural mechanics module shows that the mode has the familiar, radial symmetry of a typical breathing mode.32–34 The black contour line, shown in Fig. 6(c), represents the unperturbed morphology of the SSL AuNS, whereas the color map shows the relative pressure distribution at 1.5 eV and the modification of the structure because of the acoustic mode. Similarly, Fig. 6(f) shows the simulation obtained via Comsol of the LSL AuNS for the anomalous mode at 1.2 eV, as also shown in Fig. 4(b). Notably, the relative pressure is highest in the middle of the spike of the AuNS resulting in a significant contraction of the same structure. The map of the relative pressure, as calculated by structural mechanics, shows that the 1.2 eV mode exhibits the radial symmetry of a typical breathing mode,32–34 again supporting the acoustic nature of the 1.2 eV mode of the LSL AuNS. Fig. 6(e) conversely shows the results for the analysis of the mode at 1.17 eV of the LSL AuNS, as reported in Fig. 3. The 1.17 eV mode has its highest intensity at the pinnacle of the AuNS spike, as observed in the EELS spectra (Fig. 3(c)). The 1.17 eV mode is a plasmonic edge mode, since its dipolar nature has been confirmed by calculating the LSPR from the extinction spectra and the electric field mapping using the RF module of Comsol 5.4.
Continued analysis of SI data for breathing modes revealed that the 1.5 eV mode is located along the spike where the diameter measured 7.4 nm (Fig. 5), whereas for the LSL AuNS the breathing mode at 1.2 eV is located along the spike where the diameter is 21.4 nm (Fig. 4). For any specific, non-symmetric structure, theoretical calculation of acoustic mode frequency is tedious.78,79 Yet Lamb80 introduced a very simple relationship between the acoustic breathing mode frequency and the size of the structure. According to Lamb's relationship, the acoustic breathing mode frequency varies inversely with the diameter of the spherically symmetric structures. If the spikes of the AuNS are considered to be a parallel combination of many disks,81 – the Lamb principle is also verified here for the two breathing modes – as the mode frequencies vary inversely with the structure diameter.
The plasmonic edge and breathing modes of AuNSs can be synergistically employed to determine the size and mass of target molecules, respectively, by combining the reactive sensing principle for plasmonic biosensing82,83 and a nano-cantilever mechanism. According to the numerical investigation, the field intensity enhancement was found to be approximately 2.5 × 10⁵ in water media for the LSL AuNS at its LSPR (1060 nm). This indicates that the acousto-plasmonic AuNS based nanoantenna – supporting both plasmon edge and breathing modes – can be useful for two-step label free molecular detection at a point-of-care.
3. Conclusions
To summarize, we report the experimental evidence of both plasmonic edge and breathing modes in AuNSs. Here, AuNSs are synthesized via a known simple, one-step, surfactant-free wet-chemistry method with high yield and stability and characterized via optical spectroscopy and EELS. Low-loss EELS provided information about the local plasmonic modes of different regions of the nanostars and indicated the presence of optically dark breathing modes, allowing for the plasmonic edge and breathing modes of the synthesized AuNSs to be harnessed to determine the size and mass of adsorbed analytes based on both a plasmon resonance sensing mechanism and the cantilever principle, irrespective of the molecular shape. This study is also supported by the numerical investigations performed using FEM based Comsol 5.4 which confirms the presence of plasmonic edge and breathing modes in different AuNSs with different spike lengths. The numerical study predicts that for a AuNS nanoplasmonic antenna the field-intensity enhancement factor in the hot-spot region is around 105. This indicates that these efficient acousto-plasmonic AuNS antennas might find applications in two-step label-free clinical diagnostics.4. Experimental section
Materials
Gold(III) chloride trihydrate (HAuCl4, 3H2O), silver nitrate (AgNO3), ascorbic acid (AA), hydrochloric acid (HCl) (35–37%), and polyvinylpyrrolidone (PVP) were purchased from Sigma Aldrich and used as received without further purification. The water used here was reagent-grade, produced using a Milli-Q SP ultrapure-water purification system.Synthesis of the stabilized gold nanostars
At first, 10 ml of a 0.25 mM chloroauric acid (HAuCl4) solution was mixed with 10 μl of a 1 M HCl solution in a glass vial. After that, at room temperature under moderate stirring (700 rpm), 100 μl of a 1 mM AgNO3 solution and 50 μl of a 100 mM AA solution were added simultaneously. Within a few seconds the solution color turned to blue. After 2 minutes from the addition of the AA and AgNO3, 5 ml of 2 mM polyvinylpyrrolidone (PVP) was added and was stirred for another 8 minutes maintaining the same stirring speed. Then the solution was kept for 3 hours at room temperature at rest. Afterwards, one centrifugal wash was performed at 4000 rcf for 20 minutes to wash out the extra PVP. After centrifugation, without disturbing the precipitate, the liquid containing extra PVP and the other chemicals was washed out and the solution was redispersed in DI water. Finally, the AuNS solution was kept at room temperature for future use. The characterization details of these synthesized AuNSs are given below.Characterization
The synthesized nanoparticles are characterized using UV-Vis-NIR spectroscopy and scanning transmission electron microscopy:UV-Vis-NIR spectroscopy
The UV-Vis-NIR spectra of the synthesized gold nanostar solution were obtained using a PerkinElmer Lambda 900 spectrophotometer. The extinction properties of the nanostar solution were measured in a wavelength range of 400 nm to 1300 nm.STEM, XEDS, and EELS measurements
To probe the size and shape of the synthesized nanoparticles, a STEM (monochromated, image-corrected FEI Titan3 G2 STEM) was used. The electronic structure of the synthesized AuNSs was investigated with the help of low-loss EELS, and XEDS was used to determine the gold weight percentage in the solution. Sample preparation was done one day before the STEM measurements by drop casting and then drying the aqueous solution of gold nanoparticles on a standardized holey carbon film supported on a TEM grid. All experiments were performed at 60 kV with a high collection angle (∼25 mrad) to minimize the influence of Cherenkov radiation on the EELS signal.84 The convergence angle and the probe size were measured to be approximately 13.2 mrad and 1.3 angstrom, respectively. The EELS energy resolution which is equivalent to the full width at half-maximum of the zero-loss peak was approximately 150 meV. To resolve the EELS signals spatially along and across each nano-object, spectrum imaging was used. All the EELS data were treated using the Gatan Digital Micrograph software package. No evidence of irradiation impairment was observed in the sample during EEL spectra acquisition. The zero-loss peak for each spectrum was removed using the standard reflected tail method which reflects the tail on the energy-gain side of the spectrum onto the energy-loss side, typically with a pre-defined scaling factor, and subtracts it.85–88Numerical simulation
FEM simulations are used here to find a correlation between the experimental data and the predicted properties of extinction (optical module) and acoustic modes (structural mechanics module) of AuNSs. During simulation, data regarding the different sizes and shapes of AuNS spikes and their cores are obtained from the STEM studies. The study is carried out to map the electric field for plasmonic modes and structural modification of the nanoantennas for phononic modes. The relative pressure due to the excitation of the breathing modes of AuNSs was calculated using the structural mechanics module of COMSOL 5.4 (ref. 75–77) where the mode frequency was obtained from the experimental EELS information. The Radio Frequency (RF) module of Comsol 5.4 is used to investigate the plasmonic modes. Numerical study is also carried out for hybrid AuNS antennas for different sizes of the nanospheres and gaps between each nanoantenna of that heterodimer. Scattering, absorption and extinction cross-sections of the AuNS plasmonic antennas are also calculated here. For the optical simulations the definitions in the Comsol material library are used for all the optical and physical properties of the surrounding media. Simulations considering both air (ε = 1.0) and water (ε = 1.77) as the homogeneous surrounding media are performed here. During this numerical investigation, the wavelength dependent permittivity of gold is obtained from the Johnson and Christy measurements89 and plane waves are used as the excitation source. Electric field polarization of incident light is always chosen along the semi major axis of the AuNS spikes during extinction and electric field mapping. For the simulation of acoustic modes performed in air the material mechanical properties of Au are defined according to the bulk values. Physics controlled free tetrahedral meshes with an extremely fine size for the AuNSs and a normal size for surrounding media have been chosen for all analyses. For the simulation of acoustic modes, performed in air, the material mechanical properties of Au are defined according to the bulk values (Young's modulus = 79 GPa, Poisson's ratio = 0.4, and density = 19![[thin space (1/6-em)]](https://www.rsc.org/images/entities/char_2009.gif) 300 kg m−3). The longitudinal speed of sound in gold is obtained as 3240 m s−1.
300 kg m−3). The longitudinal speed of sound in gold is obtained as 3240 m s−1.
Conflicts of interest
The authors declare no competing financial interest.Acknowledgements
We acknowledge support from the Ohio Third Frontier Project ‘Research Cluster on Surfaces in Advanced Materials (RC-SAM)’ at Case Western Reserve University.References
- N. Rezaei, Cancer Immunology, Springer, New York, 2014 Search PubMed.
- P. N. Prasad, Introduction to Biophotonics, John Wiley & Sons, New Jersey, 2003 Search PubMed.
- J. A. Schuller, E. S. Barnard, W. S. Cai, Y. C. Jun, J. S. White and M. L. Brongersma, Nat. Mater., 2010, 9, 193–204 CrossRef CAS PubMed.
- W. B. Hou and S. B. Cronin, Adv. Funct. Mater., 2013, 23, 1612–1619 CrossRef CAS.
- P. Reineck, G. P. Lee, D. Brick, M. Karg, P. Mulvaney and U. Bach, Adv. Mater., 2012, 24, 4750–4755 CrossRef CAS PubMed.
- H. C. Chen, S. W. Chou, W. H. Tseng, I. W. P. Chen, C. C. Liu, C. Liu, C. L. Liu, C. H. Chen, C. I. Wu and P. T. Chou, Adv. Funct. Mater., 2012, 22, 3975–3984 CrossRef CAS.
- S. S. Kelkar and T. M. Reineke, Bioconjugate Chem., 2011, 22, 1879–1903 CrossRef CAS PubMed.
- K. A. Willets and R. P. Van Duyne, Annu. Rev. Phys. Chem., 2007, 58, 267–297 CrossRef CAS PubMed.
- K. V. Sreekanth, Y. Alapan, M. ElKabbash, E. Ilker, M. Hinczewski, U. A. Gurkan, A. De Luca and G. Strangi, Nat. Mater., 2016, 15, 621–627 CrossRef CAS PubMed.
- K. V. Sreekanth, Y. Alapan, M. ElKabbash, A. M. Wen, E. Ilker, M. Hinczewski, U. A. Gurkan, N. F. Steinmetz and G. Strangi, Adv. Opt. Mater., 2016, 4, 1767–1772 CrossRef CAS PubMed.
- J. S. Sekhon, H. K. Malik and S. S. Verma, RSC Adv., 2013, 3, 15427–15434 RSC.
- B. Sharma, R. R. Frontiera, A. I. Henry, E. Ringe and R. P. Van Duyne, Mater. Today, 2012, 15, 16–25 CrossRef CAS.
- S. M. Nie and S. R. Emery, Science, 1997, 275, 1102–1106 CrossRef CAS PubMed.
- W. L. Barnes, A. Dereux and T. W. Ebbesen, Nature, 2003, 424, 824–830 CrossRef CAS PubMed.
- E. Ozbay, Science, 2006, 311, 189–193 CrossRef CAS PubMed.
- K. L. Kelly, E. Coronado, L. L. Zhao and G. C. Schatz, J. Phys. Chem. B, 2003, 107, 668–677 CrossRef CAS.
- J. A. Scholl, A. L. Koh and J. A. Dionne, Nature, 2012, 483, 421–428 CrossRef CAS PubMed.
- J. Nelayah, M. Kociak, O. Stephan, F. J. Garcia de Abajo, M. Tence, L. Henrard, D. Taverna, I. Pastoriza-Santos, L. M. Liz-Marzan and C. Colliex, Nat. Phys., 2007, 3, 348–353 Search PubMed.
- M. Rycenga, X. Xia, C. H. Moran, F. Zhou, D. Qin, Z. Y. Li and Y. Xia, Angew. Chem., Int. Ed., 2011, 50, 5473–5477 CrossRef CAS PubMed.
- Y. G. Sun and Y. N. Xia, Science, 2002, 298, 2176–2179 CrossRef CAS PubMed.
- H. J. Chen, L. Shao, Q. Li and J. F. Wang, Chem. Soc. Rev., 2013, 42, 2679–2724 RSC.
- S. J. Lee and M. Moskovits, J. Am. Chem. Soc., 2012, 134, 11384–11387 CrossRef CAS PubMed.
- L. Rodríguez-Lorenzo, R. A. Alvarez-Puebla, I. Pastoriza-Santos, S. Mazzucco, O. Stéphan, M. Kociak, L. M. Liz-Marzán and F. J. García de Abajo, J. Am. Chem. Soc., 2009, 131, 4616–4618 CrossRef PubMed.
- H. G. Liao, Y. X. Jiang, Z. Y. Zhou, S. P. Chen and S. G. Sun, Angew. Chem., Int. Ed., 2008, 47, 9100–9103 CrossRef CAS PubMed.
- H. L. Wu, C. H. Chen and M. H. Huang, Chem. Mater., 2008, 21, 110–114 CrossRef.
- X. L. Liu, J. H. Wang, S. Liang, D. J. Yang, F. Nan, S. J. Ding, L. Zhou, Z. H. Hao and Q. Q. Wang, J. Phys. Chem. C, 2014, 118, 9659–9664 CrossRef CAS.
- J. Zhang, Y. Gao, R. A. Alvarez-Puebla, J. M. Buriak and H. Fenniri, Adv. Mater., 2006, 18, 3233–3237 CrossRef CAS.
- C. R. Li, N. P. Lu, J. Mei, W. J. Dong, Y. Y. Zheng, L. Gao, K. Tsukamoto and Z. X. Cao, J. Cryst. Growth, 2011, 314, 324–330 CrossRef CAS.
- V. Giannini, R. Rodríguez-Oliveros and J. A. Sánchez-Gil, Plasmonics, 2010, 5, 99–104 CrossRef.
- R. Alvarez-Puebla, L. M. Liz-Marzan and F. J. García de Abajo, J. Phys. Chem. Lett., 2010, 1, 2428–2434 CrossRef CAS.
- P. G. Etchegoin and E. C. Le Ru, Surface Enhanced Raman Spectroscopy: Analytical, Biophysical and Life Science Applications, Chapter I – “Basic Electromagnetic Theory of SERS”, WILEY-VCH Verlag GmbH & Co. KGaA, Weinheim, 2010 Search PubMed.
- F. P. Schmidt, H. Ditlbacher, U. Hohenester, A. Hohenau, F. Hofer and J. R. Krenn, Nano Lett., 2012, 12, 5780 CrossRef CAS PubMed.
- A. Chakrabarty, F. Wang, F. Minkowski, K. Sun and Q. H. Wei, Opt. Express, 2012, 20, 11615 CrossRef PubMed.
- F. P. Schmidt, H. Ditlbacher, U. Hohenester, A. Hohenau, F. Hofer and J. R. Krenn, Nat. Commun., 2014, 5, 3604 CrossRef PubMed.
- F. P. Schmidt, A. Losquin, F. Hofer, A. Hohenau, J. R. Krenn and M. Kociak, ACS Photonics, 2018, 5, 861 CrossRef CAS PubMed.
- M. Zhao, M. Bosman, M. Danesh, M. Zeng, P. Song, Y. Darma, A. Rusydi, H. Lin, C. W. Qiu and K. P. Loh, Nano Lett., 2015, 15, 8331 CrossRef CAS PubMed.
- M. K. Krug, M. Reisecker, A. Hohenau, H. Ditlbacher, A. Trugler, U. Hohenester and J. R. Krenn, Appl. Phys. Lett., 2014, 105, 1711031–1711033 CrossRef.
- J. E. Sader, G. V. Hartland and P. Mulvaney, J. Phys. Chem. B, 2002, 106, 1399 CrossRef CAS.
- J. H. Hodak, A. Henglein and G. V. Hartland, J. Phys. Chem. B, 2000, 104, 5053 CrossRef CAS.
- A. Campos, A. Arbouet, J. Martin, D. Gérard, J. Proust, J. Plain and M. Kociak, ACS Photonics, 2017, 4, 1257 CrossRef CAS.
- N. Large, L. Saviot, J. Margueritat, J. Gonzalo, C. N. Afonso, A. Arbouet, P. Langot, A. Mlayah and J. Aizpurua, Nano Lett., 2009, 9, 3732 CrossRef CAS PubMed.
- K. Yu, T. A. Major, D. Chakraborty, M. S. Devadas, J. E. Sader and G. V. Hartland, Nano Lett., 2015, 15, 3964 CrossRef CAS PubMed.
- S. Tripathy, R. Marty, V. K. Lin, S. L. Teo, E. Ye, A. Arbouet, L. Saviot, C. Girard, M. Y. Han and A. Mlayah, Nano Lett., 2011, 11, 431 CrossRef CAS PubMed.
- C. Cherqui, N. W. Bigelow, A. Vaschillo, H. Goldwyn and D. J. Masiello, ACS Photonics, 2014, 1, 1013 CrossRef CAS.
- W. Wang and Z. Song, Phys. B, 2017, 530, 142 CrossRef.
- S. A. Maier and H. A. Atwater, J. Appl. Phys., 2005, 98, 0111011 CrossRef.
- H. Wang, D. W. Brandl, F. Le, P. Nordlander and N. J. Halas, Nano Lett., 2006, 6, 827–832 CrossRef CAS PubMed.
- J. W. Liaw, M. K. Kuo and C. N. Liao, Journal of Electromagnetic Waves and Applications, 2005, 19, 1787–1794 CrossRef.
- M. B. Mohamed, V. Volkov, S. Link and M. A. El-Sayed, Chem. Phys. Lett., 2000, 317, 517–523 CrossRef CAS.
- C. F. Bohren and D. R. Huffman, Adsorption and Scattering of Light by Small Particles, Wiley-VCH, New York, 1983 Search PubMed.
- J. D. Jackson, Classical Electrodynamics, Wiley, New York, 1999 Search PubMed.
- L. N. Colleen, H. Liao and J. H. Hafner, Nano Lett., 2006, 6, 683–688 CrossRef PubMed.
- P. S. Kumar, I. Pastoriza-Santos, B. Rodriguez-Gonzalez, F. J. García dé Abajo, F. Javier and L. M. Liz-Marzan, Nanotechnology, 2008, 19, 0156061–0156066 Search PubMed.
- Q. Chen, T. Kaneko and R. Hatakeyama, Condens. Matter, 2014, 1585, 1401–1417 Search PubMed.
- W. Moukarzel, J. Fitremann and J. D. Marty, Nanoscale, 2011, 3, 3285–3290 RSC.
- H. Yuan, C. G. Khoury, H. Hwang, C. M. Wilson, G. A. Grant and T. Vo-Dinh, Nanotechnology, 2012, 23, 075102–075117 CrossRef PubMed.
- A. Kedia and P. S. Kumar, J. Mater. Chem. C, 2013, 1, 4540–4549 RSC.
- S. Chatterjee, A. B. Ringane, A. Arya, G. M. Das, V. R. Dantham, R. Laha and S. Hussain, J. Nanopart. Res., 2016, 18, 242–249 CrossRef.
- S. Chatterjee, L. Ricciardi, J. I. Deitz, R. E. A. Williams, D. W. McComb and G. Strangi, Micromachines, 2018, 9, 664 CrossRef PubMed.
- M. W. Chu, V. Myroshnychenko, C. H. Chen, J. P. Deng, C. Y. Mou and F. J. García dé Abajo, Nano Lett., 2009, 9, 399–404 CrossRef CAS PubMed.
- J. Nelayah, M. Kociak, O. Stephan, F. J. García dé Abajo, M. Tence, L. Henrard, D. Taverna, I. Pastoriza-Santos, L. M. Liz-Marzan and C. Colliex, Nat. Phys., 2007, 3, 348–353 Search PubMed.
- H. Wang, Y. Wu, B. Lassiter, C. L. Nehl, J. H. Hafner, P. Nordlander and N. J. Halas, Proc. Natl. Acad. Sci. U. S. A., 2006, 103, 10856–10860 CrossRef CAS PubMed.
- A. L. Koh, K. Bao, I. Khan, W. E. Smith, G. Kothleitner, P. Nordlander, S. A. Maier and D. W. McComb, ACS Nano, 2009, 3, 3015–3022 CrossRef CAS PubMed.
- J. Morla-Folch, L. Guerrini, N. Pazos-Perez, R. Arenal and R. A. Alvarez-Puebla, ACS Photonics, 2014, 1, 1237–1244 CrossRef CAS.
- Y. Wu, G. Li, C. Cherqui, N. W. Bigelow, N. Thakkar, D. J. Masiello, J. P. Camden and P. D. Rack, ACS Photonics, 2016, 3, 130–138 CrossRef CAS.
- S. Mazzucco, O. Stéphan, C. Colliex, I. Pastoriza-Santos, L. M. Liz-Marzan, F. J. García dé Abajo and M. Kociak, Eur. Phys. J.: Appl. Phys., 2011, 54, 335121–335129 CrossRef.
- F. J. García dé Abajo and M. Kociak, Phys. Rev. Lett., 2008, 100, 1068041–1068044 CrossRef PubMed.
- V. Myroshnychenko, J. Nelayah, G. Adamo, N. Geuquet, J. Rodriguez-Fernandez, I. Pastoriza-Santos, K. F. MacDonald, L. Henrard, L. M. Liz-Marzan, N. I. Zheludev, M. Kociak and F. J. García dé Abajo, Nano Lett., 2012, 12, 4172–4180 CrossRef CAS PubMed.
- A. Losquin, L. F. Zagonel, V. Myroshnychenko, B. Rodriguez-Gonzalez, M. Tence, L. Scarabelli, J. Förstner, L. M. Liz-Marzan, F. J. García de Abajo, O. Stephan and M. Kociak, Nano Lett., 2015, 15, 1229–1237 CrossRef CAS PubMed.
- J. A. Scholl, A. L. Koh and J. A. Dionne, Nature, 2012, 483, 421–427 CrossRef CAS PubMed.
- V. Myroshnychenko, J. Rodríguez-Fernández, I. Pastoriza-Santos, A. M. Funston, C. Novo, P. Mulvaney, L. M. Liz-Marzán and F. J. García dé Abajo, Chem. Soc. Rev., 2008, 37, 1792–1805 RSC.
- S. M. Novikov, A. Sánchez-Iglesias, M. K. Schmidt, A. Chuvilin, J. Aizpurua, M. Grzelczak and L. M. Liz-Marzán, Part. Part. Syst. Charact., 2014, 31, 77–80 CrossRef CAS.
- A. L. Koh, A. I. Fernández-Domínguez, D. W. McComb, S. A. Maier and J. K. W. Yang, Nano Lett., 2011, 11, 1323–1330 CrossRef CAS PubMed.
- F. V. Cube, J. Niegemann, S. Irsen, D. C. Bell and S. Linden, Phys. Rev. B: Condens. Matter Mater. Phys., 2014, 89, 1154341–1154345 Search PubMed.
- Comsol Multiphysics Structural Mechanics—User's Guide, Comsol, 2012, Version: 4.3 Search PubMed.
- T. Schumacher, M. Brandstetter, D. Wolf, K. Kratzer, M. Hentschel, H. Giessen and M. Lippitz, Appl. Phys. B: Lasers Opt., 2016, 122, 1–11 CrossRef CAS.
- L. Wang, T. Sagaguchi, T. Okuhata, M. Tsuboi and N. Tamai, ACS Nano, 2017, 11, 1180–1188 CrossRef CAS PubMed.
- W. M. Visscher, A. Migliori, T. M. Bell and R. A. Reinert, J. Acoust. Soc. Am., 1991, 90, 2154 CrossRef.
- L. Saviot and D. B. Murray, Phys. Rev. B: Condens. Matter Mater. Phys., 2009, 79, 214101–214111 CrossRef.
- H. Lamb, Proc. London Math. Soc., 1882, 13, 189 Search PubMed.
- N. Large, L. Saviot, J. Margueritat, J. Gonzalo, C. N. Afonso, A. Arbouet, P. Langot, A. Mlayah and J. Aizpurua, Nano Lett., 2009, 9, 3732–3738 CrossRef CAS PubMed.
- V. R. Dantham, S. Holler, C. Barbre, D. Keng, V. Kolchenko and S. Arnold, Nano Lett., 2013, 13, 3347–3351 CrossRef CAS PubMed.
- I. Ament, J. Prasad, A. Henkel, S. Schmachtel and C. Sönnichsen, Nano Lett., 2012, 12, 1092–1095 CrossRef CAS PubMed.
- M. Stoger-Pollach, Micron, 2008, 39, 1092–1110 CrossRef CAS PubMed.
- J. I. Deitz, S. Karki, S. X. Marsillac, T. J. Grassman and D. W. McComb, J. Appl. Phys., 2018, 123, 1157031–1157036 CrossRef.
- M. Contreras, J. Tuttle, D. Du, Y. Qi, A. Swartzlander, A. Tennant and R. Noufi, Appl. Phys. Lett., 1993, 63, 1824–1826 CrossRef CAS.
- D. B. Williams and C. B. Carter, Transmission Electron Microscopy: A Textbook for Materials Science, Springer, New York, 2009 Search PubMed.
- Digital Micrograph EELS Analysis User's Guide – EELS Analysis User Guide, Pleasanton, CA, 2003 Search PubMed.
- P. B. Johnson and R. W. Christy, Phys. Rev. B: Solid State, 1972, 6, 4370–4379 CrossRef CAS.
Footnote |
| † Electronic supplementary information (ESI) available: Additional information including XEDS results of synthesized nanoparticles and the FEM simulation results is available. See DOI: 10.1039/c9na00301k |
| This journal is © The Royal Society of Chemistry 2019 |

