 Open Access Article
Design of core–shell titania–heteropolyacid–metal nanocomposites for photocatalytic reduction of CO2 to CO at ambient temperature†
Xiang
Yu
 a,
Simona
Moldovan
b,
Vitaly V.
Ordomsky
 *ac and
Andrei Y.
Khodakov
 *a
*a
aUniv. Lille, CNRS, Centrale Lille, ENSCL, Univ. Artois, UMR 8181 – UCCS – Unité de Catalyse et Chimie du Solide, F-59000 Lille, France. E-mail: vitaly.ordomsky@univ-lille.fr; andrei.khodakov@univ-lille.fr
bGroupe de Physique des Matériaux, CNRS, Université Normandie & INSA Rouen Avenue de l'Université – BP12, 76801 St Etienne du Rouvray, France
cEco-Efficient Products and Processes Laboratory (E2P2L), UMI 3464, CNRS-Solvay, 201108 Shanghai, People's Republic of China
First published on 9th September 2019
Abstract
The photocatalytic conversion of CO2 not only reduces the greenhouse effect, but also provides value-added solar fuels and chemicals. Herein, we report the design of new efficient core–shell nanocomposites for selective photocatalytic CO2 to CO conversion, which occurs at ambient temperature. A combination of characterization techniques (TEM, STEM-EDX, XPS, XRD, FTIR photoluminescence) indicates that the CO2 reduction occurs over zinc species highly dispersed on the heteropolyacid/titania core–shell nanocomposites. These core–shell structures create a semiconductor heterojunction, which increases charge separation and the lifetime of charge carriers' and leads to higher electron flux. In situ FTIR investigation of the reaction mechanism revealed that the reaction involved surface zinc bicarbonates as key reaction intermediates. In a series of catalysts containing noble and transition metals, zinc phosphotungstic acid–titania nanocomposites exhibit high activity reaching 50 μmol CO g−1 h−1 and selectivity (73%) in the CO2 photocatalytic reduction to CO at ambient temperature. The competitive water splitting reaction has been significantly suppressed over the Zn sites in the presence of CO2.
Introduction
The development of human economic activities, especially use of fossil fuel in transportation, industry and household combined with deforestation and land-use changes has led to increase in the concentration of CO2 in the atmosphere from 280 ppm to 390 ppm. The CO2 concentration may reach 500–1000 ppm and cause an average temperature increase of 1.9 °C by 2100.1–4 The carbon dioxide content in the atmosphere can be reduced using carbon capture and storage (CCS) and carbon capture and utilization (CCU).5 An important strategy of CCU is CO2 chemical conversion into useful products.6–10Development of novel carbon dioxide utilization technologies should meet three major challenges:2 design of efficient catalysts, surmounting unfavorable thermodynamics and achieving competitive cost of the CO2-based fuels and chemicals. CO2 chemical conversion is typically an endothermic process that requires a large amount of energy input due to the high thermodynamic stability of CO2.11 Photocatalysis is particularly interesting for CCU, because it can overcome thermodynamic limitations typical of thermocatalytic processes.
One of the most promising technologies for CO2 mitigation is its photocatalytic reduction.12,13 Photocatalytic reduction of CO2 may result in the formation of several compounds: carbon monoxide, formic acid, formaldehyde, methanol, methane, ethane, ethylene and others. The photocatalytic process involves three steps enounced as (i) light harvesting, (ii) charge separation and transport and (iii) CO2 adsorption and catalytic reaction. Major progress has been achieved in the optimization of the first two steps. Low energy efficiency, rapid charge recombination, uncontrollable selectivity (because of the presence of several CO2 reduction products and competing water-splitting reaction) and deactivation are major challenges of the CO2 photocatalytic reduction. In addition, in order to improve the yield of desired products, further information is required about the reaction mechanisms and active intermediates.
Numerous semiconducting materials have been studied for the CO2 photocatalytic reduction. TiO2 has so far been the most studied semiconductor due to its high chemical stability, availability and low toxicity.13,14 The selectivity of carbon dioxide reduction principally depends on the structure and catalytic properties of co-catalysts, which intervene in the third step of the photocatalytic process such as reduction of CO2 or water splitting. As summarized by Ran et al.,15 cocatalysts can promote separation and migration of photoexcited electron–hole pairs. The CO2 reduction selectivity to specific products and semiconductor stability can be therefore improved and the side reactions are impeded. The photocatalytic CO2 reduction rate is a function of several cocatalyst parameters such as dispersion of active phase, porosity, basicity, oxygen vacancies, and presence of functional groups.
Several groups of cocatalysts have been proposed for CO2 photocatalytic reduction: noble metals,15 metal oxides (CuO,16,17 ZnO,18 CeO2,19 Zn2GeO4,20 ZnGa2O4 (ref. 21) and BiWO6 (ref. 22)), metal complexes,23 metal–organic-frameworks,24 carbon nitrides,25–29 sulfides30 or biological systems.31,32 Noble metal-based cocatalysts represent almost a half of studied systems. However, the high price and rarity of noble metals significantly limit their possible industrial use for photocatalytic CO2 reduction. Use of transition metal oxides as cocatalysts seems to be an interesting route for design of efficient photocatalysts for the CO2 hydrogenation. In addition, the photocatalytic performance in the CO2 hydrogenation can be further enhanced by semiconductor heterojunction.33 This heterojunction can be created by adding to TiO2 a semiconductor with lower levels of valence and conduction bands. This heterojunction can be achieved by combining TiO2 with a heteropolyacid (H3PW12O40). The valence and conduction bands of phosphotungstic acid are located lower34–36 than for TiO2,34,37 which may result in better charge separation and higher electron flux from TiO2 onto HPW. Recently, we developed zinc-modified heteropolyacid–titania nanocomposites, which exhibit selective carbon monoxide production from methane at ambient temperature.38 In the present study, we report for the first time that the specifically designed Zn–HPW/TiO2 core–shell systems exhibited high photocatalytic activity in the selective conversion of carbon dioxide to carbon monoxide in the presence of water. In situ study of the reaction mechanism by IR and XPS has provided important insights into the reaction mechanism. We uncovered that CO was produced during the decomposition of zinc bicarbonate in the presence of H2O under light at ambient temperature.
Experimental
Synthesis of the metal–HPW/TiO2 composite catalysts
The catalysts were prepared using TiO2 (P25, 20% rutile and 80% anatase). The two-step impregnation was used for synthesis of the metal–HPW/TiO2 composites. An anhydrous ethanol solution of phosphotungstic acid hydrate (H3[P(W3O10)4]·xH2O, HPW) was first prepared. Then, TiO2 was suspended in this solution with the ratio of HPW to TiO2 varying from 0.15 to 0.6. Ethanol was removed from the suspension under stirring by drying at 353 K for 12 h. Dry HPW–TiO2 solid was obtained. The aqueous solutions of metal salts were used for the synthesis of the Me–HPW/TiO2 catalyst via incipient wetness impregnation of HPW/TiO2. The following metal salts were used: Zn(NO3)2·6H2O, Fe(NO3)3·9H2O, NH4VO3, Co(NO3)3·6H2O, Ce(NO3)3·6H2O, Ga(NO3)3·xH2O, Cu(NO3)2·3H2O, AgNO3 and Pd(NO3)2·xH2O. The catalysts were labelled as M–HPW/TiO2, where M stands for V, Fe, Ga, Ce, Co, Cu, Ag, Pd and Zn. The targeted concentration of the metals in the final catalysts was 6 wt%. The impregnated catalysts were dried overnight in an oven at 373 K followed by calcination in air at 300 °C for 3 h (2 °C min−1 temperature ramping).Characterization
The elemental composition of the catalysts was determined with an M4 TORNADO energy-dispersive micro-X-ray fluorescence (XRF) spectrometer (Bruker). A Bruker AXS D8 diffractometer with Cu Kα radiation (λ = 0.1538 nm) was used to measure XRD patterns in the 5–80° (2θ) range. FTIR spectra have been collected using a Thermo iS10 spectrometer at a 4 cm−1 resolution (0.96 cm−1 data spacing). Thermo software (Omnic) was used for spectrum analysis. A PerkinElmer Lambda 650 S UV/vis spectrometer equipped with an integrating sphere provided the diffuse reflectance UV-visible spectra. Barium sulphate was used as reference.The Transmission Electron Microscopy (TEM) observations of the samples were performed on a Tecnai instrument and a double corrected Cold FEG ARM Jeol 200 (field emission gun), operated at 200 kV. The Tecnai microscope was equipped with a LaB6 crystal. Prior to the analysis, the samples were dispersed by ultrasound in ethanol for 5 min, and a drop of solution was deposited onto a carbon membrane onto a 300 mesh-copper grid. The microscopy based analysis was carried out in the scanning TEM mode on the double corrected Cold FEG ARM Jeol 200 (field emission gun) microscope and using the 100 mm Centurio detector for the energy dispersive X-rays (EDX) equipped with this TEM. The point-to-point resolution reached was of the order of 78 pm under the parallel TEM mode and 0.9 Å under the STEM mode using the Z-sensitive high angle annular dark field HAADF-STEM imaging. The EDX elemental maps were obtained using scanning speeds of 20 μs px−1 for imaging and 0.05 μs px−1 for EDX (256 × 256 px maps), with a 0.1 nm probe size and a current of 120 pA. Under these conditions and in an effort to achieve a high signal to noise ratio the chemical maps were acquired for at least 60 min.
The photoluminescence spectroscopy measurements were performed on a LabRam HR (Horiba Scientific). For excitation, 325 nm radiation from a diode-pumped solid-state 300 μW laser was used. The spectrophotometer has an entrance slit of 100 μm, and is equipped with a 300 lines per mm grating that permits achieving a spectral resolution of 3.8 cm per pixel. The luminescence light was detected with a CCD camera operating at 138 K. The XPS spectra were recorded using a Kratos Axis spectrometer, equipped with an aluminum monochromator for a 1486.6 eV source working at 120 W. All spectra were calibrated with the binding energy of Al 2p at 74.6 eV.
Photocatalytic tests
The photocatalytic reduction of CO2 in water was carried out in a homemade stainless-steel batch reactor (∼250 mL) with a quartz window on the top of the reactor (Fig. S1, ESI†). The light source was a 400 W Xe lamp (Newport). First, 0.1 g of solid catalyst was placed on a quartz glass holder on the middle of the reactor, which was held by a Teflon stick. Liquid water with a volume of 15 mL was added in the bottom of the reactor. Then, the reactor was filled with CO2. The CO2 pressure was increased up to 0.2 MPa. The catalyst was exposed to CO2 and H2O vapor. The temperature of the reactor was kept at 323 K, and the vapor pressure of H2O was 12.3 kPa. The photocatalytic reaction time was typically 6 h and varied from 1 to 40 h. The reaction products (CO, CH4, O2 and H2) were analyzed by gas chromatography (GC, PerkinElmer Clarus® 580). The reaction system was connected to an online GC injection valve, and the gaseous products were injected with the loop into the GC for analysis. The GC was equipped with PoraBOND Q and ShinCarbon ST 100/120 columns, a flame ionization detector (FID) and a thermal conductivity detector (TCD). Helium or argon was used as the carrier gas.Results & discussion
CO2 conversion over titania–heteropolyacid–metal nanocomposites to CO at ambient temperature
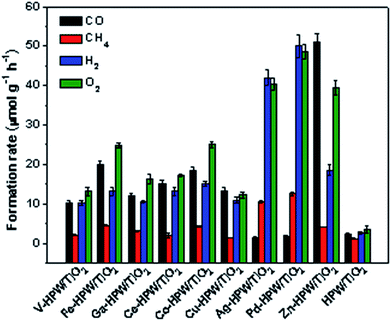
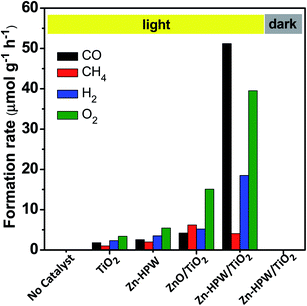
The photocatalytic conversion of CO2 in the presence of water vapor was investigated for a series of catalysts supported on the HPW/TiO2 composites (Fig. 1). Carbon monoxide, oxygen, methane and hydrogen were detected as reaction products on these solids exposed to light irradiation using a 400 W Xe lamp. No oxygenates (alcohols, aldehydes etc.) were observed. No CO2 conversion and reaction products were observed in the experiments without irradiation (dark). This confirms that the CO2 catalytic conversion is indeed driven by light. Addition of noble or transition metals including Ag, Pd, V, Fe, Ga, Ce, Co, Cu and Zn to the HPW/TiO2 composites enhances the CO2 and water reduction compared to the pristine HPW/TiO2 composite (Fig. 1). Note that the reaction selectivity and product formation rates strongly depend on the type of metal. Much higher H2 and O2 production rates were observed over the catalysts containing noble metals. The production of hydrogen indicates a photocatalytic water-splitting reaction, which occurs over these catalysts alongside with CO2 conversion to CO.12,39 The CO formation rates were higher over the catalysts containing transition metals than those with noble metal catalysts, while the formation rates of methane, H2 and O2 were higher with the latter catalysts. The Zn containing catalyst showed extremely high rate of the CO2 reduction to CO compared to all studied transition and noble metal containing samples.In order to provide further insights into the catalytic performance of the Zn-containing catalysts, a series of catalysts with different compositions were prepared from HPW and TiO2 with and without zinc and then tested in the photocatalytic reduction of CO2 (Fig. 2). The promotion of pure TiO2 or HPW with Zn results only in a slight increase in the CO2 conversion rate compared to the pristine semiconductors.
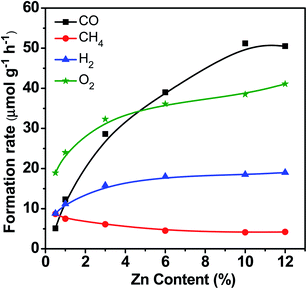
Fig. 3 displays the catalytic performance data of Zn–HPW/TiO2 with different Zn contents. The Zn metal content in the composite catalysts after preparation and calcination measured by the XRF technique is given in Table S1, ESI.† It was between 0.5 and 12 wt%. It is clear that higher Zn loading significantly enhances the CO, O2 and H2 formation rates, while the rate of methane production decreases at high zinc content. Note also that higher Zn content leads to higher selectivity to CO and lower hydrogen selectivity. This suggests less significant water splitting at higher zinc content.
Another catalyst parameter, which may affect the catalytic performance, is the HPW/TiO2 ratio in the Zn/HPW–TiO2 composite. Fig. S2, ESI† shows the carbon monoxide, oxygen, hydrogen and methane production rates over the Zn–HPW/TiO2 catalysts with different ratios of HPW to TiO2. In these catalysts, the ratio of Zn to HPW was kept at 2. Note that a higher HPW/TiO2 ratio in the catalysts results in a slight increase in the rate of CO production, whereas the rates of formation of other products were affected to a lesser extent by the HPW/TiO2 ratio. Furthermore, photocatalytic CO2 reduction was investigated as a function of carbon dioxide pressure (Fig. S3, ESI†). The CO2 pressure has a mild effect on the CO2 conversion rate and selectivity.
Thus, the presence of three components, TiO2, HPW and Zn, is required in order to attain a major increase in the CO production from CO2. Importantly, the selectivities were also very different over the Zn–HPW/TiO2 three-component catalyst as compared to the binary Zn/HPW and Zn/TiO2 systems. CO and oxygen were major products over Zn–HPW/TiO2 composites, while the rates of CO and hydrogen production (because of the water splitting reaction) were comparable over the binary catalysts (Fig. 2).
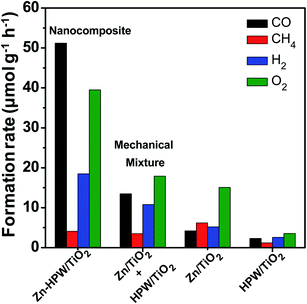
Mechanical mixtures of Zn/TiO2 with HPW/TiO2 were then prepared for the CO2 photocatalytic reduction. The activity of the Zn/TiO2–HPW/TiO2 mechanical mixture (Fig. 4) was much higher than over pure Zn/TiO2 and HPW/TiO2. This is indicative of the interaction between Zn/TiO2 and HPW/TiO2 under the reaction conditions. One of the possible explanations can be Zn migration from Zn/TiO2 to the HPW/TiO2 sample leading to the Zn/HPW–TiO2 composite.
Catalyst characterization
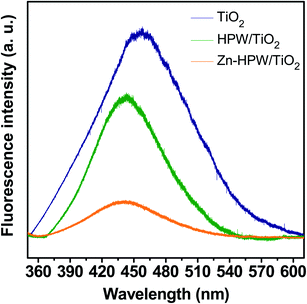
The structure of the Zn–HPW/TiO2 catalysts was then investigated using several characterization techniques. Fig. S4, ESI† displays XRD patterns of the Zn–HPW/TiO2, ZnO/TiO2, HPW/TiO2, TiO2 and HPW samples. The XRD peaks of anatase and rutile phases were detected in the samples containing TiO2, while the HPW sample showed the presence of XRD peaks assigned to the H3[P(W3O10)4] heteropolyacid. The absence of diffraction peaks attributed to the HPW and Zn phases in Zn–HPW/TiO2 can indicate high HPW and Zn dispersion and smaller crystallite sizes. No XRD patterns attributed to crystalline zinc carbonate were observed in any sample. Hexagonal wurtzite ZnO phase (♦ symbol, JCPDS #36-1451) was identified in Zn/TiO2 from the diffraction peaks at 31.8° and 34.4° attributed to crystal faces (100) and (002).40,41 The ZnO XRD peaks disappear in the Zn–HPW/TiO2 catalysts. This indicates high dispersion of zinc species in the presence of HPW.Photoluminescence (PL) spectroscopy (Fig. 5) is a powerful tool that provides information on the surface processes involved in the recombination of photogenerated charge carriers. We observed a visible luminescence band centered at ∼450 nm for TiO2.42,43 The intensity of the luminescence band at ∼450 nm, which was caused by the recombination of photogenerated electron–hole pairs, decreased in the order of TiO2 > HPW/TiO2 > Zn–HPW/TiO2. The lower intensity of the luminescence band suggests that the Zn–HPW/TiO2 composite is the most efficient for the separation of photogenerated electron–hole pairs. This can be explained by the migration of excited electrons from TiO2 to the HPW and Zn phases, preventing the electron–hole recombination. This effect is discussed in detail below in the manuscript. It has been observed earlier for other photocatalytic reactions occurring in the presence of HPW.44
FTIR analysis has been used to identify Zn species and catalyst acidity. Fig. 6 shows the FTIR spectra of the Zn–HPW/TiO2 composites with different Zn contents. The two strong bands at 1410 and 1310 cm−1 attributed to carbonate species and a shoulder at 1490 cm−1 are observed for the catalysts at zinc content higher than 1 wt%. In agreement with a previous report,45 these intense bands can be attributed to mono-dentate carbonates. Interestingly, at much higher zinc contents, two new FTIR bands appear at 1634 cm−1 and 1390 cm−1. The bands at 1634 and 1390 cm−1 can be assigned to the bicarbonate species (HCO3−).46,47 The assignment of the bands at 1634 and 1390 cm−1 to bicarbonates is also confirmed by a significant increase in the intensity of the FTIR band at 3300 cm−1 attributed to the OH stretching vibrations. It can be tentatively suggested that the new species identified from the bands at 1634 and 1390 cm−1 correspond to zinc bicarbonates containing OH groups, though some contribution of chemisorbed water molecules to the intensity of the bands at 1634 cm−1 and 3300 cm−1 cannot be excluded. After the catalyst dehydration at 473 K, these bands transform into the bands at 1560 and 1285 cm−1, which might be assigned to νas(CO3) and νs(CO3) of bidentate Zn carbonate species (Fig. S5, ESI†).
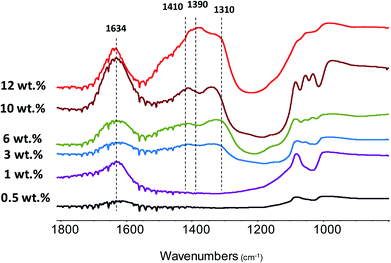 | ||
| Fig. 6 FTIR spectra of the Zn–HPW/TiO2 catalysts with different Zn contents. The spectra were recorded without preliminary pretreatment and are offset for clarity. | ||
Two new strong bands at 1621 and 1453 cm−1 appear after adsorption of Py over the catalyst evacuated at 200 °C. These bands might be attributed to the complexes of Py with strong Lewis acid sites.48 The Lewis acidity can be related to unsaturated Zn2+ ions. Interestingly, no Brønsted acidity associated with HPW was observed in the samples with zinc. This suggests full neutralization of the HPW Brønsted acidity by Zn2+ ions located in the cationic sites of HPW. Indeed, in the Zn–HPW/TiO2 catalyst (6 wt% Zn), the maximum concentration of potential Brønsted acid sites associated with HPW is only 0.3 mmol g−1, while the amount of zinc is three times higher (0.9 mmol). Thus, Zn should be mostly present as cationic Zn, carbonate, bicarbonate or oxide. It is known that ZnO has high basicity. This would favor adsorption of CO2 from the atmosphere resulting in zinc carbonates.49
The UV-vis diffuse reflectance spectra of the Zn–HPW/TiO2 nanocomposite and reference compounds are displayed in Fig. S6, ESI.† Intense absorption in the ultraviolet region (<400 nm) was observed. The band gap energy for different nanocomposites was estimated using Tauc's plots of UV-vis spectra. The band gap varies from 3.0 eV to 3.2 eV. A relatively small effect of the promotion with Zn is observed on the band gap of HPW (Eg = 3.12 eV) and TiO2 (Eg = 3.20 eV (ref. 50)). Note that both zinc oxide and zinc carbonate have semiconductor properties; their band gaps vary from 3.12 to 3.36 eV.51,52
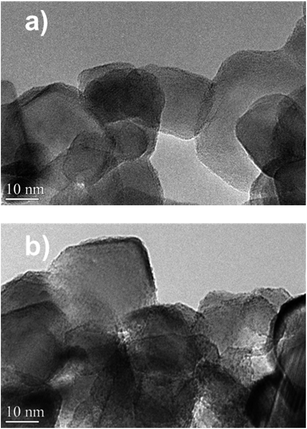
The catalysts were characterized by high-resolution transmission electron microscopy (HRTEM), high angle annular dark-field scanning TEM (HAADF-STEM) and STEM-EDX elemental mapping (Fig. 7a and 8). The Zn–HPW/TiO2 composite shows the presence of two populations of particles: highly faceted NPs with sizes >100 nm and smaller faceted NPs with sizes between 10 and 50 nm (Fig. S7, ESI†). Fig. 7b displays TEM images of the spent catalyst. Interestingly, the HPW shell remains almost intact after the photochemical reduction of CO2 and no noticeable sintering of zinc species was observed. The clearly observed separation of the TiO2 and HPW phases in the photocatalyst core–shell structure is indicative of a possible semiconductor heterojunction, which might affect the photocatalytic properties.
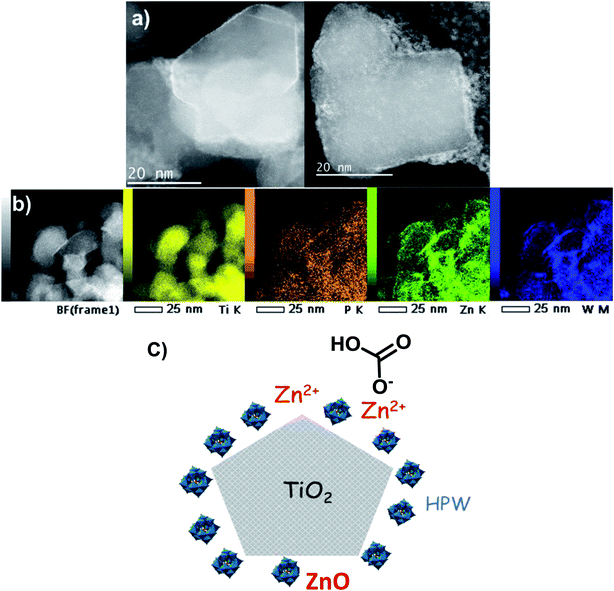 | ||
| Fig. 8 (a) HAADF-STEM micrographs, (b) STEM-EDX elemental maps of Zn–HPW/TiO2 catalyst and (c) a diagram of the Zn–HPW/TiO2 catalyst structure. | ||
The enhanced contrast achieved in the high-resolution STEM-HAADF micrographs (Fig. 8a and S8, ESI†) is due to the difference in the Z-atomic number of the constituents. Therefore, the presence of the lighter shell (1–2 nm) is associated with the presence of the HPW embedding the TiO2, as anticipated by the previous TEM observations. This issue is further confirmed by the STEM-EDX elemental maps corresponding to Ti, O, W and Zn (Fig. 8b). Here, Ti defines the faceted grains, whilst the TiO2 edges appear to be covered by the W and P from the HPW heteropolyacid. The Zn is present as small nanoparticles and/or clusters highly dispersed on the catalyst surface (light-grey circular nanoparticles in the right side image in Fig. 8a), with a slight tendency of agglomeration at the TiO2 rims, similar to tungsten and phosphorus. The diagram of the proposed structure for the Zn–HPW/TiO2 catalyst is presented in Fig. 8c.
To provide further insights into the zinc oxidation state and its evolution during the reaction, both the calcined Zn–HPW/TiO2 catalyst and its spent counterpart after the reaction were characterized by XPS (Fig. S9, ESI†). XPS is indicative of the presence of Zn2+ species in the calcined catalysts, which were identified by the Zn 2p binding energies at 1021.9 eV. No changes were noticed in the Zn 2p3/2 XPS binding energy after catalyst exposure to CO2 and H2O53,54 (Fig. S9, ESI†). It is known that Auger spectroscopy is more sensitive than the XPS binding energy to the changes in the Zn valence state (Fig. S10, ESI†). The Zn Auger peak from Zn–HPW/TiO2 catalysts is normalized to the peak height of the ZnO Auger feature. The positions of all Auger peaks are aligned by the C 1s peak, and a Shirley background was subtracted. Note however that the Auger peaks were similar for the fresh Zn catalyst and that after conducting the catalytic reaction. Thus, Auger spectroscopy also suggests no changes in the oxidation state of Zn during the reaction.
Mechanistic aspects of CO2 photo-reduction to CO
Additional experiments were conducted to investigate in detail the reaction paths of the CO2 photocatalytic reduction over the Zn–HPW/TiO2 composites. Table 1 shows the CO, CH4 and H2 reaction rates measured in CO2 in the presence of water, in a dry atmosphere and in the presence of hydrogen. Higher CO formation rate was observed in the presence of water. Note that the CO formation rates were extremely low in the absence of water; no methane was produced in the dry atmosphere even in the presence of added hydrogen. This is indicative of the critical role of water in this reaction.| Catalyst | Reaction atmosphere | Formation rate (μmol g−1 h−1) | ||
|---|---|---|---|---|
| CO | CH4 | H2 | ||
| a Reaction conditions: catalyst, 0.1 g; gas phase pressure, CO2 0.2 MPa; H2O, 15 mL. b Reaction conditions: catalyst, 0.1 g; CO2 pressure, 0.2 MPa. c Reaction conditions: catalyst, 0.1 g; H2/CO2 = 1/10; irradiation time, 6 h. | ||||
| Zn–HPW/TiO2 | CO2 + H2O vapora | 51 | 4.1 | 19 |
| CO2b | 0.42 | 0 | 0 | |
| CO2 + H2c | 0.51 | 0 | ||
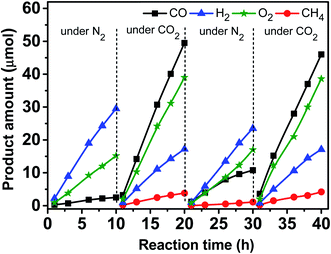
Fig. 9 shows variations of the product amounts with the reaction time during the photocatalytic reduction of CO2 over the Zn–HPW/TiO2 catalyst. First, the catalyst was exposed to irradiation in nitrogen in the presence of water, but without CO2. Mostly hydrogen, oxygen and small amounts of carbon monoxide (∼2.5 μmol in 10 h) were produced. The small amounts of CO can possibly come from decomposition of surface zinc bicarbonate detected in the calcined catalysts by FTIR. Second, the system was degassed, and then the CO2 was introduced into the system. Fig. 9 shows that CO2 was converted to CO and CH4 in the presence of H2O vapor. Some amounts of oxygen were also produced. Note also the production of H2, which is probably generated from H2O splitting. Third, after the catalytic test for 10 h, the reactor was degassed again and N2 was reintroduced into the system. Note that the amount of CO was larger than that formed in the first step, and only a trace amount of CH4 was detected (<1.0 μmol in 10 h). This confirms that the surface zinc carbonate was formed on the catalyst in the presence of CO2 and its decomposition yields CO. Finally, in the fourth step, CO2 and water were again introduced into the reactor (Fig. 9). Similar CO, CH4, O2 and H2 formations were again observed. Interestingly, the reaction rates were similar to those in the second step. This suggests that the Zn–HPW/TiO2 catalyst can operate with the same activity after several reaction cycles and does not deactivate after the 40 h test.
The CO2 photoreduction in the presence of water vapor is likely to proceed via adsorption of the reactants (CO2 and H2O) on the catalyst surface followed by photo-induced electron and hole transfer.55 Adsorption of CO2 onto the surface of the photo-catalyst, which results in zinc carbonate, may be an initial step in the CO2 reduction. Single electron transfer to form surface-bound CO2/CO2− is thought to trigger a series of chemical reactions [eqn (1)]. However, this process is highly thermodynamically unfavorable because of the high negative redox potential of 1.85 V (vs. NHE at pH = 7).56,57 In contrast, an alternative and more favorable process to reduce CO2 can occur through the proton-assisted multi-electron transfer with relatively lower redox potential, as shown in eqn (1)–(5). The interaction of CO2 with protons and electrons lowers to some extent the reaction redox potential. This transfer was already suggested for many CO2 photo-reduction systems.56,58–61
| CO2 + e− → CO2− | (1) |
| CO2 + 2e− + 2H+ → CO + H2O | (2) |
| CO2 + 6e− + 6H+ → CH3OH + H2O | (3) |
| CO2 + 8e− + 8H+ → CH4 + 2H2O | (4) |
| 2H+ + 2e− → H2 | (5) |
It is interesting to note that the rate of water splitting reaction slows down in the presence of CO2 in comparison with the test in an inert atmosphere. This suggests some competition between water and CO2 for the catalyst active sites, which can produce either hydrogen or CO.
TEM and STEM-EDX (Fig. 8) indicate the presence of core shell structures with the shell formed by HPW and core, which contains TiO2. These core–shell structures are expected to create a semiconductor heterojunction (Fig. 10, band levels from ref. 34), which would increase charge separation and the lifetime of the charge carriers.33 This could also build up the electrical potential. In the presence of irradiation and electric field, the electrons are transferred to the conduction band of the p-type semiconductor (HPW) and the holes to the valence band of the n-type semiconductors (TiO2). This will increase electron concentration over HPW and hole concentration in TiO2. Consequently, the HPW ability for electron transfer and carbon dioxide reduction will be enhanced. Water oxidation will be enhanced by higher concentrations of holes on the surface of TiO2 (Fig. 10). The characterization techniques did not reveal the presence of a ZnO crystalline phase. Indeed, XRD, imaging techniques and FTIR indicate the presence of isolated Zn2+ species, possibly zinc cations in the cationic sites of HPW and extremely small zinc oxide clusters. These highly dispersed zinc species do not have any semiconductor band structure. Zinc located on the surface of HPW seems to play the role of a cocatalyst by providing active sites for fixing CO2 on the surface and facilitating subsequent reduction.
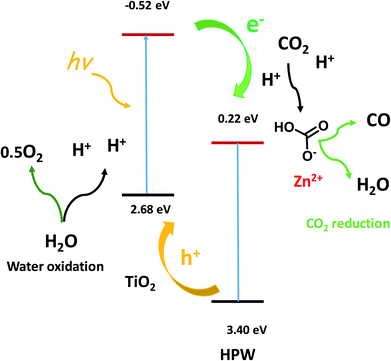 | ||
| Fig. 10 Elementary steps in the CO2 photocatalytic reduction to CO. Band levels versus NHE.34 | ||
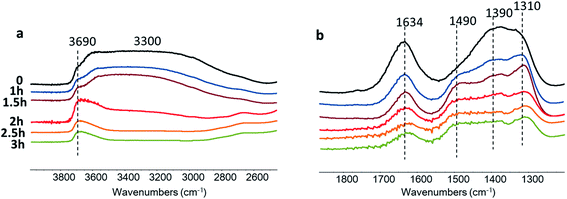
Further information about the catalytic role of Zn species in the CO2 reduction was obtained using in situ FTIR spectroscopy (Fig. 11). The experiments were conducted in a Pyrex cell in the presence of carbon dioxide and water with catalyst exposure to the irradiation through Pyrex and KBr windows. The Zn–HPW/TiO2 catalyst pellet was saturated with water vapors and the cell was filled with CO2. The pretreated sample exhibits FTIR bands at 1634, 1490, 1390 and 1310 cm−1. The bands at 1310 and 1490 cm−1 might be assigned to mono-dentate carbonates (Fig. 11).62,63 The bands at 1634 and 1390 cm−1 correspond to bicarbonate (Fig. 11). Interestingly, the intensity of the band at 1634 cm−1 always correlates with the intensity of the bands at 1390 cm−1.
Catalyst exposure to light for 3 h leads to a gradual decrease in the intensity of the bands at 1634 and 1390 cm−1 assigned to the bicarbonates containing OH groups (Fig. 11a). The intensity of the band of OH stretching vibration (3690 and 3300 cm−1) decreases simultaneously with the bands attributed to bicarbonate. Indeed, the concentration of the bicarbonate containing hydroxyl groups decreases during the reaction. A similar correlation between the intensity of bicarbonate FTIR band and that of the hydroxyl groups was observed in a previous report.46
The intensities of the bands at 1490 and 1310 cm−1 corresponding to mono-dentate carbonates are affected to a lesser extent by the reaction. This indicates higher reactivity of the zinc bicarbonates as compared to monodentate carbonates. One of the reasons for the higher reactivity of bicarbonates can be due to localization of protons in a close proximity to the carbonate fragments. The decomposition of these bicarbonates under irradiation provides carbon monoxide and oxygen. The analysis of the gas phase during the in situ experiments (Fig. S11, ESI†) shows the presence of P (<2140 cm−1) and R (>2140 cm−1) branches of gaseous CO.64 Thus, these results clearly show that the observed decomposition of carbon bicarbonates results in carbon monoxide production. The performance of the developed catalyst can further be improved by optimization of the reaction conditions and catalyst promotion.
Conclusion
Among a series of metal catalysts supported on the composite materials on the basis of TiO2 and phosphotungstic acid, zinc-containing counterparts showed extremely high activity and selectivity in the carbon dioxide reduction to carbon monoxide in the presence of water vapor. The heteropolyacid forms a thin layer over titania nanoparticles. The enhanced activity in the photocatalytic reduction of carbon dioxide to carbon monoxide was attributed to the formation of a semiconductor heterojunction, which slows down charge recombination and facilitates electron transport to Zn species highly dispersed over HPW. The CO2 reduction to CO proceeds via formation of zinc bicarbonate species over the heteropolyacid. No visible deactivation was observed, the catalyst was stable after conducting several reaction cycles for more than 40 h of reaction. No changes of zinc oxidation state or zinc sintering were observed under the reaction conditions. The in situ FTIR experiments suggest that the reaction involves zinc bicarbonates containing hydroxyl groups. The decomposition of these zinc bicarbonate species under irradiation leads to the selective production of carbon monoxide, while water oxidation leading to O2 takes place over TiO2.Conflicts of interest
There are no conflicts to declare.Acknowledgements
The authors thank Laurence Burylo, Pardis Simon, Myriam Moreau and Martine Frère for help with XRD, PL and XPS measurements. X. Y. thanks the Chinese scholarship council for providing him a stipend for PhD studies in France. The authors acknowledge support from the CNRS GDR “Solar Fuels”. GENESIS is supported by the Région Haute-Normandie, the Métropole Rouen Normandie, the CNRS via LABEX EMC and the French National Research Agency as a part of the program “Investissements d'avenir” with the reference ANR-11-EQPX-0020.References
- M. Aresta and A. Dibenedetto, Dalton Trans., 2008, 28, 2975–2992 Search PubMed.
- V. V. Ordomsky, A.-B. Dros, R. Schwiedernoch and A. Y. Khodakov, Challenges and Role of Catalysis in CO2 Conversion to Chemicals and Fuels, Nanotechnology in Catalysis: Applications in the Chemical Industry, Energy Development, and Environment Protection, ed. B. Sels and M. Van de Voorde, Wiley-VCH Verlag GmbH & Co. KGaA, 1st edn, 2017 Search PubMed.
- J. Vergara, C. McKesson and M. Walczak, Energy Policy, 2012, 49, 333–345 CrossRef.
- Z. Sun, N. Talreja, H. Tao, J. Texter, M. Muhler, J. Strunk and J. Chen, Angew. Chem., 2018, 57, 7610–7627 CrossRef CAS PubMed.
- A. El Mekawy, H. M. Hegab, G. Mohanakrishn, A. F. Elbaz, M. Bulut and D. Pant, Bioresour. Technol., 2016, 215, 357–370 CrossRef CAS PubMed.
- M. Mikkelsen, M. Jørgensen and F. C. Krebs, Energy Environ. Sci., 2010, 3, 43–81 RSC.
- S. Xie, Q. Zhang, G. Liu and Y. Wang, Chem. Commun., 2016, 52, 35–59 RSC.
- W. Tu, Y. Zhou and Z. Zou, Adv. Mater., 2014, 26, 4607–4626 CrossRef CAS PubMed.
- A. Corma and H. Garcia, J. Catal., 2013, 88, 168–175 CrossRef.
- Y. Ma, X. Wang, Y. Jia, X. Chen, H. Han and C. Li, Chem. Rev., 2014, 114, 9987–10043 CrossRef CAS PubMed.
- M. Marszewski, S. Cao, J. Yu and M. Jaroniec, Mater. Horiz., 2015, 2, 261–278 RSC.
- X. Chang, T. Wang and J. Gong, Energy Environ. Sci., 2016, 9, 2177–2196 RSC.
- S. N. Habisreutinger, L. Schmidt-Mende and J. K. Stolarczyk, Angew. Chem., Int. Ed., 2013, 52, 7372–7408 CrossRef CAS PubMed.
- N. Shehzada, M. Tahir, K. Joharia, T. Murugesan and M. Hussaind, J. CO2 Util., 2018, 26, 98–122 CrossRef.
- J. Ran, M. Jaroniec and S.-Z. Qiao, Adv. Mater., 2018, 30, 1704649 CrossRef PubMed.
- M. Edelmannová, K.-Y. Lin, J. C. S. Wu, I. Troppová, L. Čapek and K. Kočí, Appl. Surf. Sci., 2018, 454, 313–318 CrossRef.
- H. Jiang, K.-I. Katsumata, J. Hong, A. Yamaguchi, K. Nakata, C. Terashima, N. Matsushita, M. Miyauchi and A. Fujishima, Appl. Catal., B, 2018, 224, 783–790 CrossRef CAS.
- L.-Y. Lin, S. Kavadiya, B. B. Karakocak, Y. Nie, R. Raliya, S. T. Wang, M. Y. Berezin and P. Biswas, Appl. Catal., B, 2018, 230, 36–48 CrossRef CAS.
- P. Li, Y. Zhou, Z. Zhao, Q. Xu, X. Wang, M. Miao and Z. Zou, J. Am. Chem. Soc., 2015, 137, 9547–9550 CrossRef CAS PubMed.
- Q. Liu, Y. Zhou, J. Kou, X. Chen, Z. Tian, J. Gao, S. Yan and Z. Zou, J. Am. Chem. Soc., 2010, 132, 14385–14387 CrossRef CAS PubMed.
- S. C. Yan, S. Ouyang, J. Gao, M. Yang, J. Y. Feng, X. X. Fan, L. J. Wan, Z. S. Li, J. H. Ye, Y. Zhou and Z. G. Zou, Angew. Chem., Int. Ed., 2010, 49, 6400–6404 CrossRef CAS PubMed.
- H. Cheng, B. Huang, Y. Liu, Z. Wang, X. Qin, X. Zhang and Y. Dai, Chem. Commun., 2012, 48, 9729–9731 RSC.
- C. Cometto, R. Kuriki, L. Chen, K. Maeda, T.-C. Lau, O. Ishitani and M. Robert, J. Am. Chem. Soc., 2018, 140, 7437–7440 CrossRef CAS PubMed.
- R. Li, W. Zhang and K. Zhou, Adv. Mater., 2018, 30, 1705512 CrossRef PubMed.
- J. Fu, B. Zhu, C. Jiang, B. Cheng, W. You and J. Yu, Small, 2017, 13, 1603938–1603947 CrossRef PubMed.
- S. Bai, X. Wang, C. Hu, M. Xie, J. Jiang and Y. Xiong, Chem. Commun., 2014, 50, 6094–6097 RSC.
- S. Ye, R. Wang, M.-Z. Wu and Y.-P. Yuan, Appl. Surf. Sci., 2015, 358, 15–27 CrossRef CAS.
- P. Xia, B. Zhu, J. Yu, S. Cao and M. Jaroniec, J. Mater. Chem. A, 2017, 5, 3230–3238 RSC.
- J. Yu, K. Wang, W. Xiao and B. Cheng, Phys. Chem. Chem. Phys., 2014, 16, 11492–11501 RSC.
- J. Yu, J. Jian, B. Cheng and M. Jaroniec, J. Mater. Chem. A, 2014, 2, 3407–3416 RSC.
- K. K. Sakimoto, A. B. Wong and P. Yang, Science, 2016, 351, 74–77 CrossRef CAS PubMed.
- Y. S. Chaudhary, T. W. Woolerton, C. S. Allen, J. H. Warner, E. Pierce, S. W. Ragsdale and F. A. Armstrong, Chem. Commun., 2012, 48, 58–60 RSC.
- H. Wang, L. Zhang, Z. Chen, J. Hu, S. Li, Z. Wang, J. Liu and X. Wang, Chem. Soc. Rev., 2014, 43, 5234–5244 RSC.
- Z. Sun, Y. Zhang, N. Li, L. Xu and T. Wang, J. Mater. Chem. C, 2015, 3, 6153–6157 RSC.
- P. Meng, J. Huang and X. Liu, J. Colloid Interface Sci., 2019, 551, 208–218 CrossRef CAS PubMed.
- P. Meng, H. Heng, Y. Sun, J. Huang, J. Yang and X. Liu, Appl. Catal., B, 2018, 226, 487–498 CrossRef CAS.
- P. D. Tran, L. H. Wong, J. Barberbcd and J. S. C. Loo, Energy Environ. Sci., 2002, 5, 5902–5918 RSC.
- X. Yu, V. de Waele, A. Löfberg, V. V. Ordomsky and A. Y. Khodakov, Nat. Commun., 2019, 10, 700 CrossRef PubMed.
- W. Tu, Y. Zhou and Z. Zou, Adv. Mater., 2014, 26, 4607–4626 CrossRef CAS PubMed.
- X. Chen, Y. Li, X. Pan, D. Cortie, X. Huang and Z. Yi, Nat. Commun., 2016, 7, 12273 CrossRef CAS PubMed.
- J. Zhang, L. Sun, C. Liao and C. Yan, Chem. Commun., 2002, 262–263 RSC.
- J. Shi, J. Chen, Z. Feng, T. Chen, Y. Lian, X. Wang and C. Li, J. Phys. Chem. C, 2007, 111, 693–699 CrossRef CAS.
- S. Xie, Y. Wang, Q. Zhang, W. Deng and Y. Wang, ACS Catal., 2014, 4, 3644–3653 CrossRef CAS.
- H. Shi, T. Zhang, T. An, B. Li and X. Wang, J. Colloid Interface Sci., 2012, 380, 121–127 CrossRef CAS PubMed.
- H. Li, X. Jiao, L. Li, N. Zhao, F. Xiao, W. Wei, Y. Sun and B. Zhang, Catal. Sci. Technol., 2015, 5, 989–1005 RSC.
- E.-M. Köck, M. Kogler, T. Bielz, B. Klötzer and S. Penner, J. Phys. Chem. C, 2013, 117, 17666–17673 CrossRef PubMed.
- G. Busca and V. Lorenzelli, Mater. Chem., 1982, 7, 89–126 CrossRef CAS.
- M. Tao, L. Xue, Z. Sun, S. Wang, X. Wang and J. Shi, Sci. Rep., 2015, 5, 13764 CrossRef CAS PubMed.
- R. Lindsay, E. Michelangeli, B. G. Daniels, T. V. Ashworth, A. J. Limb, G. Thornton G, A. Gutiérrez-Sosa, A. Baraldi, R. Larciprete and S. Lizzit, J. Am. Chem. Soc., 2002, 124, 7117–7122 CrossRef CAS PubMed.
- O. Carp, C. L. Huisman and A. Reller, Prog. Solid State Chem., 2004, 32, 33–177 CrossRef CAS.
- A. Bouibes, A. Zaoui and D. Tunega, Solid State Commun., 2003, 166, 76–82 CrossRef.
- M. Gancheva, M. Markova-Velichkova, G. Atanasova, D. Kovacheva, I. Uzunov and R. Cukeva, Appl. Surf. Sci., 2016, 368, 258–266 CrossRef CAS.
- C. Wöll, Prog. Surf. Sci., 2007, 82, 55–120 CrossRef.
- M. C. Biesinger, L. W. M. Laua, A. R. Gerson and R. S. C. Smart, Appl. Surf. Sci., 2010, 257, 887–898 CrossRef CAS.
- P. Kar, S. Zeng, Y. Zhang, E. Vahidzadeh, A. Manuel, R. Kisslinger, K. M. Alama, U. K. Thakur, N. Mahdi, P. Kumar and K. Shankar, Appl. Catal., B, 2019, 243, 522–536 CrossRef CAS.
- S. N. Habisreutinger, L. Schmidt-Mende and J. K. Stolarczyk, Angew. Chem., Int. Ed., 2013, 52, 7372–7408 CrossRef CAS PubMed.
- J. Lee, D. C. Sorescu and X. Deng, J. Am. Chem. Soc., 2011, 133, 10066–10069 CrossRef CAS PubMed.
- L. Yuan and Y.-L. Xu, Appl. Surf. Sci., 2015, 342, 154–167 CrossRef CAS.
- S. Nahar, M. Zain, A. A. H. Kadhum, H. A. Hasan and M. R. Hasan, Materials, 2017, 10, 629 CrossRef PubMed.
- Q. Xiang, B. Cheng and J. Yu, Angew. Chem., Int. Ed., 2015, 54, 11350–11366 CrossRef CAS PubMed.
- Y. Izumi, Coord. Chem. Rev., 2013, 257, 171–186 CrossRef CAS.
- C. Su and D. L. Suarez, Clays Clay Miner., 1997, 45, 814–825 CrossRef CAS.
- R. L. Frost, W. N. Martens, D. L. Wain and M. C. Hales, Spectrochim. Acta, Part A, 2008, 70, 1120–1126 CrossRef PubMed.
- E. Garrone, B. Fubini, B. Bonelli, B. Onida and C. O. Areán, Phys. Chem. Chem. Phys., 1999, 1, 513–518 RSC.
Footnote |
| † Electronic supplementary information (ESI) available. See DOI: 10.1039/c9na00398c |
| This journal is © The Royal Society of Chemistry 2019 |

