In situ doping and synthesis of two-dimensional nanomaterials using mechano-chemistry†
Srikanth
Mateti
 a,
Alexey M.
Glushenkov
ab,
Lu Hua
Li
 a,
Qian
Ma
c,
Chunyi
Zhi
 d and
Ying
Chen
 *a
*a
aInstitute for Frontier Materials, Deakin University, Waurn Ponds, Victoria 3216, Australia. E-mail: ian.chen@deakin.edu.au
bDepartment of Chemical Engineering, The University of Melbourne, Parkville, Victoria 3010, Australia
cCentre for Additive Manufacturing, School of Engineering, RMIT University, Melbourne, Victoria 3000, Australia
dDepartment of Materials Science and Engineering, City University of Hong Kong, China
First published on 1st December 2018
Abstract
Doping foreign atoms into materials can modify their electronic configuration and tune their chemical and physical properties. Developing an efficient doping strategy is thus critically important for many new applications of two-dimensional (2D) nanomaterials. Here, we report an in situ process to produce and simultaneously dope carbon and nitrogen in a number of 2D materials including graphene, BN, MoS2 and WS2 using mechanochemistry. This new process produces large quantities of 2D materials with controlled doping contents and new properties.
Conceptual insightsThe new concept is a novel method that combines both doping and mechanical exfoliation processes to produce doped nanosheets in one step. The new chemistry behind this new in situ process is that the dopant gases (NH3 or C2H4) also act as an exfoliation agent for the production of 2D structures. For the first time, a controlled mechano-chemical process is reported for the production of doped 2D materials, while most common doping methods are post-synthesis treatments. The advantages of the new method include large quantity production, controlled dopant contents and reliable process. Mechano-chemical reactions between materials and dopant gases were generated by ball milling at room temperature. The doped nanosheets have negative zeta potential and can be dispersed in water to form stable solutions. |
Introduction
Two-dimensional (2D) nanomaterials have many new chemical, mechanical, electrical and thermal properties, and thus various exciting applications.1–9 Doping of foreign atoms in them can modify the electronic configuration and further tune the chemical and physical properties of the materials.10–12 For example, nitrogen (N) doped graphene is endowed with various enhanced properties; for example, the spin density and charge distribution of carbon atoms will be influenced, which is vital for catalytic reactions.13 Carbon (C) doped boron nitride (BN) has been used as a metal-free catalyst for enhanced oxygen reduction reactions (ORRs).14 The catalytic activity of molybdenum disulphide (MoS2) nanosheets has been improved by C doping,15 while N doping enhanced the electrochemical performance and cycling stability.16 In addition, N doping of tungsten disulphide (WS2) nanosheets can improve the intrinsic conductivity, resulting in enhanced catalytical performance in the hydrogen evolution reaction (HER).17 The common doping methods include arc discharge,10 chemical vapour deposition,18 thermal annealing,19 hydrothermal methods,20 and sol–gel methods.17 However, these methods are post-synthesis, multistep processes that often require high-temperature calcination16 and plasma treatment,21 and can damage the material structure. In addition, it is difficult to control the doping content. Here, we demonstrate an in situ process that combines mechanical exfoliation and chemical doping processes together. Large-quantities of nanosheets with controlled doping contents can be produced via a mechano-chemical process at ambient temperature.Experimental
Several grams of materials (graphite, MoS2, WS2, or BN) were loaded with several hardened steel balls of a diameter of 25 mm in a sealed milling container, which was evacuated and purged with argon several times, before filling with a selected gas (anhydrous ammonia (NH3) or ethylene (C2H4)) at 300 kPa. Ball milling experiments were performed in a rotating high-energy ball mill as described in our previous report.22 The crystalline structure and phases of the samples were investigated by X-ray diffraction (XRD) using a PANalytical X’pert powder diffractometer (Cu K-alpha radiation, λ = 0.15418 nm) operated at 40 kV with 30 mA current. XRD data were recorded over a range of 10°–70° with a step time and size of 150 s and 0.02, respectively. The morphology of the milled samples was examined by scanning electron microscopy (SEM), using a Hitachi S4500 Zeiss Supra 55VP microscope operated at 3 to 10 kV. Elemental composition was measured by energy-dispersive X-ray spectroscopy (EDS) on cold-pressed pellets. Transmission electron microscopy (TEM) analysis was performed using a JEOL JEM 2100F instrument with an acceleration voltage of 200 kV and equipped with a Gatan Quantum ER 965 Imaging Filter. X-ray photoelectron spectra (XPS) were acquired on a Kratos AXIS Nova with an Al Kα X-ray source. Fourier transform infrared spectroscopy (FTIR) was carried out using a Bruker Vertex 70 infrared spectrometer in attenuated total reflection mode. The zeta potential of dispersed samples was measured by using a Malvern Zetasizer Nano ZS.Results and discussion
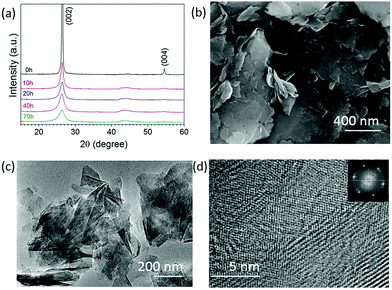
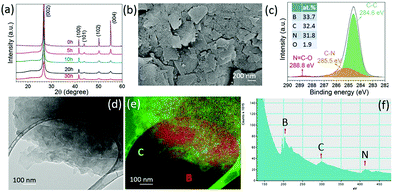
Fig. 1a shows the XRD patterns of the graphite milled in ammonia (NH3) for different time intervals; as the milling time increases, the (002) peak becomes wider and weak, indicating the exfoliation of graphite particles. The SEM image, Fig. 1b, shows that the graphite milled for 20 h in NH3 transforms from large particles to thin layers/sheets. We found 2.6 wt% of nitrogen in the graphene sheets after milling for 70 h in our previous work.22 Pressure reduction of the NH3 gas during the milling process was observed, which is due to the formation of N–C bonds as previously revealed by using near-edge X-ray absorption fine structures (NEXAFS) spectroscopy,22 leading to a gradual increase in N content in the milled samples and allowing the control of the doping content. The high-resolution TEM images (Fig. 1c and d) show a good crystallinity of individual nanosheets. The inserted fast Fourier transform (FFT) spectrum contains multiple sets of dots with a sixfold symmetry revealing an undamaged in-plane structure of the nanosheets. The XRD, SEM, and TEM results show that bulk graphite has been exfoliated to thin nanosheets during the milling process in a NH3 atmosphere.Hexagonal boron nitride particles have been milled in ethylene (C2H4) over different time intervals to dope C into BN nanosheets. From the XRD patterns (Fig. 2a), it is clear that the structure remains the same after 30 h of milling. The SEM image (Fig. 2b) shows the layered structure of thin sheets. XPS spectra (Fig. 2c) of BN milled for 30 h in C2H4 show 32.4 at% of carbon present, and show C–N bonds at 285.5 eV and N![[double bond, length as m-dash]](https://www.rsc.org/images/entities/char_e001.gif) C–O at 288.8 eV;23 the initial carbon content in BN is shown in Fig. S1 (ESI†). Energy-filtered transmission electron microscopy (EFTEM) images with overlay mapping (Fig. 2d and e) show a homogeneous distribution of boron and carbon, which is confirmed by the electron energy loss spectroscopy (EELS) spectra displayed in Fig. 2f. The B-K edge at 188 eV, C-K edge at 283.8 eV, and N-K edge at 401.6 eV can be seen clearly.
C–O at 288.8 eV;23 the initial carbon content in BN is shown in Fig. S1 (ESI†). Energy-filtered transmission electron microscopy (EFTEM) images with overlay mapping (Fig. 2d and e) show a homogeneous distribution of boron and carbon, which is confirmed by the electron energy loss spectroscopy (EELS) spectra displayed in Fig. 2f. The B-K edge at 188 eV, C-K edge at 283.8 eV, and N-K edge at 401.6 eV can be seen clearly.
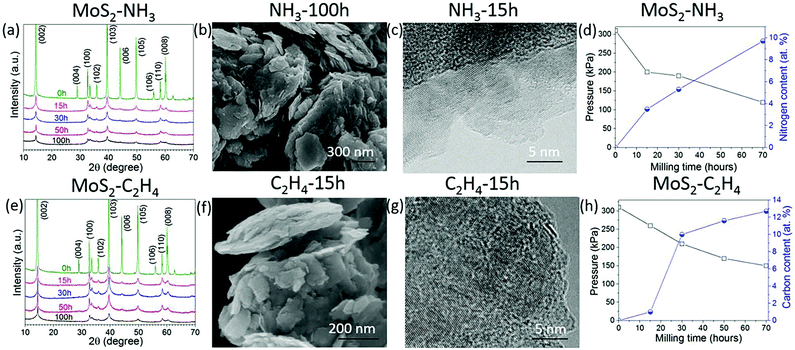
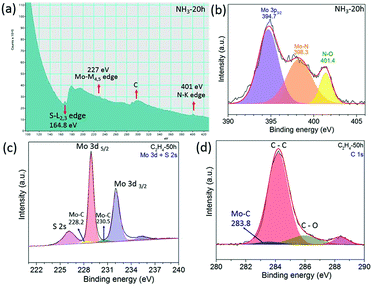
Other layered materials from the transition metal dichalcogenide family such as molybdenum disulphide (MoS2) have been milled in hydrocarbon gas ethylene (C2H4) or ammonia (NH3) for C and N doping. The XRD patterns in Fig. 3a and e show that MoS2 retains its structure after 100 h of milling in both gasses. SEM images show clearly a layered structure of the MoS2 after milling in NH3 for 100 h (Fig. 3b) and in C2H4 gas for 15 h (Fig. 3f). HR TEM images (Fig. 3c and g) show nice crystallinity of the MoS2 milled in NH3 for 15 h and in C2H4, respectively. As the milling time increases the pressure of the gas decreases, and the carbon and nitrogen content increases in the milled samples, Fig. 3d and h. The carbon content is around 12.7 at% in the sample milled in C2H4 for 70 h. Similar behaviour was also observed in the samples milled in NH3, whereas the nitrogen content is 9.7 at% for the sample milled in ammonia for 70 h. The EELS spectrum shown in Fig. 4a clearly shows the doping of nitrogen in MoS2, with the peaks for the Mo-M edge at 227 eV, N-K edge 401 eV, and S-L edge at 164.8 eV confirming the presence of nitrogen. The C-K edge at 283.8 eV shows the presence of carbon, which is most likely due to environmental contamination. XPS spectral (Fig. 4b) results also prove the nitrogen doping in MoS2. The sample milled in NH3 for 20 h has been selected for XPS measurement, and curve fitting and deconvolution shows that the peaks at 397.6 eV and 399.1 eV corresponds to Mo–N,16 and the peak at 401.4 eV corresponds to –NO16,24 adsorbed to the surface of MoS2, in the Mo 3p3/2 and N 1s spectra. Thus, the XPS and EELS results confirm the doping of nitrogen in MoS2. The XPS spectra of MoS2 milled in C2H4 for 50 h are displayed in Fig. 4c and d. Mo–C bonds are found from the C 1s spectrum at 283.8 eV and also in the Mo 3d–S 2s spectrum at 228.2 eV and 230.5 eV.25
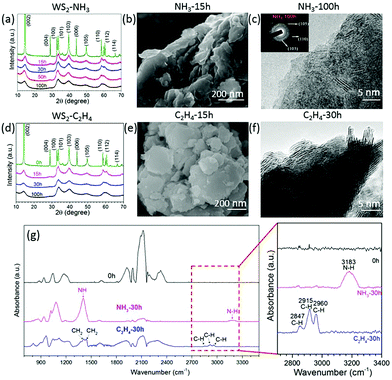
To check if the same approach would work for other transitional metal chalcogenides, tungsten disulphide (WS2) was milled in ethylene (C2H4) and ammonia (NH3) for different intervals. The XRD patterns (Fig. 5a and d) show the same XRD patterns for all milled samples but the diffraction peaks become broader and weaker, which suggests that the layered structure remains the same at the end of 100 h of milling. The SEM images (Fig. 5b and e) show the remaining layered structure of WS2 nanosheets milled in C2H4 (Fig. 5e) and NH3 (Fig. 5b) for 15 hours. The TEM image in Fig. 5f confirms the layered structure in the WS2 after milling for 30 h in C2H4. The SAED patterns in Fig. 5c show a good crystalline structure and the (105), (110), and (103) rings confirm a well-retained crystalline structure even after milling for 100 h in NH3. As the milling time increases, the pressure decreases, and the carbon and nitrogen content increases (Fig. S2a and b, ESI†) in the samples milled in ethylene and ammonia gas respectively. The carbon content is around 21.1 at% in the sample milled in C2H4 for 100 h, whereas the nitrogen content is about 7.8 at% for the sample milled in NH3 for 100 h. The FTIR spectra in Fig. 5g reveal the C–H bonds at 2847 cm−1, 2915 cm−1 and 2960 cm−1, and N–H bonds at 1409 cm−1 and 3183 cm−1 in the WS2 nanosheets milled in C2H4 and NH3 respectively.26 Carbon and sulphur overlay mapping (Fig. S3, ESI†) obtained by using EFTEM, confirms the uniform distribution of carbon in WS2 milled in C2H4 for 20 h.
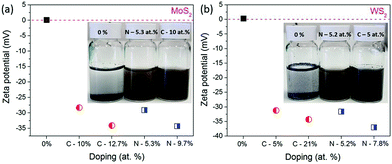
The influence of carbon or nitrogen doping on the nanosheets was investigated using the zeta potential method. 6 mg of nanosheets and starting materials (before milling) were dispersed in 20 mL of DI water and bath-sonicated for 1 h and then the zeta potential was measured. The colloidal dispersion of doped nanosheets and bulk MoS2 and WS2 is shown in Fig. 6a inset.
It is clearly visible that, bulk MoS2 and WS2 settled at the bottom of the container, but at the same time, the doped nanosheets were well dispersed in water. As shown in Fig. 6, the stability of the dispersions increases with the doping amount of foreign element. The zeta potential is −34.3 mV for MoS2 milled in NH3 for 100 h (N doping 9.7 at%), whereas it is −34.1 mV for the sample milled in C2H4 (C doping 12.7 at%), in comparison with that of the starting MoS2 of 0.11 mV. Similar results were observed for WS2, where the starting WS2 has the zeta potential of 0.31 mV, which is decreased to −34.3 mV for the sample milled in C2H4 (C doping 21 at%) and −37 mV for the sample milled in NH3(C doping 7.8 at%). Generally, a solution with a zeta potential more positive than +30 mV or more negative than −30 mV is considered as a stable dispersion due to interparticle electrostatic repulsion.27 These negative potentials suggest that carbon and nitrogen doping develops negative charges on the nanosheet surfaces and edges, which acts as anionic surfactants, and develop electrostatic repulsion between individual nanosheets and help to disperse them in water and maintain the stability of the dispersion. Thus, nitrogen and carbon doped nanosheets are well dispersed and stable in water, without the help of any surfactant.
Under high-energy impacts, C2H4 and NH3 dissociated and chemisorbed onto the defects and edges of nanosheets, which avoids cross-linking of the nanosheets. Significant pressure drops of NH3 and C2H4 gasses were observed inside the sealed milling chamber during the entire milling process. The pressure reduction could be explained by gas absorption onto the newly created surfaces of the milled materials by high-energy impacts28 which is confirmed by the nitrogen and carbon presence in the milled samples, with increasing contents. Other gases such as CH4, C3H8 and N2 can also be used as possible doping gases. High milling intensity creates more fresh surface area, active edges and defects in the milled samples, and provides more sites for gas adsorption, decomposition and chemical bond formation. The doped content can be increased by using higher milling intensity/energy or a high-speed milling system with a high impact frequency. This new in situ doping process ensures homogeneous distribution of the dopant in the materials, and a simple and economical method to produce doped nanosheets in large quantities.
Conclusions
We have developed a new in situ method for the production of nanosheets with controlled doping contents, including nitrogen doping in graphene, carbon doping in BN nanosheets, and carbon and nitrogen in MoS2 and WS2 nanosheets via a mechanochemical process with the usage of either C2H4 or NH3 gas. This method produces large quantities of doped nanosheets for various applications. The doped nanosheets have negative zeta potential and can be dispersed in water to form stable solutions.Conflicts of interest
There are no conflicts to declare.Acknowledgements
Y. C., and L. H. L., acknowledge financial support from the Australian Research Council under the Discovery Programs (DP150102346). Q. M. and Y. C. thank the Australia Research Council for a Linkage Project (LP140100608). The authors also acknowledge Deakin University's Advanced Characterisation Facility for the use of electron microscopy facilities. Experimental assistance from Mr Yuchen Liu is acknowledged.References
- K. S. Novoselov, A. K. Geim, S. Morozov, D. Jiang, M. I. Katsnelson, I. V. Grigorieva, S. V. Dubonos and A. A. Firsov, Nature, 2005, 438, 197 CrossRef CAS PubMed.
- Y. Zhang, T. T. Tang, C. Girit, Z. Hai, M. C. Martin, A. Zettl, M. F. Crommie, Y. R. Shen and F. Wang, Nature, 2009, 459, 820 CrossRef CAS PubMed.
- L. Li, L. H. Li, Y. Chen, X. J. Dai, P. R. Lamb, B. M. Cheng, M. Y. Lin and X. Liu, Angew. Chem., 2013, 125, 4306 CrossRef.
- Y. Yoon, K. Ganapathi and S. Salahuddin, Nano Lett., 2011, 11, 3768 CrossRef CAS PubMed.
- D. Fox, Y. Zhou, P. Maguire and A. Oneill, Nano Lett., 2015, 15, 5307 CrossRef CAS PubMed.
- K. H. Lee, H. J. Shin, J. Lee, Y. I. Lee, G. H. Kim, J. Y. Choi and S. W. Kim, Nano Lett., 2012, 12, 714 CrossRef CAS PubMed.
- Y. Shi, C. Hamsen, X. Jia, K. K. Kim, A. Reina, M. Hofmann, A. L. Hsu, K. Zhang, H. Li, Z. Y. Juang, M. S. Dresselhaus, L. J. Li and J. Kong, Nano Lett., 2010, 10, 4134 CrossRef CAS PubMed.
- L. H. Li, T. Xing, Y. Chen and R. Jones, Adv. Mater. Interfaces, 2014, 1, 1300132 CrossRef.
- D. Liu, W. Lei, D. K. Klika, L. Kong and Y. Chen, Adv. Mater. Interfaces, 2015, 2, 1500228 CrossRef.
- L. Feng, Y. Chen and L. Chen, ACS Nano, 2011, 5, 9611 CrossRef CAS PubMed.
- S. Qin, W. Lei, D. Liu and Y. Chen, Sci. Rep., 2014, 4, 7582 CrossRef CAS PubMed.
- F. Li, Z. Zhu, X. Yao, G. Lu, M. Zhao, Y. Xia and Y. Chen, Appl. Phys. Lett., 2008, 92, 102515 CrossRef.
- R. Li, L. Yang, T. Xiong, Y. Wu, L. Cao, D. Yuan and W. Zhou, J. Power Sources, 2017, 356, 133 CrossRef CAS.
- Y. C. Chang and W. H. Chiang, Adv. Nanomater., 2016, 103 Search PubMed.
- X. Lin and J. Ni, J. Appl. Phys., 2014, 116, 044311 CrossRef.
- W. Zhou, D. Hou, Y. Sang, S. Yao, J. Zhou, G. Li, L. Li and H. Liu, J. Mater. Chem. A, 2014, 2, 11358 RSC.
- C. Sun, J. Zhang, J. Ma, P. Liu, D. Gao, K. Tao and D. Xue, J. Mater. Chem. A, 2016, 4, 11234 RSC.
- D. Wei, Y. Liu, Y. Wang, H. Zhang, L. Huang and G. Yu, Nano Lett., 2009, 9, 1752 CrossRef CAS PubMed.
- Z. Wen, X. Wang, S. Mao, Z. Bo, H. Kim, S. Cui, G. Lu, X. Feng and J. Chen, Adv. Mater., 2012, 24, 5610 CrossRef CAS PubMed.
- Z. S. Wu, A. Winter, L. Chen, Y. Sun, A. Turchanin, X. Feng and K. Mullen, Adv. Mater., 2012, 24, 5130 CrossRef CAS PubMed.
- A. Azcatl, X. Qin, A. Prakash, C. Zhang, L. Cheng, Q. Wang, N. Lu, M. J. Kim, J. Kim, K. Cho, R. Addou, C. L. Hinkle, J. Appenzeller and R. M. Wallace, Nano Lett., 2016, 16, 5437 CrossRef CAS PubMed.
- T. Xing, S. Mateti, L. H. Li, F. Ma, A. Du, Y. Gogotsi and Y. Chen, Sci. Rep., 2016, 6, 35532 CrossRef CAS PubMed.
- L. H. Li, Y. Chen, B. M. Cheng, M. Y. Lin, S. L. Chou and Y. C. Peng, Appl. Phys. Lett., 2012, 100, 261108 CrossRef.
- Z. Shuxian, W. K. Hall, G. Ertl and H. Knozinger, J. Catal., 1986, 100, 167 CrossRef.
- Z. Hai, J. Du, M. K. Akbari, C. Xue, H. Xu and S. Zhuiykov, Ionics, 2017, 23, 1921 CrossRef CAS.
- D. L. Pavia, G. M. Lampman and G. S. Kriz, Introduction to Spectroscopy: A Guide for Students of Organic Chemistry, Brooks/Cole, Pacific Grove, CA, USA, 3rd edn, 2001 Search PubMed.
- A. Gupta, V. Arunachalam and S. Vasudevan, J. Phys. Chem. Lett., 2015, 6, 739 CrossRef CAS PubMed.
- Y. Chen, C. P. Li, H. Chen and Y. Chen, Sci. Technol. Adv. Mater., 2006, 7, 839 CrossRef CAS.
Footnote |
| † Electronic supplementary information (ESI) available. See DOI: 10.1039/c8nh00369f |
| This journal is © The Royal Society of Chemistry 2019 |

