Scalable synthesis of holey graphite nanosheets for supercapacitors with high volumetric capacitance†
Jie
Wang
ab,
Teahoon
Park
c,
Jin Woo
Yi
c,
Bing
Ding
ab,
Joel
Henzie
 a,
Zhi
Chang
d,
Hui
Dou
 b,
Xiaogang
Zhang
 *b and
Yusuke
Yamauchi
 *ef
*ef
aInternational Center for Materials Nanoarchitectonics (WPI-MANA), National Institute for Materials Science (NIMS), 1-1 Namiki, Tsukuba, Ibaraki 305-0044, Japan
bKey Laboratory of Materials and Technologies for Energy Conversion, College of Materials Science & Engineering, Nanjing University of Aeronautics and Astronautics, Nanjing, 210016, China. E-mail: azhangxg@nuaa.edu.cn
cCarbon Composite Department, Composites Research Division, Korea Institute of Materials Science (KIMS), 797, Changwon-daero, Seongsan-gu, Changwon-si, Gyeongsangnam-do 51508, South Korea
dGraduate School of System and Information Engineering, University of Tsukuba, 1-1-1 Tennodai, Tsukuba, Ibaraki 305-8573, Japan
eSchool of Chemical Engineering and Australian Institute for Bioengineering and Nanotechnology (AIBN), The University of Queensland, Brisbane, QLD 4072, Australia. E-mail: y.yamauchi@uq.edu.au
fDepartment of Plant and Environmental New Resources, Kyung Hee University, 1732 Deogyeong-daero, Giheung-gu, Yongin-si, Gyeonggi-do 446-701, South Korea
First published on 13th December 2018
Abstract
We prepared a material composed of high-density holey graphite nanosheets (HGNs) that supports a high gravimetric capacitance of 295![[thin space (1/6-em)]](https://www.rsc.org/images/entities/char_2009.gif) F
F![[thin space (1/6-em)]](https://www.rsc.org/images/entities/char_2009.gif) g−1 and a volumetric capacitance of 384
g−1 and a volumetric capacitance of 384![[thin space (1/6-em)]](https://www.rsc.org/images/entities/char_2009.gif) F cm−3 for use as electrodes in supercapacitor devices. This method is a simple and scalable route to obtain large amounts of holey two-dimensional materials with high electrochemical performances.
F cm−3 for use as electrodes in supercapacitor devices. This method is a simple and scalable route to obtain large amounts of holey two-dimensional materials with high electrochemical performances.
Conceptual insightsWe developed a simple and scalable method to fabricate high-density, holey graphite nanosheets (HGNs) using GO as the carbon source and ZnO as an etching agent. During high-temperature calcination, ZnO etches the GO nanosheets and perforates them with tiny nanoscale holes. The obtained HGN samples exhibited abundant in-plane pores and interlayer spaces, which facilitated the rapid diffusion of electrolyte ions within the electrodes. When used as an electrode in supercapacitor devices, the optimized HGN-2 electrode exhibited a high CM and CV of 295 F g−1 and 384 F cm−3, respectively, along with an excellent rate capability. It is notable that this method doesn’t use any templates or generate any residues that must be removed during the procedure. Thus, it may provide a simple and scalable method to obtain other kinds of holey two-dimensional materials with high electrochemical performance. |
Introduction
Two-dimensional (2D) materials have interesting physical and chemical properties that are useful in numerous applications.1–5 Graphene materials, in particular, have created a surge of new work in the area of energy-storage devices because they possess an exceptionally high intrinsic electrical conductivity, a large theoretical surface area (2630![[thin space (1/6-em)]](https://www.rsc.org/images/entities/char_2009.gif) m2 g−1) and excellent mechanical flexibility.6–10 However, graphene nanosheets tend to restack due to π–π interactions, reducing their ion-accessible surface area and ion-transport rate. Thus, restacking is unfavourable for supercapacitor devices because it results in low capacitance and unsatisfactory rate capabilities. To address this issue, two approaches are typically adopted to minimize graphene restacking and increase the interlayer space: (1) engineering the flat graphene layers into crumpled or curved structures11–13 and (2) inserting small particles as spacers into the interlayer space of graphene.14,15 Both of these strategies can improve ion transfer parallel to the plane of the graphene sheets, increasing capacitance to some extent. Real devices, however, require thick layers of graphene-based materials to generate a large areal capacity. Unfortunately, electrodes composed of unperforated 2D nanosheets will begin to restrict ion diffusion with increasing thicknesses, ultimately limiting areal utilization.
m2 g−1) and excellent mechanical flexibility.6–10 However, graphene nanosheets tend to restack due to π–π interactions, reducing their ion-accessible surface area and ion-transport rate. Thus, restacking is unfavourable for supercapacitor devices because it results in low capacitance and unsatisfactory rate capabilities. To address this issue, two approaches are typically adopted to minimize graphene restacking and increase the interlayer space: (1) engineering the flat graphene layers into crumpled or curved structures11–13 and (2) inserting small particles as spacers into the interlayer space of graphene.14,15 Both of these strategies can improve ion transfer parallel to the plane of the graphene sheets, increasing capacitance to some extent. Real devices, however, require thick layers of graphene-based materials to generate a large areal capacity. Unfortunately, electrodes composed of unperforated 2D nanosheets will begin to restrict ion diffusion with increasing thicknesses, ultimately limiting areal utilization.
Graphene sheets can be generated with abundant holes by perforating the plane of the nanosheet. These so-called HGNs support outstanding electrochemical properties including large capacity and high rate performances.16–22 Holes in the nanosheet provide shorter, less tortuous pathways for efficient ion transport even when the sheets are stacked. As a result, the electrolyte can easily penetrate the entire graphene electrode via the interlayer space and the in-plane holes, facilitating the rapid diffusion and storage of ions. HGN based materials are typically prepared using etching methods. For example, Bai et al. prepared a graphene nanomesh perforated with a high-density array of nanoscale holes via template-assisted O2 plasma etching.23 This strategy can generate high-quality HGN materials composed of single- or few-layers, but suffers from difficulties including scaling-up production and high cost. Chemical etching methods using KOH,24 H2O2,25 and oxidative etching using metal oxides,26 have advantages in terms of scalability and relatively low cost. However, removing the by-products and excessive etching agents requires extra steps (e.g., K2CO3 produced from the reaction between KOH and carbon). As a result, it is useful to explore more simple and convenient strategies to prepare high-purity holey graphene materials using methods that can be scaled.
Supercapacitors (SCs) are a class of promising energy storage devices that have superior power capability, excellent cycling stability, and high charge–discharge efficiency compared to conventional batteries.27–29 Gravimetric performance has traditionally been considered as the figure-of-merit for evaluating the performance of graphene electrodes. The volumetric performance is also becoming an increasingly important metric for supercapacitors, especially in microdevices used in environments with a limited space.30–34 The relationship between gravimetric capacitance (CM) and volumetric capacitance (CV) can be expressed by this equation:
| CV = CM·ρ, | (1) |
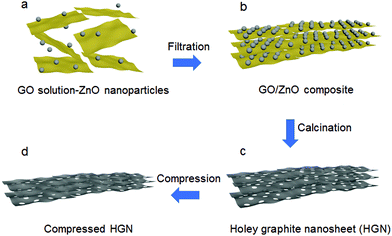
In this work, HGN materials with a high packing density and good porosity were generated by combining a solution of graphene oxide (GO) nanosheets with zinc oxide (ZnO) nanoparticles to create a layer-by-layer motif GO/ZnO structure (Fig. 1). This composite nanostructure was then separated via filtration and calcined at high temperature to reduce the GO to graphene. During the calcination process, the ZnO nanoparticles etch holes in adjacent graphene sheets via a carbothermal reduction reaction, generating Zn metal as a side product. The resulting material was composed of graphene nanosheets perforated with nanoscale pores. Any residual Zn metal was evaporated by heating the material to 900 °C, resulting in mesopores in the interlayer space and micropores perforating the graphene nanosheets. The obtained materials were referred to as HGN-X, where X represents the weight of ZnO used in the reaction. Our HGN-2 sample exhibited evidence of efficient ion transport pathways and a high packing density due to its high CM of 295 F g−1 and high CV of 384 F cm−3. This method may provide a simple and scalable route to obtain holey 2D materials.
Results and discussion
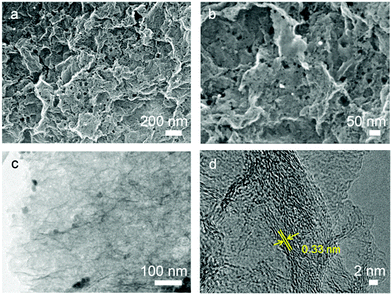
Thermogravimetric/differential thermal analysis (TG/DTA) measurements were carried out to help to describe the reaction between GO and ZnO (Fig. S1, ESI†). The ZnO particles drive an exothermic reaction with reduced GO at 700 °C. In the HGN-2 sample, the absence of distinct weight losses for GO (up to 250 °C) shows that the surface oxygen functionalities are reduced after high temperature calcination. This result is further confirmed via Fourier transform infrared spectroscopy (FTIR, Fig. S2, ESI†), which shows that the functional groups (–OH and –COOH, etc.) in the GO sample are not observable in HGN-2. The X-ray diffraction (XRD) results indicate that, after calcining at 900 °C for 4 h, the diffraction peak at 10.2° in the GO sample disappeared, which is typically assigned to the (001) reflection of oxidized graphite (Fig. S3a, ESI†). Two peaks at 26° and 42° corresponding to the (002) and (101) peaks of graphite are observed (Fig. S3b, ESI†), indicating the removal of Zn.The morphology of GO/ZnO and HGN-2 materials was examined via scanning electron microscopy (SEM) and scanning transmission electron microscopy (STEM). Fig. S4a (ESI†) shows STEM images of the GO/ZnO composite where ZnO particles are distributed within the interlayer space of the GO nanosheets. After the calcination step, Zn particles were removed (Fig. 2a and Fig. S4b, ESI†), revealing numerous mesopores randomly distributed over the surfaces of the graphene layers (Fig. 2b). TEM images (Fig. 2c) show that the sizes of the in-plane mesopores are less than 10 nm. The high-resolution TEM (HRTEM) images of the material reveals lattice fringes of graphene (0.33 nm) which are aligned around the mesopores, indicating that the material generated in HGN-2 is highly crystalline (Fig. 2d).
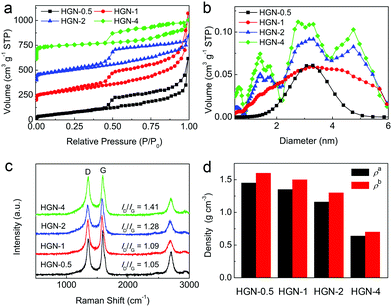
Nitrogen adsorption–desorption measurements were performed to investigate the porous structure of the HGN samples. All of the HGN materials possess abundant mesopores because they exhibit type IV sorption isotherms with hysteresis loops (Fig. 3a). The calculated specific surface areas (SSAs) and pore volumes (PVs) of the HGN samples are summarized in Table S1 (ESI†). Interestingly, increasing the amount of ZnO resulted in higher SSAs. For example, HGN-0.5 had an SSA of 287 m2 g−1, which increased to 320 m2 g−1 for HGN-1 and 370 m2 g−1 for HGN-2. The pore size distribution (PSD) curve was calculated using a non-local density functional theory model (Fig. 3b). For HGN-0.5 and HGN-1, the pore sizes (i.e. diameters) are distributed at ∼3 nm. HGN-2 has pore sizes of 1.5 nm, 3 nm, and 5 nm with a much larger pore volume. The PSD curve of HGN-4 is similar to HGN-2, but with an additional peak at 0.6 nm. The appearance of micropores in HGN-2 and HGN-4 is likely due to the additional amount of ZnO creating more micropores in the carbon. These results indicate that intercalation of ZnO particles in GO nanosheets is an efficient route to introduce an interlayer space, while retaining high density. The reaction between graphene and ZnO at high temperature introduces mesopores into the plane of the graphene nanosheets.
The HGN materials were further examined via Raman spectroscopy. In Fig. 3c, the peak at ∼1349 cm−1 matches the D-band out-of-plane breathing modes generated by defects and edges in the carbon lattice. The peak at ∼1591 cm−1 matches the in-plane vibration of the graphite lattice (the G band). Therefore, the integrated intensity ratio of the D band and the G band (ID/IG values) can be used as a measure of the level of ordering and removal of defects from the carbon structure. For HGN-0.5, HGN-1.0, HGN-2, and HGN-4, the intensity of the G band is much higher than that of the D band, indicating the removal of defects after the high-temperature treatment. In addition, higher amounts of ZnO in the reaction caused the ID/IG value to increase, indicating that the structure is becoming more disordered and riddled with defects as more ZnO is included in the reaction.
To further increase the density of the HGN materials, the samples were pressed using 15 MPa force to decrease their volume (Fig. 1d). The density values were determined by measuring the mass and volume of the materials and are plotted in Fig. 3d. The density after compression (ρb) increased compared with the original density (ρa): for HGN-0.5, HGN-1, HGN-2, and HGN-4, ρb = 1.6 g cm−3, 1.5 g cm−3, 1.3 g cm−3 and 0.7 g cm−3, respectively. Higher ρb/ρa is due to the removal of interlayer macropores created by ZnO particles.
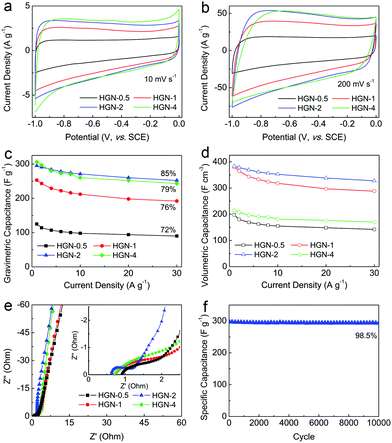
The supercapacitor (SC) performance of the HGN-0.5, HGN-1, HGN-2, and HGN-4 samples were tested using cyclic voltammetry (CV) and galvanic charge–discharge (GCD) measurements. As shown in Fig. 4a and b, the CV curves of all the samples have a rectangular shape, indicating a good electric double layer capacitive behaviour. Even at a scan rate of 200 mV s−1, the rectangular shape was well maintained, revealing the quick charge propagation capability. The GCD curves show nearly triangular traces at various current densities (Fig. S5, ESI†), which indicate the capacitive behaviour of the HGN samples. The specific gravimetric capacitances (CM) of the electrodes were calculated based on the galvanostatic discharge curves and the current density-dependent capacitances are plotted in Fig. 4c. The CM values of HGN-0.5, HGN-1, HGN-2, and HGN-4 at 1 A g−1 were 125 F g−1, 253 F g−1, 295 F g−1, and 306 F g−1, respectively. When the current density is increased to 30 A g−1, the CM values of HGN-0.5, HGN-1, HGN-2, and HGN-4 diminish to 90 F g−1, 192 F g−1, 252 F g−1, and 243 F g−1, with capacitance retention of 72%, 76%, 85%, and 79%, respectively (Fig. 4c).
The gravimetric capacitances of the HGN samples are very high, even though they have very low SSA and high packing density. Therefore, we can expect the HGN samples to show high SSA-normalized capacitance (CS) and CV. Normalized to SSAs, the CS values were 43 μF cm−2, 79 μF cm−2, 80 μF cm−2, and 63 μF cm−2 for HGN-0.5, HGN-1, HGN-2, and HGN-4, respectively (Fig. S6, ESI†). These values are much higher than those of activated carbon (4.9 μF cm−2),36 activated graphene (6.9 μF cm−2),7 and chemically-reduced GO (27 μF cm−2),37 indicating that the SSAs of HGN samples are highly accessible for the electrolyte ions. According to eqn (1), the CV at 1 A g−1 is calculated to be 200 F cm−3, 380 F cm−3, 384 F cm−3, and 214 F cm−3 for HGN-0.5, HGN-1, HGN-2, and HGN-4, respectively (Fig. 4d). It is notable that the CV of HGN-2 is much higher than rGO and most of the graphene-based carbon materials reported in the literature (Table S2, ESI†).
Electric double layer (EDL) capacitance is based on the reversible adsorption/desorption of electrolyte ions on the surface of electrodes. Therefore, the EDL capacitance is determined by the accessibility of the electrolyte to the surface of the electrode. At low current densities, the electrolyte ions can easily access the inner micro- and meso-pores of the graphene nanosheets through the holes on the layers. Despite the low SSA of HGN-0.5 and HGN-1, the utilization of the surface area is very high. At a high current density, however, the movement of ions might be attenuated by the small-sized pores. Therefore, the capacitances of HGN-0.5 and HGN-1 decreased significantly compared to the HGN-2 and HGN-4 samples. Unfortunately, the density of HGN-4 is much lower than the other samples, leading to a low volumetric performance.
To further investigate the difference in rate capabilities among the four HGN materials, electrochemical impedance spectroscopy (EIS) measurements were carried out. The higher slope of the curves for HGN-2 and HGN-4 in the low-frequency region of the Nyquist plots indicates a better ion-diffusion behaviour (Fig. 4e). In addition, HGN-2 shows the smallest semi-circle in the high-frequency region, corresponding to the lowest electric resistance. This is due to the lower amount of defects on the HGN-2 nanosheets. The cycle stability of HGN-2 was measured using the CV method at a scan rate of 10 mV s−1. After 10![[thin space (1/6-em)]](https://www.rsc.org/images/entities/char_2009.gif) 000 cycles, the capacitance retention rate was still ∼98.5% (Fig. 4f).
000 cycles, the capacitance retention rate was still ∼98.5% (Fig. 4f).
The high packing density, large mesopore volumes, and a high electric conductivity of the HGN-2 sample allowed it to have the largest volumetric capacitance and rate capability of all the samples we tested. The holey structure of these electrodes increases the ion-accessibility to the inner surface area of the material, enabling the entire electrode to be utilized. These results provide an effective strategy to improve the volumetric performance of graphene-based electrodes by introducing pores in the plane of graphene while decreasing excess porous spaces.
Conclusions
We developed a simple and scalable method to fabricate high-density, holey graphite electrodes using GO as the carbon source and ZnO as an etching agent. During high-temperature calcination, ZnO etches the GO nanosheets and perforates them with tiny nanoscale holes. The obtained HGN samples exhibited abundant in-plane pores and interlayer spaces, which facilitated the rapid diffusion of electrolyte ions within the electrodes. When used as an electrode in SC devices, the optimized HGN-2 electrode exhibited high CM and CV of 295 F g−1 and 384 F cm−3, respectively, along with an excellent rate capability. It is notable that this method doesn’t use any templates or generate any residues that must be removed during the procedure. Thus, it may provide a simple and scalable method to obtain other kinds of holey two-dimensional materials with high electrochemical performances.Conflicts of interest
There are no conflicts to declare.Acknowledgements
We would like to thank the National Key Basic Research Program 973 (No. 2014CB239701), the NSFC (No. 51372116 and No. 21773118), the Natural Science Foundation of Jiangsu Province (No. BK20170778 and No. 20151468), and the Principal Research Program (PNK5600) at the Korea Institute of Materials Science (KIMS) for the funding support. J. W. and B. D. would like to gratefully acknowledge the Postdoctoral Fellowship of the Japan Society for the Promotion of Science (18F18038 and 18F18764).Notes and references
- M. Xu, T. Liang, M. Shi and H. Chen, Chem. Rev., 2013, 113, 3766–3798 CrossRef CAS PubMed.
- M. Chhowalla, H. S. Shin, G. Eda, L.-J. Li, K. P. Loh and H. Zhang, Nat. Chem., 2013, 5, 263 CrossRef PubMed.
- M. R. Lukatskaya, S. Kota, Z. Lin, M.-Q. Zhao, N. Shpigel, M. D. Levi, J. Halim, P.-L. Taberna, M. W. Barsoum and P. Simon, Nat. Energy, 2017, 2, 17105 CrossRef CAS.
- H. Wang, H. Feng and J. Li, Small, 2014, 10, 2165–2181 CrossRef CAS PubMed.
- B. Anasori, C. Shi, E. J. Moon, Y. Xie, C. A. Voigt, P. R. Kent, S. J. May, S. J. Billinge, M. W. Barsoum and Y. Gogotsi, Nanoscale Horiz., 2016, 1, 227–234 RSC.
- P. Xiong, J. Zhu, L. Zhang and X. Wang, Nanoscale Horiz., 2016, 1, 340–374 RSC.
- Y. Zhu, S. Murali, M. D. Stoller, K. Ganesh, W. Cai, P. J. Ferreira, A. Pirkle, R. M. Wallace, K. A. Cychosz and M. Thommes, Science, 2011, 332, 1537–1541 CrossRef CAS PubMed.
- R. Raccichini, A. Varzi, S. Passerini and B. Scrosati, Nat. Mater., 2015, 14, 271 CrossRef CAS PubMed.
- Z. Bo, Y. Tian, Z. J. Han, S. Wu, S. Zhang, J. Yan, K. Cen and K. K. Ostrikov, Nanoscale Horiz., 2017, 2, 89–98 RSC.
- N. Chen, L. Ni, J. Zhou, G. Zhu, Q. Kang, Y. Zhang, S. Chen, W. Zhou, C. Lu and J. Chen, ACS Appl. Energy Mater., 2018, 1, 5189–5197 CAS.
- Z. Niu, J. Chen, H. H. Hng, J. Ma and X. Chen, Adv. Mater., 2012, 24, 4144–4150 CrossRef CAS PubMed.
- J. Wang, B. Ding, Y. Xu, L. Shen, H. Dou and X. Zhang, ACS Appl. Mater. Interfaces, 2015, 7, 22284–22291 CrossRef CAS PubMed.
- J. Luo, H. D. Jang, T. Sun, L. Xiao, Z. He, A. P. Katsoulidis, M. G. Kanatzidis, J. M. Gibson and J. Huang, ACS Nano, 2011, 5, 8943–8949 CrossRef CAS PubMed.
- H. R. Byon, B. M. Gallant, S. W. Lee and Y. Shao-Horn, Adv. Funct. Mater., 2013, 23, 1037–1045 CrossRef CAS.
- M. Hassan, K. R. Reddy, E. Haque, S. N. Faisal, S. Ghasemi, A. I. Minett and V. G. Gomes, Compos. Sci. Technol., 2014, 98, 1–8 CrossRef CAS.
- X. Dong, N. Hu, L. Wei, Y. Su, H. Wei, L. Yao, X. Li and Y. Zhang, J. Mater. Chem. A, 2016, 4, 9739–9743 RSC.
- X. Han, M. R. Funk, F. Shen, Y.-C. Chen, Y. Li, C. J. Campbell, J. Dai, X. Yang, J.-W. Kim and Y. Liao, ACS Nano, 2014, 8, 8255–8265 CrossRef CAS PubMed.
- M. Kotal, H. Kim, S. Roy and I.-K. Oh, J. Mater. Chem. A, 2017, 5, 17253–17266 RSC.
- J. Xu, Y. Lin, J. W. Connell and L. Dai, Small, 2015, 11, 6179–6185 CrossRef CAS PubMed.
- D. Liu, Q. Li and H. Zhao, J. Mater. Chem. A, 2018, 6, 11471–11478 RSC.
- L. Zhang, J. Yue, T. Wei, Z. Liu, J. Zhou, C. Liu, H. Jiang, Z. Jiang and Z. Fan, Carbon, 2019, 142, 327–336 CrossRef CAS.
- J. Li, B. Ji, R. Jiang, P. Zhang, N. Chen, G. Zhang and L. Qu, Carbon, 2018, 129, 95–103 CrossRef CAS.
- J. Bai, X. Zhong, S. Jiang, Y. Huang and X. Duan, Nat. Nanotechol., 2010, 5, 190 CrossRef CAS PubMed.
- L. Zhang, X. Zhao, M. D. Stoller, Y. Zhu, H. Ji, S. Murali, Y. Wu, S. Perales, B. Clevenger and R. S. Ruoff, Nano Lett., 2012, 12, 1806–1812 CrossRef CAS PubMed.
- Y. Xu, Z. Lin, X. Zhong, X. Huang, N. O. Weiss, Y. Huang and X. Duan, Nat. Commun., 2014, 5, 4554 CrossRef CAS PubMed.
- D. Zhou, Y. Cui, P.-W. Xiao, M.-Y. Jiang and B.-H. Han, Nat. Commun., 2014, 5, 4716 CrossRef CAS PubMed.
- P. Simon and Y. Gogotsi, Acc. Chem. Res., 2012, 46, 1094–1103 CrossRef PubMed.
- Y. Wang and Y. Xia, Adv. Mater., 2013, 25, 5336–5342 CrossRef CAS PubMed.
- J. Wang, S. Dong, B. Ding, Y. Wang, X. Hao, H. Dou, Y. Xia and X. Zhang, Natl. Sci. Rev., 2016, 4, 71–90 Search PubMed.
- C. Zhang, W. Lv, Y. Tao and Q.-H. Yang, Energy Environ. Sci., 2015, 8, 1390–1403 RSC.
- X. Yang, C. Cheng, Y. Wang, L. Qiu and D. Li, Science, 2013, 341, 534–537 CrossRef CAS PubMed.
- Y. Bu, T. Sun, Y. Cai, L. Du, O. Zhuo, L. Yang, Q. Wu, X. Wang and Z. Hu, Adv. Mater., 2017, 29, 1700470 CrossRef PubMed.
- J. Yan, Q. Wang, T. Wei, L. Jiang, M. Zhang, X. Jing and Z. Fan, ACS Nano, 2014, 8, 4720–4729 CrossRef CAS PubMed.
- C. Liu, X. Yan, F. Hu, G. Gao, G. Wu and X. Yang, Adv. Mater., 2018, 30, 1705713 CrossRef PubMed.
- H. Li, Y. Tao, X. Zheng, J. Luo, F. Kang, H.-M. Cheng and Q.-H. Yang, Energy Environ. Sci., 2016, 9, 3135–3142 RSC.
- H. Wang, Z. Xu, A. Kohandehghan, Z. Li, K. Cui, X. Tan, T. J. Stephenson, C. K. King’ondu, C. M. Holt and B. C. Olsen, ACS Nano, 2013, 7, 5131–5141 CrossRef CAS PubMed.
- J. Zhang, J. Jiang, H. Li and X. Zhao, Energy Environ. Sci., 2011, 4, 4009–4015 RSC.
Footnote |
| † Electronic supplementary information (ESI) available. See DOI: 10.1039/c8nh00375k |
| This journal is © The Royal Society of Chemistry 2019 |


