How the moiré superstructure determines the formation of highly stable graphene quantum dots on Ru(0001) surface†
Liyan
Zhu
 ab and
Feng
Ding
*ac
aCenter for Multidimensional Carbon Materials, Institute for Basic Science, UNIST-gil 50, Ulju-gun, Ulsan 44919, South Korea
bDepartment of Physics, Jiangsu Key Laboratory for Chemistry of Low-Dimensional Materials, and Jiangsu Key Laboratory of Modern Measurement Technology and Intelligent Systems, Huaiyin Normal University, Huai’an, People's Republic of China
cSchool of Materials Science and Engineering, Ulsan Institute for Science and Technology, UNIST-gil 50, Ulju-gun, Ulsan 44919, South Korea. E-mail: f.ding@unist.ac.kr
First published on 2nd January 2019
Abstract
Highly stable graphene quantum dots (HSGQDs) are widely observed in the initial stages of graphene chemical vapor deposition (CVD) growth on lattice-mismatched transition metal surfaces, e.g. Ru(0001), but their formation mechanism has so far remained a mystery. Using a combination of density functional theory calculations and theoretical modeling, we show that the sizes and the morphologies of HSGQDs are determined by the interaction of the graphene edge to the metal substrate interaction, which in turn, is modulated by the moiré superstructure, while the relatively weak interaction of the central atoms of graphene (or graphene bulk atoms (GB)) with the substrate plays a secondary role. The theoretical understanding of the effect of moiré superstructure on graphene CVD growth allows us to predict the formation of HSGQDs on various metal surfaces and provides a guideline to select the best catalyst for graphene growth.
Conceptual insightsOne of the very important experimental observations, during the graphene growth on lattice-mismatched surfaces, is the formation of high-stable graphene quantum dots (HSGQDs). As extensively demonstrated in the literature, the formation of HSGQDs is a critical step of graphene chemical vapor deposition (CVD) growth and, therefore, determines both the nucleation and growth of graphene on these metal surfaces. The underlying mechanism of the HSGQDs, however, remains a mystery until now. The main theoretical challenge of exploring the formation process of HSGQDs is the huge size of systems, which prevents a complete theoretical exploration by high-accurate density functional study. So far, the lack of the understanding of the growth mechanism is the main hindrance for the controllable synthesis of graphene on these metal surfaces. Here we propose a general method to circumvent the prohibitive computational burden and report a full understanding of the mechanism of HSGQDs. With the new computational approach, we discovered that the formation of HSGQDs originates from the moiré superstructure induced periodic modulation of graphene–metal interaction. Based on the new understanding, we reproduced all the experimentally observed HSGQDs precisely. Besides, our analysis can be easily applied to explore the mechanism of CVD growth of other 2D materials on a lattice-mismatched substrate. |
The attractive physical and chemical properties of graphene have excited intense research interest on the synthesis of high-quality large area graphene films.1 Among the various methods used for graphene synthesis, chemical vapor deposition (CVD) has been considered to be the most promising way to achieve this goal.2 However, it is difficult to optimize high reproducibility graphene synthesis in this process, since CVD graphene growth is highly sensitive to a large number of critical experimental parameters, including the type and quality of the catalyst, the nature of the carbon feedstock, the flow and pressure of the carrier gas, and the growth temperature.3 So far, a variety of transition metals have been used as catalysts for graphene CVD growth, and the growth behavior has been found to be highly dependent on the type of catalyst. The mechanism of graphene CVD growth on close-packed (111) surfaces of Ni and Cu, which have nearly the same lattice constant as graphene, has been extensively explored.2,4–13 Besides Cu and Ni, noble transition metals such as Ru, Pt, Pd, Rh and Ir, whose lattice constants are about ∼10% larger than that of graphene, have also been widely adopted as catalysts for graphene CVD growth. Graphene grown on noble metal surfaces has the advantage that it can be directly used in many applications, for example, as a template to grow uniformly distributed metal clusters14,15 and for the self-assembly of organic molecules.16 Despite these advantages, the mechanism of graphene growth on noble transition metals has not been investigated in detail. This may be due to the innate complexity of the process, arising from complex moiré patterns created when graphene is formed on a lattice-mismatched metal surface, and our current understanding on how the lattice mismatch or the moiré superstructure affects graphene growth, is still very limited.
An intriguing phenomenon observed during graphene CVD growth on a metal surface, is the formation of magic-sized carbon clusters at the nucleation stage.17–19 In previous theoretical studies, such structures have been explained to result from the reconstruction of small graphene domains such as C21 or C24.17,18 The formation of HSGQDs, which can be considered to be super-large carbon clusters, has also been widely observed on noble metal surfaces, especially on the Ru(0001) surface. The most detailed experimental study on the formation of HSGQDs on the Ru(0001) surface was reported by Lu et al.,20 where, using C60 molecules as a feedstock, they observed a series of magic-sized HSGQDs on Ru(0001) surface at 725 K. It was found that a majority of these HSGQDs had well-defined shapes such as triangle, truncated triangle, parallelogram, trapezoid or hexagon, with sizes ranging from 2 nm to tens of nm.20 However, the two most frequently observed are hexagonal clusters with a dome-like area at the center and six smaller domes located at the six vertices (Fig. 1d and f), and triangular ones with three domes at the three vertices (Fig. 1c and e). Such HSGQDs on Ru(0001) surface have also been observed by Donner et al.,21 Natterer et al.,22 and Cui et al.19 using different types of carbon feedstocks.
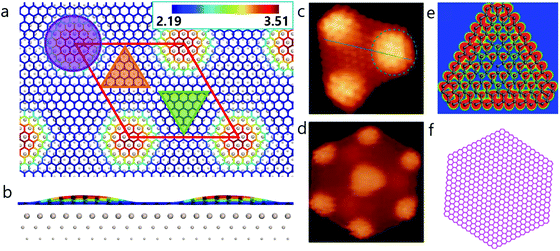 | ||
| Fig. 1 Moiré superstructure of graphene and highly stable graphene quantum dots on Ru(0001). Top (a) and side (b) view of relaxed graphene on a Ru(0001) surface. The circle, upward, and downward triangles indicate ATOP, HCP, and FCC regions of graphene on Ru(0001) surface, respectively. The color scale in panel (a and b) represents the distance (in Å) from a carbon atom in graphene to the substrate. Experimental STM images of (c) triangular and (d) hexagonal HSGQDs adapted from ref. 20 and corresponding structures of triangular HSGQD (shown in panel e) proposed by Lu et al.20 and (f) the hexagonal HSGQD with a lateral size similar to that measured experimentally (5 nm).20 | ||
Our density functional theory (DFT) calculations (Fig. 1a and b) show that the dome region in a HSGQD corresponds to the ATOP configuration of graphene on the Ru(0001) surface, with a height of ∼3.5 Å from the topmost Ru surface. The other two high symmetry regions, denoted as FCC and HCP hereafter, have much shorter distances to the metal surface, of ∼2.19 and 2.24 Å, respectively. These results are in good agreement with previously reported values from experimental characterization23 and theoretical calculations.24,25 Careful examination of the experimental data20–22 confirms that all the observed HSGQDs exhibit the following common features: (i) they all have regular polygonal shapes with periodically distributed moiré patterns in the central area; (ii) the edges of all the HSGQDs are zigzag edges; (iii) each vertex of a HSGQD is shaped in the form of a dome, and (iv) the hill area of the vertex of a HSGQD is smaller than the central area, which means that the edges of a HSGQD invariably cut through the ATOP regions of the moiré pattern.
It is important to note here, that similar features are also observed in large-area graphene growth on Ru(0001) surface, where the graphene edge shows a zigzag structure and its expansion occurs in a block-by-block manner. Such a block-by-block growth behavior has been experimentally observed in graphene26 or hexagonal boron nitride27 grown on Rh(111), which should be due to the different attach probabilities at different edge sites as revealed by Wu et al.28 Therefore, it is a general phenomenon of 2D materials’ epitaxial growth on a lattice mismatched substrate.
The results described in the previous paragraph clearly indicate that the moiré superstructure of graphene on noble metal surfaces has a large impact on the nucleation and growth of graphene. Thus, a deep insight into the formation mechanism of HSGQDs is critical to understanding the mechanism of graphene growth on these metal surfaces. Unfortunately, the huge size of the HSGQDs, several thousands of carbon atoms, plus a great number of atoms in the substrate makes the direct first principle calculations prohibitive. In this study, we propose a general method to circumvent the prohibitive computational burden by numerically fitting the graphene–metal interaction with the first principle results as targets. Then, we search the high stable graphene QDs of various possible shapes and sizes. The optimized HSGQDs on Ru can well match the experiment results, validating the proposed method. Finally, the HSGQDs on other metal surfaces are discussed based on the insights we obtained in this study. Our theoretical study reveals the origin of their high stability, edge structure, and the role of moiré superstructure in graphene growth mechanism.
Moiré superstructures are observed when graphene is grown or placed on a lattice-mismatched substrate, e.g., Ru(0001),29 Rh(111),30 Pt(111)31 and Ir(111).32 In the case of Ru, the in-plane lattice constant of the Ru(0001) surface is ∼9% larger than that of graphene. This relatively small lattice mismatch leads to a moiré pattern with a periodicity of 2.95 nm (see Fig. 1a and b). More specifically, inside a moiré unit cell, both the in-plane position of graphene with respect to the substrate, and the distance between graphene and the substrate are varied. There are generally three high symmetry regions in the unit cell of the moiré pattern, namely, ATOP, HCP and FCC (see Fig. 1a); these have been clearly described in the literature.23,33 As shown in Fig. 1a and b, the vertical distance between graphene and the Ru(0001) surface periodically oscillates between 2.19 and 3.50 Å.23,33,34 The significant difference in the graphene–substrate separation at different positions implies a corresponding modification of the adhesion between the graphene bulk atoms and the metal surface (GB–M). Such a periodic oscillation in adhesion between graphene and the Ru surface must necessarily influence the formation of HSGQDs significantly.
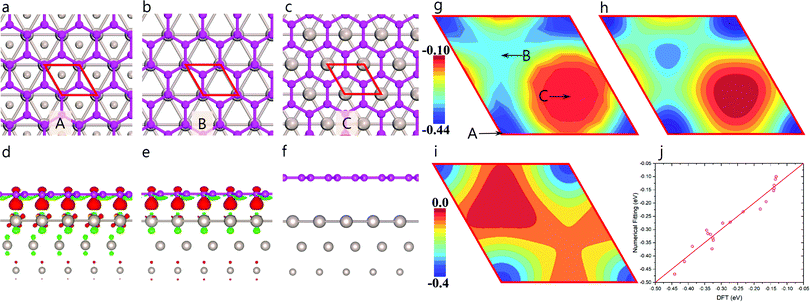
To quantitatively study the oscillation in GB–M adhesion (EGB–M), we calculated EGB–M as a function of the in-plane position of the graphene lattice on a Ru(0001) surface using a 1 × 1 lattice-matched graphene/Ru(0001) structure (Fig. 2a–c); the results are shown in Fig. 2g (Section S1 of the ESI† gives a detailed description of the method and the model used in the calculation). The three high symmetry configurations labeled as A, B, and C in Fig. 2g corresponding to the HCP, FCC, and ATOP regions of the moiré pattern, are depicted in Fig. 2a, b and c, respectively. It is found that the values of EGB–M are, respectively, ∼−0.218 and −0.158 eV per carbon atom, for the HCP and FCC configurations, both of which are significantly higher than that for the ATOP configuration, which is ∼−0.067 eV per atom. The strong EGB–M interaction in the HCP and FCC configurations (Fig. 2a and b) can be attributed to a significant charge transfer between graphene and the Ru(0001) surface. As seen clearly in Fig. 2d and e, in both configurations, one of the two carbon atoms in the primitive cell is located over a Ru atom of the topmost layer of the substrate and interacts with the metal atom through a strong chemical binding, leading to significant charge transfer. In contrast, the charge transfer between graphene and the substrate in the ATOP configuration is negligible (Fig. 2c and f), indicating in the case, a van der Waals (VDW) type interaction. The strong adhesion also results in only one preferred orientation of graphene domain on the Ru(0001) surface.3
Based on the discussion in the previous section, we conclude that the distribution of EGB–M in a moiré unit cell is highly inhomogeneous, where the interaction between a graphene C atom and the substrate is a periodic function of the location of the carbon atom relative to the Ru(0001) surface, i.e., EGB–M(r). Therefore, the total formation energy of a GQD can be calculated as,
 | (1) |
Next, we generate zigzag-edged GQDs of different sizes and shapes (ESI,† Section S2 gives a detailed description on the generation of GQDs with various shapes). Their formation energies are then optimized using the expression for graphene–Ru interaction as shown in eqn (1). The lowest formation energies for GQD of a certain size are plotted in Fig. 3a, which can be fitted with the following equation
 | (2) |
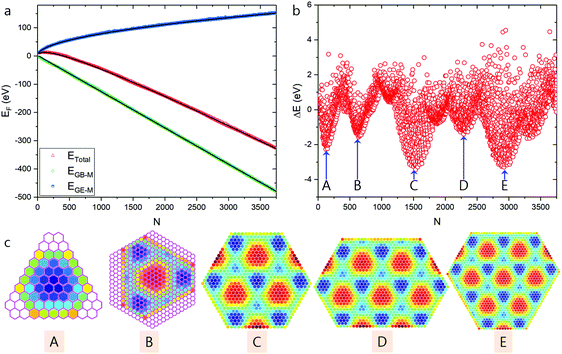 | ||
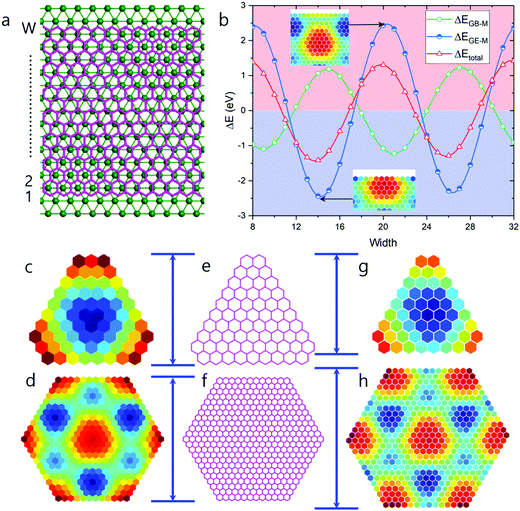
| Fig. 3 High stable graphene quantum dots predicted based on modulated graphene bulk–metal interaction. (a) Total formation energies of the optimized GQDs and the contributions from graphene edge–metal (EGE–M) and graphene bulk–metal (EGB–M) interactions. (b) The difference between calculated formation energies of optimized GQDs and the fitted values. (c) Structures of GQDs corresponding to the local minima shown in panel (b), where the color scale denotes the average EGB–M (in eV) per hexagon in the GQDs. Honeycomb lattices shown in pink represent the structures of the two smallest GQDs extracted from experimental STM images (see Fig. 1c and d). | ||
As shown in Fig. 3c, a series of HSGQDs of various shapes are identified. The plot of the formation energy difference (Fig. 3b) clearly indicates that the formation energies of these structures are ∼2 to 4 eV lower than the average fitting value and therefore, their high stability and large population under near-thermal-equilibrium conditions is expected. Nevertheless, when compared with experimentally observed HSGQDs, significant differences are seen: (i) the shapes of the two smallest HSGQDs derived from our calculations are very different from those experimentally observed, e.g., that with one dome in the center does not present a hexagonal shape; (ii) the vertices of each HSGQD are not at the ATOP positions on the metal surface; (iii) for each of the HSGQDs shown in Fig. 3c, three edges cut through the dome region of the moiré superstructure, but the other three pass preferentially through the valley area between domes. These features can be easily understood when considering the optimization of EGB–M. Among the three typical graphene regions on Ru(0001), the HCP region has the largest binding energy and all the configurations shown in Fig. 3c tend to maximize HCP areas and minimize areas with ATOC configuration; thus, the ratios of the HCP to ATOP region for the structures shown in Fig. 3c from A to E are, respectively, 1![[thin space (1/6-em)]](https://www.rsc.org/images/entities/char_2009.gif) :
:![[thin space (1/6-em)]](https://www.rsc.org/images/entities/char_2009.gif) 0, 3
0, 3![[thin space (1/6-em)]](https://www.rsc.org/images/entities/char_2009.gif) :
:![[thin space (1/6-em)]](https://www.rsc.org/images/entities/char_2009.gif) 1, 7
1, 7![[thin space (1/6-em)]](https://www.rsc.org/images/entities/char_2009.gif) :
:![[thin space (1/6-em)]](https://www.rsc.org/images/entities/char_2009.gif) 4.5, 10
4.5, 10![[thin space (1/6-em)]](https://www.rsc.org/images/entities/char_2009.gif) :
:![[thin space (1/6-em)]](https://www.rsc.org/images/entities/char_2009.gif) 7, 12
7, 12![[thin space (1/6-em)]](https://www.rsc.org/images/entities/char_2009.gif) :
:![[thin space (1/6-em)]](https://www.rsc.org/images/entities/char_2009.gif) 8.5. Here, a cut ATOP site at an edge of the GQD is counted as 0.5.
8.5. Here, a cut ATOP site at an edge of the GQD is counted as 0.5.
The observed disagreement between our predicted configurations and experimentally observed HSGQDs implies that besides the modulated EGB–M interaction, other factors need to be taken into account. In previous studies, we have demonstrated that the structure and alignment of small graphene domains on a Cu surface is largely determined by the graphene edge–catalyst interaction. This is due to the very strong interaction of a graphene edge to the metal substrate (GE–M), which can be in the range of ∼2 to 3 eV per edge atom.35 In our model, the structure modulation due to graphene edge–catalyst interaction was ignored, which may be the reason behind the observed discrepancies between the predicted and experimentally-observed HSGQD structures. In the following, we discuss the moiré superstructure modulated EGE–M interaction to predict the structure of HSGQDs.
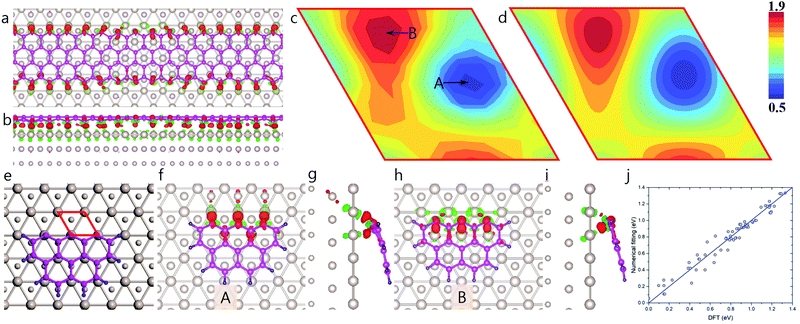
Fig. 4a and b clearly demonstrate that the charge transfer between an edge carbon atom and the Ru surface also depends critically on the location of the atom. Edge carbon atoms must therefore have different binding strengths to the Ru surface, depending on where they are located. The calculated two-dimensional map of EGB–M(r) shown in Fig. 4c is extracted from a hydrogen-terminated carbon cluster with three zigzag sites in direct contact with the Ru(0001) surface (Fig. 4e–i). The global minimum of EGB–M(r) is 0.505 eV per atom, corresponds to the configuration, where the dangling σ-bond of an edge carbon atom directly points towards a Ru atom (Fig. 4f and g). In such a configuration, the strong covalent binding between the C and Ru atoms is evidenced by the large charge transfer between edge carbon atoms and the Ru atoms (Fig. 4g). In contrast, in the configuration corresponding to the highest formation energy, 1.835 eV, (B in Fig. 4c), the dangling σ-bond of edge carbon atoms are not able to directly bond to any Ru atom of the substrate (see Fig. 4h and i).
The calculated EGE–M(r) values were fitted with a set of periodic functions in a manner similar to that employed for EGB–M, and the result is shown in Fig. 4d. Here again, the very small errors in fitting shown in Fig. 4j, validate the high quality of the fitting. The detailed fitting procedure can be found in ESI,† Section S3.
Next, we have repeated our HSGQDs search, while considering moiré pattern-modulated graphene edge–catalyst interaction. The formation energies of such optimized GQDs, as well as the difference in formation energy between calculated and fitted values, are shown in Fig. 5a and b, respectively. Fig. 5c presents the different HSGQDs that have been identified, along with STM images of experimentally observed HSGQDs.20 It is clearly seen that all the HSGQD structures optimized using our calculation are in perfect agreement with the experimentally observed structures. For example, each and every vertex of a HSGQD is located in an ATOP position, and all the HSGQD edges cut through the ATOP areas of the moiré pattern. Besides, we have been successful in identifying experimentally observed structures corresponding to all the six HSGQDs predicted by the new method. For all these structures, the number of the HCP blocks is close to that of the ATOP blocks, and the HCP/ATOP ratios for the structures from A to F are, 1![[thin space (1/6-em)]](https://www.rsc.org/images/entities/char_2009.gif) :
:![[thin space (1/6-em)]](https://www.rsc.org/images/entities/char_2009.gif) 1.5, 3
1.5, 3![[thin space (1/6-em)]](https://www.rsc.org/images/entities/char_2009.gif) :
:![[thin space (1/6-em)]](https://www.rsc.org/images/entities/char_2009.gif) 4, 5
4, 5![[thin space (1/6-em)]](https://www.rsc.org/images/entities/char_2009.gif) :
:![[thin space (1/6-em)]](https://www.rsc.org/images/entities/char_2009.gif) 6, 7
6, 7![[thin space (1/6-em)]](https://www.rsc.org/images/entities/char_2009.gif) :
:![[thin space (1/6-em)]](https://www.rsc.org/images/entities/char_2009.gif) 7.5, 8
7.5, 8![[thin space (1/6-em)]](https://www.rsc.org/images/entities/char_2009.gif) :
:![[thin space (1/6-em)]](https://www.rsc.org/images/entities/char_2009.gif) 10 and 10
10 and 10![[thin space (1/6-em)]](https://www.rsc.org/images/entities/char_2009.gif) :
:![[thin space (1/6-em)]](https://www.rsc.org/images/entities/char_2009.gif) 10, respectively.
10, respectively.
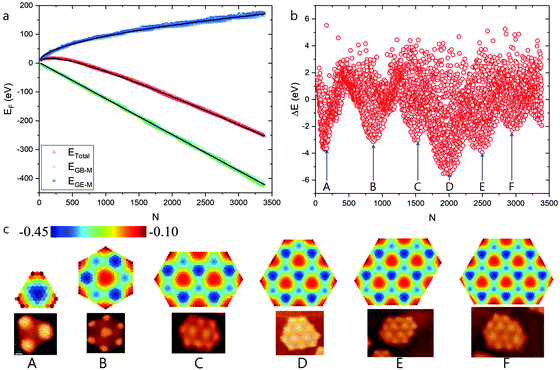 | ||
| Fig. 5 High stable graphene quantum dots on Ru(0001) surface predicted by modulated graphene bulk–metal and graphene edge–metal interaction. (a) The formation energies of the optimized GQD, the contributions of graphene edge–metal interaction and the graphene bulk–metal interactions, respectively. (b) Formation energy difference between the calculated and fitted values. (c) Structures of HSGQDs correspond to the local minima shown in panel (b) and the STM images of highly stable GQDs (reproduced from ref. 20) obtained by experiments.20 The color scale denotes the average EGB–M (in eV) for each hexagon in GQDs. | ||
It has been demonstrated that for graphene on Ru(0001), an ATOP region has the lowest EGB–M interaction.25 So, the relatively larger number of ATOP blocks in the newly found HSGQDs implies a competition between the GE–M and GB–M interactions. In order to clearly understand this competition, we plot the deviations of EGE–M (ΔEGE–M), EGB–M (ΔEGB–M), and the total formation energy from the average values (ΔEtotal = ΔEGE–M + ΔEGB–M) during the propagation of a graphene edge on the Ru(0001) surface in Fig. 6b. The figure clearly shows that ΔEtotal minima appear when the edge position passes through the ATOP regions, which corresponds to the configuration, where the edge carbon atoms are located between two rows of Ru atoms. It is interesting to note that the oscillations in EGB–M and EGE–M are opposed to each other; in other words, a minimum of ΔEGE–M roughly corresponds to a maximum of ΔEGB–M. The amplitude of the oscillation in ΔEGE–M of 4.865 eV, is ∼37% larger than that for ΔEGB–M, which is 3.556 eV. Consequently, ΔEtotal is dictated largely by ΔEGE–M.
To further understand the interplay between EGB–M and EGE–M, we tried to find other HSGQDs structures with variable EGE–M(r), (a function of the atomic position), but keeping EGB–M constant for all carbon atoms. The plot of ΔE (formation energy difference) obtained in this case, is very similar to what we show in Fig. 2b (see Fig. S2 in ESI,† Section S4) and the shapes of the identified GQDs are similar to those shown in Fig. 5c. But the sizes of these HSGQDs are generally different from those obtained above. In Fig. 6c–h, we summarize the results on triangular and hexagonal GQDs; Fig. 6c and d are structures predicted by considering the oscillation of both GB–M and GE–M interactions, and Fig. 6g and h are those where only the oscillation in the latter term was considered. By comparing the sizes of our predicted structures with those experimentally observed, we conclude that the GB–M interaction also plays an important role in determining the size and stability of HSGQDs.
The above discussion can be easily generalized to graphene growth on different metallic surfaces with a significant lattice mismatch with respect to graphene. As demonstrated above, either a large oscillation of GB–M interaction, or that of GE–M interaction, could lead to the formation of HSGQDs. Since a graphene edge atom interacts with the metal substrate through a strong covalent bond, the binding strength must depend on the exact position of the atom, and therefore, oscillations in GE–M interaction should significantly influence the growth of graphene on all transition metal surfaces.
Among the various metallic surfaces explored for graphene CVD growth, the Rh(111) surface is very similar to Ru(0001). A high EGB–M oscillation was verified for the Rh(111) surface by the large variations in distance between graphene and the metal surface;34 the lattice mismatch between graphene and the metal is ∼9.3%. Thus, it is reasonable to expect the formation of HSGQDs on Rh(111) similar to those on Ru(0001). Experimentally, the formation HSGQDs and the block-by-block growth of graphene on Rh(111) surface have already been reported.26
For metals like Ir(111), Pt(1111), Pd(111), and Au(111), the GB–M interaction between graphene and the metal surface is relatively weak and the oscillation should be very small (Table 1). Considering the large lattice mismatch between graphene and these metallic surfaces, the oscillation of GE–M interaction should result in HSGQDs,36–39 especially, on the Au(111) surface, where the 17% lattice mismatch leads to a smaller moiré pattern. Therefore, HSGQDs on this system should be much smaller than those on other metal surfaces. However, it has been experimentally found that the hexagonal lattice of a graphene domain grown on these metal surfaces may align in many different orientations due to the weak GB–M interaction, and this domain rotation should result in a greatly reduced moiré pattern size. Thus, the formation mechanism of HSGQDs in such cases may be very different from that on metal surfaces with a strong GB–M interaction such as Ru(0001) and Rh(111).
For graphene grown on metallic surfaces with a small lattice mismatch, e.g., Ni(111) and Co(0001), the perfect lattice match will eliminate oscillation in both GB–M and GE–M interactions. Consequently, graphene domains of any arbitrary shape or size will be formed on these surfaces. Besides graphene, the highly stable quantum dots should also occur for other 2D materials, e.g., hexagonal boron nitride, silicene, and phosphorene, on condition that there are position-modulated adhesion interaction and their edge–metal interaction. However, the symmetry and structural reconstruction would also affect the shapes and sizes of such high stable quantum dots.
In summary, we have systematically investigated the underlying mechanism of HSGQDs formation on Ru(0001) surface. Our detailed analysis indicates large oscillations in both GB–M and GE–M interactions. A search for the different HSGQDs structure showed that on the Ru(0001) surface, the sizes and shapes of the HSGQDs are mainly determined by the moiré superstructure-modulated GE–M interaction, while the oscillation in GB–M interaction plays a secondary role. Besides, we also predict the formation of HSGQDs on most catalyst surfaces with a large lattice mismatch with respect to graphene, such as Rh(111), It(111), Pt(111), Pd(111), and Au(111). Thus, our theoretical study serves to reveal the atomic mechanism of HSGQDs formation and provides guidelines for catalyst selection to achieve optimized graphene growth.
Methods
All first principle calculations were carried out using the Vienna Ab initio simulation package (VASP).51 The Perdew–Burke–Ernzerhof52 type exchange–correlation functional was used to describe the interaction between electrons, while the interaction between electrons and ions was modeled by projector-augmented wave pseudopotential.53 The wavefunctions were expanded by plane wave basis sets with an energy cutoff of 400 eV. The convergence criteria for energies and forces were set to be 1.0 × 10⁻⁶ eV and 0.01 eV Å−1, respectively. The k-point meshes were 25 × 25 and 1 × 1, respectively, for calculating two-dimensional map of EGB–M and EGE–M, between graphene and Ru(0001) surface; detailed structural models are illustrated in Fig. 2a and 4e. The van der Waals correction method proposed by Grimme et al. (DFT-D3)54 was also adopted in the first principle calculations. The minimum vertical height between graphene and Ru(0001) was found to be ∼2.19 Å based on the DFT-D3 method, which was in good agreement with previous studies.55 Since the growth temperatures are generally far below the melting temperature of Ru,20–22 we only consider a crystalline surface of Ru(0001) in our simulations. The formation energy (EF) of graphene quantum dots is the best descriptor to characterize the thermodynamic stability of GQDs on Ru(0001) surface, which is defined as EF = E(GQD/Ru) − E(Ru) − N × E(G), where E(GQD/Ru), E(Ru), and E(G) are the total energies of GQD on the substrate, the Ru substrate, and the energy of carbon atom in a freestanding graphene, respectively, while N is the total number of carbon atoms in the GQD.Conflicts of interest
There are no conflicts to declare.Acknowledgements
Authors thank financial support from Institute for Basic Science of South Korea (IBS-R019-D1). L. Z. acknowledges support from NSFC (Grant no. 11504122 and 11704141) and Natural Science Foundation of the Jiangsu Higher Education Institutions of China (Grant no. 18KJA140001 and 15KJB140001).References
- A. C. Neto, F. Guinea, N. M. Peres, K. S. Novoselov and A. K. Geim, Rev. Mod. Phys., 2009, 81, 109 CrossRef.
- X. Li, W. Cai, J. An, S. Kim, J. Nah, D. Yang, R. Piner, A. Velamakanni, I. Jung and E. Tutuc, Science, 2009, 324, 1312–1314 CrossRef CAS PubMed.
- H. Tetlow, J. P. de Boer, I. Ford, D. Vvedensky, J. Coraux and L. Kantorovich, Phys. Rep., 2014, 542, 195–295 CrossRef CAS.
- Z. Xu, T. Yan, G. Liu, G. Qiao and F. Ding, Nanoscale, 2016, 8, 921–929 RSC.
- T. Wu, X. Zhang, Q. Yuan, J. Xue, G. Lu, Z. Liu, H. Wang, H. Wang, F. Ding and Q. Yu, Nat. Mater., 2016, 15, 43 CrossRef CAS PubMed.
- J. Gao, J. Yip, J. Zhao, B. I. Yakobson and F. Ding, J. Am. Chem. Soc., 2011, 133, 5009–5015 CrossRef CAS PubMed.
- L. Wang, X. Zhang, H. L. Chan, F. Yan and F. Ding, J. Am. Chem. Soc., 2013, 135, 4476–4482 CrossRef CAS PubMed.
- H. Shu, X. Chen and F. Ding, Chem. Sci., 2014, 5, 4639–4645 RSC.
- X. Zhang, Z. Xu, L. Hui, J. Xin and F. Ding, J. Phys. Chem. Lett., 2012, 3, 2822–2827 CrossRef CAS.
- W. Zhang, P. Wu, Z. Li and J. Yang, J. Phys. Chem. C, 2011, 115, 17782–17787 CrossRef CAS.
- Z. Li, P. Wu, C. Wang, X. Fan, W. Zhang, X. Zhai, C. Zeng, Z. Li, J. Yang and J. Hou, ACS Nano, 2011, 5, 3385–3390 CrossRef CAS PubMed.
- P. Wu, Y. Zhang, P. Cui, Z. Li, J. Yang and Z. Zhang, Phys. Rev. Lett., 2015, 114, 216102 CrossRef PubMed.
- R. G. Van Wesep, H. Chen, W. Zhu and Z. Zhang, J. Chem. Phys., 2011, 134, 171105 CrossRef PubMed.
- S. Bleikamp, P. J. Feibelman and T. Michely, Phys. Rev. Lett., 2006, 97, 215501 CrossRef PubMed.
- Y. Pan, M. Gao, L. Huang, F. Liu and H.-J. Gao, Appl. Phys. Lett., 2009, 95, 093106 CrossRef.
- J. Mao, H. Zhang, Y. Jiang, Y. Pan, M. Gao, W. Xiao and H.-J. Gao, J. Am. Chem. Soc., 2009, 131, 14136–14137 CrossRef CAS PubMed.
- J. Gao and F. Ding, Angew. Chem., Int. Ed., 2014, 53, 14031–14035 CrossRef CAS PubMed.
- Q. Yuan, J. Gao, H. Shu, J. Zhao, X. Chen and F. Ding, J. Am. Chem. Soc., 2011, 134, 2970–2975 CrossRef PubMed.
- Y. Cui, Q. Fu, H. Zhang and X. Bao, Chem. Commun., 2011, 47, 1470–1472 RSC.
- J. Lu, P. S. E. Yeo, C. K. Gan, P. Wu and K. P. Loh, Nat. Nanotechnol., 2011, 6, 247 CrossRef CAS PubMed.
- K. Donner and P. Jakob, J. Chem. Phys., 2009, 131, 164701 CrossRef PubMed.
- F. Natterer, S. Rusponi, M. Papagno, C. Carbone and H. Brune, J. Phys.: Condens. Matter, 2012, 24, 314203 CrossRef CAS PubMed.
- W. Moritz, B. Wang, M.-L. Bocquet, T. Brugger, T. Greber, J. Wintterlin and S. Günther, Phys. Rev. Lett., 2010, 104, 136102 CrossRef CAS PubMed.
- L. Gao, Y. Liu, T. Ma, R. Shi, Y. Hu and J. Luo, Appl. Phys. Lett., 2016, 108, 261601 CrossRef.
- D. Stradi, S. Barja, C. Díaz, M. Garnica, B. Borca, J. Hinarejos, D. Sánchez-Portal, M. Alcamí, A. Arnau and A. V. de Parga, Phys. Rev. B: Condens. Matter Mater. Phys., 2013, 88, 245401 CrossRef.
- G. Dong and J. W. Frenken, ACS Nano, 2013, 7, 7028–7033 CrossRef CAS PubMed.
- G. Dong, E. B. Fourré, F. C. Tabak and J. W. Frenken, Phys. Rev. Lett., 2010, 104, 096102 CrossRef PubMed.
- P. Wu, H. Jiang, W. Zhang, Z. Li, Z. Hou and J. Yang, J. Am. Chem. Soc., 2012, 134, 6045–6051 CrossRef CAS PubMed.
- S. Marchini, S. Günther and J. Wintterlin, Phys. Rev. B: Condens. Matter Mater. Phys., 2007, 76, 075429 CrossRef.
- M. Sicot, S. Bouvron, O. Zander, U. Rüdiger, Y. S. Dedkov and M. Fonin, Appl. Phys. Lett., 2010, 96, 093115 CrossRef.
- P. Merino, M. Švec, A. L. Pinardi, G. Otero and J. A. Martín-Gago, ACS Nano, 2011, 5, 5627–5634 CrossRef CAS PubMed.
- J. Coraux, T. N. Plasa, C. Busse and T. Michely, New J. Phys., 2008, 10, 043033 CrossRef.
- B. Wang, M.-L. Bocquet, S. Marchini, S. Günther and J. Wintterlin, Phys. Chem. Chem. Phys., 2008, 10, 3530–3534 RSC.
- E. Voloshina and Y. Dedkov, Phys. Chem. Chem. Phys., 2012, 14, 13502–13514 RSC.
- H. Shu, X. Chen, X. Tao and F. Ding, ACS Nano, 2012, 6, 3243–3250 CrossRef CAS PubMed.
- S.-h. Phark, J. Borme, A. L. Vanegas, M. Corbetta, D. Sander and J. r. Kirschner, ACS Nano, 2011, 5, 8162–8166 CrossRef CAS PubMed.
- S. K. Hämäläinen, Z. Sun, M. P. Boneschanscher, A. Uppstu, M. Ijäs, A. Harju, D. Vanmaekelbergh and P. Liljeroth, Phys. Rev. Lett., 2011, 107, 236803 CrossRef PubMed.
- D. Subramaniam, F. Libisch, Y. Li, C. Pauly, V. Geringer, R. Reiter, T. Mashoff, M. Liebmann, J. Burgdörfer and C. Busse, Phys. Rev. Lett., 2012, 108, 046801 CrossRef CAS PubMed.
- S.-h. Phark, J. Borme, A. L. Vanegas, M. Corbetta, D. Sander and J. Kirschner, Nanoscale Res. Lett., 2012, 7, 255 CrossRef PubMed.
- P. Stojanov, E. Voloshina, Y. Dedkov, S. Schmitt, T. Haenke and A. Thissen, Procedia Eng., 2014, 93, 8–16 CrossRef CAS.
- A. Martín-Recio, C. Romero-Muñiz, A. J. Martínez-Galera, P. Pou, R. Pérez and J. M. Gómez-Rodríguez, Nanoscale, 2015, 7, 11300–11309 RSC.
- E. N. Voloshina, E. Fertitta, A. Garhofer, F. Mittendorfer, M. Fonin, A. Thissen and Y. S. Dedkov, Sci. Rep., 2013, 3, 1072 CrossRef CAS PubMed.
- C. Busse, P. Lazić, R. Djemour, J. Coraux, T. Gerber, N. Atodiresei, V. Caciuc, R. Brako, S. Blügel and J. Zegenhagen, Phys. Rev. Lett., 2011, 107, 036101 CrossRef PubMed.
- P. Sutter, J. T. Sadowski and E. Sutter, Phys. Rev. B: Condens. Matter Mater. Phys., 2009, 80, 245411 CrossRef.
- M. Vanin, J. J. Mortensen, A. Kelkkanen, J. M. Garcia-Lastra, K. S. Thygesen and K. W. Jacobsen, Phys. Rev. B: Condens. Matter Mater. Phys., 2010, 81, 081408 CrossRef.
- J. Tesch, P. Leicht, F. Blumenschein, L. Gragnaniello, M. Fonin, L. E. M. Steinkasserer, B. Paulus, E. Voloshina and Y. Dedkov, Sci. Rep., 2016, 6, 23439 CrossRef CAS PubMed.
- Y. Fukaya, S. Entani, S. Sakai, I. Mochizuki, K. Wada, T. Hyodo and S.-i. Shamoto, Carbon, 2016, 103, 1–4 CrossRef CAS.
- Y. Gamo, A. Nagashima, M. Wakabayashi, M. Terai and C. Oshima, Surf. Sci., 1997, 374, 61–64 CrossRef CAS.
- I. Hamada and M. Otani, Phys. Rev. B: Condens. Matter Mater. Phys., 2010, 82, 153412 CrossRef.
- D. Eom, D. Prezzi, K. T. Rim, H. Zhou, M. Lefenfeld, S. Xiao, C. Nuckolls, M. S. Hybertsen, T. F. Heinz and G. W. Flynn, Nano Lett., 2009, 9, 2844–2848 CrossRef CAS PubMed.
- G. Kresse and J. Furthmüller, Phys. Rev. B: Condens. Matter Mater. Phys., 1996, 54, 11169 CrossRef CAS.
- J. P. Perdew, K. Burke and M. Ernzerhof, Phys. Rev. Lett., 1996, 77, 3865–3868 CrossRef CAS PubMed.
- G. Kresse and D. Joubert, Phys. Rev. B: Condens. Matter Mater. Phys., 1999, 59, 1758–1775 CrossRef CAS.
- S. Grimme, J. Antony, S. Ehrlich and H. Krieg, J. Chem. Phys., 2010, 132, 154104 CrossRef PubMed.
- D. Martoccia, P. Willmott, T. Brugger, M. Björck, S. Günther, C. Schlepütz, A. Cervellino, S. Pauli, B. Patterson and S. Marchini, Phys. Rev. Lett., 2008, 101, 126102 CrossRef CAS PubMed.
Footnote |
| † Electronic supplementary information (ESI) available. See DOI: 10.1039/c8nh00383a |
| This journal is © The Royal Society of Chemistry 2019 |

