An insight into the molecular and surface state photoluminescence of carbon dots revealed through solvent-induced modulations in their excitation wavelength dependent emission properties†
Poojan Milan
Gharat
a,
Jiddhu M.
Chethodil
b,
Amit P.
Srivastava
c,
Praseetha
P. K.
b,
Haridas
Pal
 ad and
Sharmistha
Dutta Choudhury
 *ad
*ad
aRadiation & Photochemistry Division, Bhabha Atomic Research Centre, Mumbai 400 085, India. E-mail: sharmidc@barc.gov.in; Fax: +91-22-25505151; Tel: +91-22-25590296
bDepartment of Nanotechnology, Noorul Islam Centre for Higher Education, Kumaracoil, Kanyakumari District, Tamil Nadu 629180, India
cMechanical Metallurgy Division, Bhabha Atomic Research Centre, Mumbai 400085, India
dHomi Bhabha National Institute, Training School Complex, Anushaktinagar, Mumbai 400094, India
First published on 16th October 2018
Abstract
This study explores the intriguing modulations in the excitation wavelength dependence of carbon dot photoluminescence (PL), induced by the solvent medium. Our results indicate that different emissive states of carbon dots are stabilized to different extents by the surrounding solvent environment. Consequently, in some solvents, such as ethyl acetate and acetonitrile, the PL of the carbon dots is strongly dependent on the excitation wavelength, while in other solvents, like water, the PL of the same carbon dot becomes independent of the excitation wavelength. These observations contribute to the enhancement of our understanding of the photophysics and PL mechanisms of this important class of luminescent materials, especially to discriminate between the PL arising from the “molecular state” and the “surface state”.
Introduction
Carbon dots have come to occupy a prominent place in the presently available repertoire of luminescent materials. Due to many desirable properties, such as low toxicity, biocompatibility, photostability and ease of preparation, these luminophores are excellent entrants as optical probes for chemical and biological sensing, cellular imaging, photovoltaics and photonics.1–9 Structurally, carbon dots are largely spherical nanoparticles composed of sp2 hybridized carbon nanodomains embedded within a matrix of sp3 hybridized carbon.1,10 Their external surfaces are appended with a range of functional groups (hydroxyl, epoxy, carboxyl, amino) depending on the starting materials and preparation methods. Recent studies suggest that molecular fluorophores and polyaromatic hydrocarbons are also generated and remain associated with the carbon dot structures during bottom-up synthesis procedures.11–15The general optical properties of all carbon dots are surprisingly similar, regardless of the synthesis procedures or precursors used, suggesting some kind of intrinsic structural and functional similarity among diverse carbon dot systems. Extensive studies are being carried out to arrive at a cohesive model that can explain the interesting absorption/emission behavior of these materials and help in tuning their photoluminescence (PL) for various applications.10,16–21 Although a complete perception is still lacking, the picture regarding carbon dot PL that can be conjured so far from the collective efforts of many researchers is that the emission phenomenon arises due to the synergistic contributions of multiple optically active centres.10,22–28 Based on a consolidated examination of the varied descriptions available in the literature, it is surmised that the main optically active states present in carbon dots are the core, molecular and surface states.
The core states originate from isolated sp2 hybridized carbon fragments and conjugated π nanodomains embedded within the carbon dot. These states give rise to π–π* type of electronic transition.6,17,24,26,29 The molecular states arise due to the presence of specific molecular chromophores that may or may not be covalently linked with the main carbon dot structure and also from the quasi-molecular conformations formed by the electronic coupling of the edge carbon atoms and connected functional groups and heteroatoms.10,16,30–33 The molecular states generally lead to n–π* and some π–π* transitions of charge transfer character.6,24–26,29,34,35 Unlike the molecular states, the surface states of carbon dots do not consist of any well-defined molecular/quasi-molecular structures, but rather develop as an ensemble of low lying energy levels due to the presence of various functional groups that are randomly connected to the surface of the carbon dot. The surface state energy levels usually lead to weak, low energy electronic transitions.10,24–26
In a recent study, we have reported the exciting pH-dependent luminescence of carbon dots derived from lemon juice, and demonstrated their applications for designing logic gate operations.36 In this paper, we describe interesting solvent-induced changes in the PL of these carbon dots, especially the unique solvent dependent transformation in the nature of the PL, from being excitation wavelength independent in aqueous medium to being excitation wavelength dependent in a lower polarity, organic solvent medium. Our results indicate that the solvent-assisted modulations in the excitation wavelength dependence of the PL appear mainly due to different extents of solvatochromism exhibited by the molecular and surface states of carbon dots, making this a useful method to identify the PL arising from these states.
The effect of solvent media on carbon dot PL has been investigated in previous studies. For example, Sciortino et al. have found a linear correlation of the emission peak positions of carbon dots with the ENT solvent polarity parameter and suggested that these materials could be used as probes for sensing the polarity of the local solvent environment.37 Reckmeier et al. have examined the emission of carbon dots in water and dimethyl sulphoxide, and observed opposite solvatochromic shifts of the different emission bands, depending on the doping heteroatoms.24 They have further reported that in nitrogen and sulfur co-doped carbon dots, the fluorophore emission is strongly quenched by dimethyl sulphoxide, thus leading to the excitation wavelength dependent emission. Many recent studies have correlated the solvatochromism of carbon dots with the Lippert–Mataga function and Kamlet–Taft parameters, and have shown that both dipole–dipole interactions and specific H-bonding interactions are responsible for the observed shifts in the emission spectra of carbon dots in different solvents.37–41 However, to the best of our knowledge, the effect of excitation wavelength on solvatochromic behavior and the consequent alteration in the nature of the excitation wavelength dependent PL of carbon dots in different solvent media has not been systematically investigated so far. The interesting solvent-induced modulations observed in this study provide a newer perspective on the origin of excitation wavelength dependent PL in carbon dots.1 Furthermore, the present results reinstate the contributions of multiple emissive states of carbon dots on the observed PL and bring out their significant role in dictating the overall PL behavior under different solution conditions, especially due to the different extents of solvent stabilizations for the molecular and surface states.
Experimental
The carbon dot samples for the present study, LD1 and LD2, were synthesized by the direct thermal decomposition of lemon juice at 100 °C and 120 °C, respectively, as described in a previous publication (Note S1, ESI†).36 Since citric acid is a very common reagent for carbon dot synthesis, lemon juice was deemed suitable as an alternative “green” precursor.12,22,32,42 The experimental solutions were prepared by appropriately diluting small aliquots of the synthesized LD1 and LD2 stock samples in the studied solvents.The AFM images were recorded on a NT-MDT solver (model P47) instrument using a DLC tip in semicontact mode. The sample for AFM measurement was prepared by drop-casting a very dilute aqueous dispersion of carbon dots on a mica sheet, followed by drying under ambient conditions. TEM images were recorded with a Carl Zeiss Libra instrument at 120 kV by drop-casting the samples on carbon-coated copper grids. The FTIR spectra were recorded with an IR-Affinity-1 spectrometer (Shimadzu), using the diamond ATR setup. Absorption spectra were recorded with a Jasco UV-vis spectrophotometer (model V-650). Steady-state photoluminescence (PL) spectra were recorded with a Hitachi spectrofluorimeter (F-4510). The PL quantum yield was estimated by a comparative method, using quinine sulphate in 0.1 M H2SO4 solution as the reference (φref = 0.57).43
Time-resolved emission measurements were carried out using a time-correlated single photon counting (TCSPC) spectrometer (Horiba JobinYvon, UK). The samples were excited by light pulses from a nano-LED source (374 nm, repetition rate of 1 MHz) and the emission was detected at a magic angle configuration, using a PMT based detection module (model TBX4). The instrument response function (IRF) for the present setup is ∼185 ps. The PL decays were analyzed by the reconvolution method, considering multi-exponential decay functions. The quality of the fits and, consequently, the multi-exponential natures of the decays were judged by the reduced chi-square (χ2) values and the distribution of the weighted residuals among the data channels. For a good fit, the χ2 value was close to unity and the weighted residuals were distributed randomly around zero among the data channels.43 For the construction of time-resolved area-normalized emission spectra (TRANES), fluorescence decays were recorded over the entire emission spectrum of the samples at 10 nm intervals. These fluorescence decays were fitted to multiexponential functions, and the fitted decays were scaled with steady-state fluorescence intensities.44 The time-resolved emission spectra (TRES) were then constructed using these intensity-scaled decays and the TRES were subsequently normalized to unit area for generating the TRANES.45–47
Results and discussion
The AFM and TEM images of LD1 and LD2 are characteristic of carbon dot systems and show roughly spherical morphologies (Fig. 1 and 2). The LD2 carbon dots are relatively smaller in size (∼3–4 nm) than LD1 (∼7–8 nm), which is in accordance with previous reports that the size of carbon dots decreases at higher synthesis temperatures due to the enhanced formation of the carbogenic core.48 Though the TEM images of LD1 and LD2 are not of high resolution, they do not indicate any features of lattice fringes, suggesting that the particles do not belong to the family of graphene quantum dots. However, since the amorphous nature of the particles cannot be established unambiguously, we refer the synthesized LD1 and LD2 samples as carbon dots, considering this as a comprehensive designation of the carbon nanomaterials.10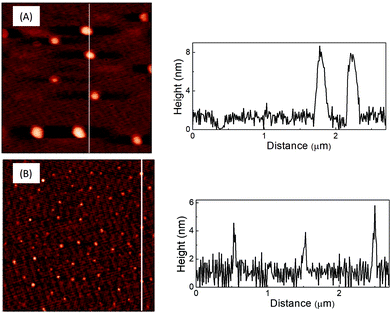 | ||
| Fig. 1 AFM images of (A) LD1 and (B) LD2 drop-casted on mica and the line profiles across the corresponding images. | ||
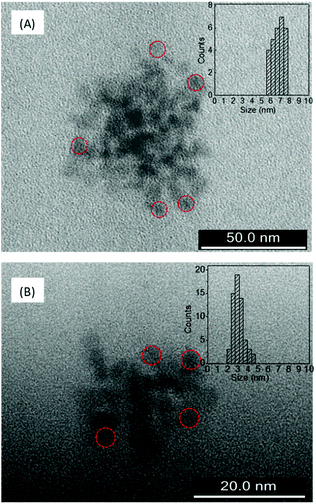 | ||
| Fig. 2 TEM images of (A) LD1 and (B) LD2 and the corresponding histograms showing particle size distributions. Some representative particles are circled for clarity of presentation. | ||
The FTIR spectra of LD1 and LD2 (Fig. S1, ESI†) have a broad peak with the maximum around 3400 cm−1 corresponding to the O–H stretching vibration, and several sharper peaks corresponding to the C![[double bond, length as m-dash]](https://www.rsc.org/images/entities/char_e001.gif) O stretching of undissociated carboxylic acid at 1725 cm−1, C
O stretching of undissociated carboxylic acid at 1725 cm−1, C![[double bond, length as m-dash]](https://www.rsc.org/images/entities/char_e001.gif) C stretching at 1638 cm−1 and C
C stretching at 1638 cm−1 and C![[double bond, length as m-dash]](https://www.rsc.org/images/entities/char_e001.gif) OH stretching at 1220 cm−1. These indicate that both carbon dots are covered with hydroxyl and carboxyl functional groups.36,49
OH stretching at 1220 cm−1. These indicate that both carbon dots are covered with hydroxyl and carboxyl functional groups.36,49
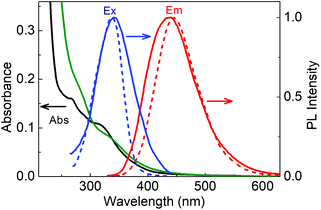
The absorption spectra of LD1 and LD2 dispersed in water (<0.2 mg ml−1) are presented in Fig. 3. Both the spectra show the typical features common to carbon dot systems, i.e., a band around 260–280 nm, attributed to the transitions of the carbogenic core, and another around 320–340 nm, due to the transitions of the molecular states.24,26 A weak absorption tail extending from the molecular state absorption band to about 500 nm is additionally seen for LD2 but not evident for LD1 (Fig. S2, ESI†). This long wavelength absorption is ascribed to the transitions in the surface states of carbon dots.24,26
When excited at 320 nm, both LD1 and LD2 emit typical blue luminescence, having the maximum around 440–445 nm (cf.Fig. 3 and Fig. S3, ESI†). The corresponding excitation spectra, monitored for the 445 nm emission, have a peak in the region of the molecular state absorption (around 340 nm), suggesting that the transitions of the molecular states (which possibly includes both chromophoric and quasi-molecular structures) are primarily responsible for the observed luminescence of the carbon dot samples at 445 nm. It may be noted, however, that both the excitation and emission spectra of LD2 are broader as compared to LD1, implying that the optical transitions in LD2 involve a wider distribution of electronic states than in LD1. In particular, it is indicated from the absorption spectra that LD2 possesses more contributions from surface states leading to an ensemble of low energy transitions (cf. broad absorption tail in Fig. 3 and Fig. S2, ESI†), whereas these states are possibly absent or passive in the case of LD1.
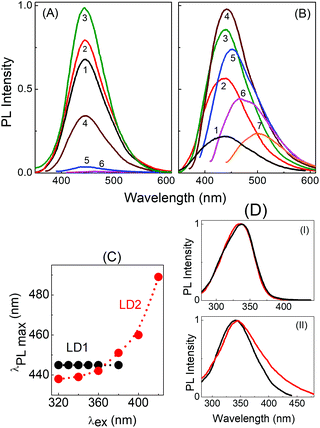
Fig. 4 depicts the PL spectra of the two carbon dots in aqueous medium upon excitation at different wavelengths. It is clearly seen that upon gradually increasing the excitation wavelength from 300 nm to 380 nm, the emission maximum in the PL spectra of LD1 remains effectively unchanged with the peak position around 445 nm (Fig. 4A and C). On the other hand, the emission maximum of LD2 shows a continuous redshift with increasing excitation wavelength (Fig. 4B and C). Furthermore, the PL intensity is very low in LD1 for excitation beyond 400 nm, whereas the spectra are quite prominent in LD2 even upon excitation at higher wavelengths. The PL quantum yields of the two carbon dots at different excitation wavelengths are provided in Table S1, ESI.†
The excitation spectra of LD1 and LD2 monitored at two emission wavelengths, 445 nm and 500 nm, are presented in Fig. 4D. Notably, the excitation spectra recorded for the longer wavelength emission (500 nm) of LD2 shows considerable tailing extending to lower energies, in agreement with the broad surface state absorption band of LD2. This clearly suggests that the longer wavelength emissions of this carbon dot originate at least partly due to the excitation of the surface states. For LD1, on the other hand, the excitation spectra at the two wavelengths are nearly overlapping, which substantiates the conjecture that surface states are either absent or remain quite passive in this carbon dot under the present solution conditions, and emission in LD1 originates mainly from the molecular states. It also explains the extremely weak emission intensities observed for LD1 upon excitation beyond 400 nm (cf.Fig. 4A and Table S1, ESI†).
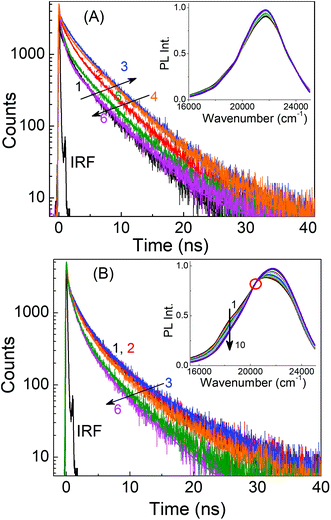
In a previous study, Li et al. proposed that excitation wavelength dependence is related to the surface states of carbon dots.50 They found that carbon dots prepared at low temperatures have their surface states passivated and hence their PL spectra are independent of the excitation wavelength, whereas at higher temperatures, the surface states are not passivated and the carbon dots display excitation wavelength dependence. In a separate study, Krysmann et al. reported that the PL of carbon dots obtained at low temperatures depicted molecule-like, excitation wavelength independent emission spectra, while those obtained at higher temperatures showed dual emission and excitation wavelength dependent behavior.48 The respective excitation wavelength independent and dependent PL behaviors of the presently investigated carbon dots, LD1 and LD2, prepared at low and high temperatures, can be broadly reconciled with both of these previous explanations. However, in this study we note that, although in resemblance to molecular chromophores, the nature of the emission spectra of LD1 remains very similar at all excitation wavelengths; the PL decay traces recorded over its entire emission spectral range are not at all similar (Fig. 5A).
The decay traces are not only multiexponential in nature (a fact reported previously for other carbon dots),17,28,51,52 but also change considerably with increasing emission wavelengths in a unique manner, gradually becoming slower for the blue edge of the PL spectra and subsequently becoming faster for the red edge of the PL spectra (cf.Fig. 5A and Table S2, ESI†). A qualitatively similar behavior is also seen for LD2 (Fig. 5B and Table S2, ESI†), though in this case, the effect at the blue edge is less prominent but quite strong at the red edge of the spectra. These results apparently indicate that the PL of both LD1 and LD2 is composed of emissions from multiple states, where each of these states has its own characteristic radiative and nonradiative decay rates.
The observation of wavelength dependent PL decay traces for both LD1 and LD2 prompted us to construct the time-resolved area normalised emission spectra (TRANES), which is known to be useful to reveal the existence of multiple emissive species in any system.53 The occurrence of N number of isoemissive points in the TRANES generally indicates the presence of (N + 1) emissive species, provided the decay time constants and emission spectra of the components are significantly different from each other.45 The TRANES of LD2 shows a clear isoemissive point (cf.Fig. 5B, inset), suggesting that the PL of LD2 is definitely composed of at least two emissive species. An isoemissive-like feature is also indicated in the TRANES of LD1 (inset of Fig. 5A), in accordance with the occurrence of different decay traces, suggesting the possible presence of multiple emissive species. However, in this case, the isoemissive point is not as sharply defined as LD2. It is thus inferred that like LD2, the PL of LD1 is also composed of multiple emissions, but in the latter case, the emissions are not well distinguished because of the close overlap of their spectral positions (also discussed later).
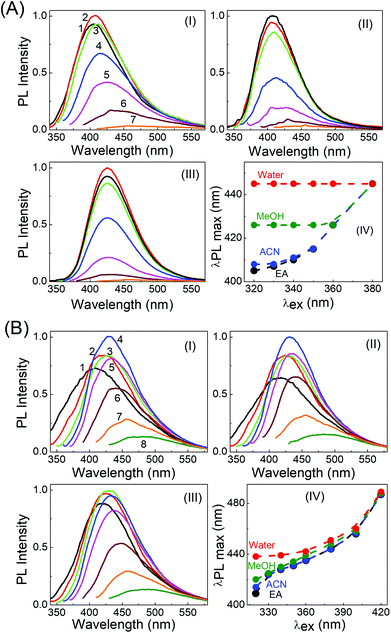
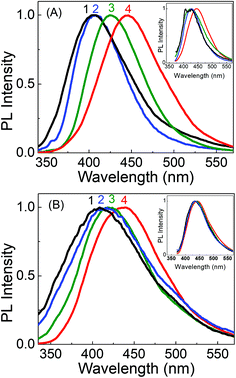
Very interesting and unique features of LD1 and LD2 are further revealed upon examining their optical properties in organic solvents of varying polarities. Although the effect of the solvent medium on the absorption spectra of the carbon dots is not that significant (Fig. S4, ESI†), the solvent dependent changes in their PL spectra are quite striking (Fig. 6). Most remarkably, it is seen that the emission spectrum of LD1, which is apparently independent of the excitation wavelength in aqueous medium, becomes quite dependent on the excitation wavelength in organic solvents (cf.Fig. 6A). The effect is found to be most pronounced in the lower polarity solvent, ethyl acetate (EA, ε = 6.08),54 followed by the higher polarity solvent, acetonitrile (ACN, ε = 36.6),54 and is nearly obliterated in protic methanol solvent (MeOH, ε = 33),54 although the dielectric constant (ε) of MeOH is quite close to that of ACN. Therefore, it is apparent that not only a lower polarity of the solvent medium, but also the absence of specific solute–solvent H-bonding interactions is important for observing the unique solvent-dependent switching of the PL of LD1 from excitation wavelength independent to excitation wavelength dependent behavior. For LD2, the excitation wavelength dependent property of the PL is retained in all the studied solvents; however, like LD1, the overall shift in the emission maximum, with excitation wavelength, appears to be greater in the relatively less polar and/or aprotic solvents, EA and ACN (emission maximum shifts from 410 nm to 487 nm by changing the excitation from 320 nm to 420 nm in EA; cf. Fig. 6B, IV), as compared to the protic and more polar solvents, MeOH and water (emission maximum shifts from 438 nm to 489 nm by changing the excitation from 320 nm to 420 nm in water; cf. Fig. 6B, IV). The quantum yield values of the carbon dots are, however, not very different among the studied solvent systems (Table S3, ESI†).
It is interesting to mention at this point that one of the arguments that has been put forth to explain the excitation wavelength dependent PL of carbon dots is the “giant red-edge excitation effect”, attributed to the unusually slow relaxation of polar solvents around the photoexcited carbon dots.51,55 The present results certainly help us to negate this interpretation because contrary to previous notions, the PL of LD1 is found to display excitation wavelength dependence not in polar solvents but rather in relatively less polar aprotic solvents. For LD2 as well, the extent of the excitation wavelength dependent redshift in the PL is higher in less polar solvents as compared to that in more polar protic solvents.
By tracking the emission peak positions of LD1 and LD2 with respect to excitation wavelengths in different solvent media (panel IV in Fig. 6A and B), it can be realized that the nature of their PL spectra in different solvents, that is, whether the spectra are excitation wavelength dependent or not, is essentially governed by the unique solvatochromic behavior of the PL of the carbon dots. Interestingly, it is observed that for shorter wavelength excitation, the emission maxima of both LD1 and LD2 change quite considerably based on the polarity and proticity of the solvent medium, but for the longest excitation wavelengths, the positions of their emission maxima are not significantly different among the studied solvents (cf. panel IV in Fig. 6A and B). The emission spectra of LD1 and LD2 at two representative excitation wavelengths (320 and 360 nm) in different solvents are shown in Fig. 7 to illustrate this aspect.
The redshift in the PL of LD1 and LD2 with increasing polarity and proticity of the solvent medium, and the corresponding increase in their average PL lifetimes (Fig. S5 and Table S4, ESI†), are generally consistent with previous reports on the solvatochromic behavior of carbon dots.37–41 However, our results additionally reveal that the solvatochromism or the magnitude of the solvent polarity dependent shift in the emission spectra of the carbon dots is not uniform for all the excitation wavelengths (cf. panel IV in Fig. 6A and B). It is evident that this feature of the non-uniform excitation wavelength dependent solvatochromism eventually leads to the increase in the extent of the excitation wavelength dependent redshift in the PL of both the carbon dots, on changing the solvent medium from the highly polar solvent, water, to the relatively less polar organic solvents. In fact, in the case of LD1, this effect is so significant (cf. panel IV in Fig. 6A) that it produces the unique result regarding the change in its PL behaviour, from being excitation wavelength independent in aqueous medium, to being strongly excitation wavelength dependent in the less polar organic solvent medium.
To comprehend the interesting excitation wavelength dependent polarity sensing for the PL of the present carbon dots, we first evaluate the photophysics of LD2, for which our results clearly indicate that its longer wavelength excitation/emission bands arise largely from the low energy surface states, whereas the shorter wavelength excitation/emission bands originate mainly from the molecular states (cf.Fig. 4B and D). Since the polarity dependent redshift of the LD2 emission band is higher for shorter wavelength excitation than for longer wavelength excitation (cf.Fig. 7), it is implied that the molecular state transitions of LD2 (corresponding to the short wavelength excitation/emission) are more polarity sensitive than the surface state transitions (long wavelength excitation/emission).
As discussed before, the molecular states of carbon dots arise due to the combined effect of the various possible chromophoric moieties and/or quasi-molecular structures, and involve n–π* type excitation along with some π–π* type charge transfer transitions.24,26 These transitions are capable of creating higher dipole moments in the excited state compared to the ground state. Therefore, as generally observed in the cases of pure molecular fluorophores, the excitation of the molecular states of carbon dots is also considered to be accompanied by a substantial increase in the dipole moment.43 Accordingly, taking into account the reasonably polar nature of these excited state energy levels and invoking the same principles that are commonly applied to molecular fluorescence, the significant solvent polarity induced redshift in the emission transitions of LD2 for short wavelength excitation can be readily attributed to the increasing stabilisation and lowering of the energy level of the excited molecular states with gradually increasing polarity and H-bonding ability of the surrounding solvent medium.43
The longer wavelength surface state transitions, on the other hand, are possibly not accompanied by a significant increase in the dipole moment. Consequently, the excited surface state energy levels do not experience any large stabilization by polar solvents. A small stabilization of the surface-state energy levels and the diminished solvatochromic effect may rather be ascribed mainly to favourable H-bonding interactions of the surface functional groups with the surrounding solvent medium.
Based on the above concepts, it becomes easy to interpret the excitation wavelength dependent PL behavior of carbon dots in the context of their electronic energy levels and their relative stabilizations in solvents of different polarities. For LD2, it may be expected that in the relatively less polar solvents, the molecular states will be higher in energy and widely separated from the lower energy surface state levels. The existence of multiple well-separated energy levels of LD2 in solvents of lower polarity quite understandably allows selective excitation and emission involving different energy levels, and accordingly, produces a considerable excitation wavelength dependent PL behavior (cf.Fig. 6B). In aqueous solutions, on the other hand, due to the large stabilization of the polar molecular state levels, they are expected to be lowered in energy and thus no longer widely apart from the surface states. The lowering of the molecular state energy levels and subsequent close spacing with the surface states, result in the multiple emissive states being no longer separately distinguishable, and consequently, the magnitude of the excitation wavelength dependent shift of the PL spectra is substantially reduced.
In the case of LD1, the presence of multiple emissive states and especially participation of the surface states is not explicitly indicated from the absorption/emission spectra in aqueous medium. However, the observation of wavelength dependent multiexponential PL decays (cf.Fig. 5) strongly suggests that like LD2, the PL of LD1 is also actually composed of emissions from multiple optical states. Possibly in LD1, due to the lower degree of carbonization, molecular species are more predominant over the carbogenic species and accordingly, the PL contributions from molecular fluorophores override the contribution from the surface states.48 Furthermore, it is also likely that due to the larger size of the LD1 particles, the surface state contributions of this carbon dot are less than that for LD2, as experimentally observed (cf.Fig. 3 and 4). Nevertheless, the change in the PL behaviour of LD1 from being excitation wavelength independent in aqueous medium to being excitation wavelength dependent in the less polar and aprotic solvents clearly reveals that the general nature of the emissive states and the photophysics is qualitatively quite similar in both LD1 and LD2. In fact, a comparison of the photophysics of LD1 and LD2 helps us to realize that the excitation wavelength independent or dependent PL of the carbon dots is essentially a manifestation of either the suppression or the unmasking of the multiple emissive states, depending on the solvent environments.
Like LD2, in LD1 as well, the significantly polar excited molecular states are expected to be stabilized in polar solvents. It is proposed that in the polar and protic aqueous medium (and also in MeOH), the stabilization of the molecular states, which is indicated to be more predominant in LD1, occurs to a large extent, so that they are energetically merged with the surface states. The overlapping PL from the molecular states thus effectively masks the PL arising due to the surface state transitions in LD1, and this leads to the appearance of relatively narrow and excitation wavelength independent PL spectra (cf.Fig. 4A and D) in these solvent media. In the less polar aprotic media, the molecular states of LD1 lose much of their solvent polarity induced stabilization. Consequently, they are raised in energy and get separated from the surface states. The restructuring and wider separation between the electronic energy levels of LD1 in nonpolar solvents allow selective excitation/emission, and eventually convert the nature of the PL in LD1, so that it becomes excitation wavelength dependent in the nonpolar solvent media. The existence of well-separated and discrete emissive states of LD1 in the relatively less polar medium is indeed substantiated by the observation of a significant excitation tail in EA medium, when the excitation spectrum is monitored for higher wavelength emission (Fig. S6, ESI†). Additionally, the TRANES of LD1 in EA medium shows a clear isoemissive point, although this feature is not sharply defined in aqueous medium (cf.Fig. 5 and Fig. S7, ESI†). Overall, the observed solvent polarity induced modulations in the excitation wavelength dependent PL features of LD1 and LD2 help us to differentiate the molecular and surface state emissions of the carbon dots, which is a widely open topic of discussion in the literature, in regard to the PL of these materials. It is inferred from the present study that the different proportions of molecular and surface states formed in carbon dots (depending on their synthesis conditions) and the largely different extents of stabilizations of these states (depending on the polarity and proticity of the solvent medium) are the reasons behind the differential extent of wavelength dependent shifts in the PL spectra observed for different carbon dot materials.
The proposed PL model for LD1 and LD2, as understood from the present study, is depicted in Scheme 1, through the use of simplified Jablonski diagrams. This scheme conceptually explains the overall energy level structures of the two carbon dots and the modulations in their PL properties, due to changes in the excited state energy levels, induced by the surrounding solvent environment. Importantly, it is highlighted that although the contributions of molecular and surface states as well as the stabilizations of these energy levels in the carbon dots may vary depending on the preparation methods and the solvent media, their basic photophysics essentially remains quite similar.
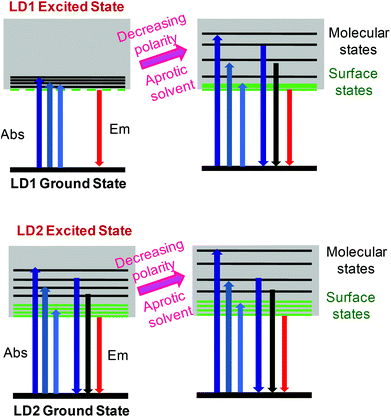 | ||
| Scheme 1 Conceptual energy level diagrams and electronic transitions of LD1 and LD2 under different solvent conditions. | ||
Conclusions
To summarize, the analysis of the optical properties of LD1 and LD2 provides valuable information for elucidating the PL mechanism of carbon dots under different solvent conditions. It is resolved from our studies that excitation wavelength dependent PL in carbon dots does not arise due to slow solvation dynamics in polar solvents, but can rather be attributed to the presence of several different optical centres in these luminophores, which have different sensitivities to the surrounding solvent media. Our results suggest that the solvent environment can modify the energy level structures and the relative ordering of molecular and surface states in individual carbon dots, and thus influence the ultimate PL output. It is understood that the solvent induced fine tuning in the energy level structures eventually governs the excitation wavelength dependent or independent PL response of the presently studied carbon dots, LD1 and LD2. The present results help us to differentiate the PL arising from the molecular state and the surface state of the carbon dot materials, which is a debatable and open topic in the literature on carbon dot PL. Differential contributions of molecular and surface state emissions, which are modulated by the proticity and polarity of the solvent medium, actually lead to the apparent variability in the observed optical properties of different carbon dot systems, although their overall photophysics remains qualitatively very similar. This comprehensive understanding clarifies various unusual PL behaviors of carbon dot systems and would expectedly help in promoting the applications of these materials as effective optical probes and luminescent labels.Conflicts of interest
There are no conflicts to declare.Acknowledgements
The authors gratefully acknowledge the generous support provided by the host institution, Bhabha Atomic Research Centre (BARC), Mumbai. We thank Dr R. K. Vatsa and Smt. K. G. Girija, Chemistry Division, BARC, for the assistance with the AFM measurements and K. K. Singh, Radiation & Photochemistry Division, BARC for FTIR measurements. J. M. Chethodil thanks BARC for providing him with all facilities during his B. Tech. project. P. M. Gharat acknowledges the BARC-Mumbai University joint research initiative for his research fellowship.Notes and references
- O. Kozák, M. Sudolská, G. Pramanik, P. Cígler, M. Otyepka and R. Zbořil, Photoluminescent Carbon Nanostructures, Chem. Mater., 2016, 28, 4085–4128 CrossRef.
- A. Demchenko and M. Dekaliuk, Novel Fluorescent Carbonic Nanomaterials for Sensing and Imaging, Methods Appl. Fluoresc., 2013, 1, 042001 CrossRef PubMed.
- J. Shen, Y. Zhu, X. Yang and C. Li, Graphene Quantum Dots: Emergent Nanolights for Bioimaging, Sensors, Catalysis and Photovoltaic Devices, Chem. Commun., 2012, 48, 3686–3699 RSC.
- F. Yuan, S. Li, Z. Fan, X. Meng, L. Fan and S. Yang, Shining Carbon Dots: Synthesis and Biomedical and Optoelectronic applications, Nano Today, 2016, 11, 565–586 CrossRef CAS.
- S. N. Baker and G. A. Baker, Luminescent Carbon Nanodots: Emergent Nanolights, Angew. Chem., Int. Ed., 2010, 49, 6726–6744 CrossRef CAS PubMed.
- S. Zhu, Q. Meng, L. Wang, J. Zhang, Y. Song, H. Jin, K. Zhang, H. Sun, H. Wang and B. Yang, Highly Photoluminescent Carbon Dots for Multicolor Patterning, Sensors, and Bioimaging, Angew. Chem., Int. Ed., 2013, 52, 3953–3957 CrossRef CAS PubMed.
- S. Y. Lim, W. Shen and Z. Gao, Carbon Quantum Dots and their Applications, Chem. Soc. Rev., 2015, 44, 362–381 RSC.
- V. Singh and A. K. Mishra, White Light Emission from a Mixture of Pomegranate Extract and Carbon Nanoparticles Obtained from the Extract, Mater. Chem. C, 2016, 4, 3131–3137 RSC.
- O. S. Wolfbeis, An Overview of Nanoparticles Commonly Used in Fluorescent Bioimaging, Chem. Soc. Rev., 2015, 44, 4743–4768 RSC.
- S. Zhu, Y. Song, X. Zhao, J. Shao, J. Zhang and B. Yang, The Photoluminescence Mechanism in Carbon Dots (Graphene Quantum Dots, Carbon Nanodots, and Polymer Dots): Current State and Future Perspective, Nano Res., 2015, 8, 355–381 CrossRef CAS.
- S. Zhu, X. Zhao, Y. Song, S. Lu and B. Yang, Beyond Bottom-up Carbon Nanodots: Citric-acid Derived Organic Molecules, Nano Today, 2016, 11, 128–132 CrossRef CAS.
- J. Schneider, C. J. Reckmeier, Y. Xiong, M. Seckendorff, A. S. Susha, P. Kasák and A. L. Rogach, Molecular Fluorescence in Citric Acid-Based Carbon Dots, J. Phys. Chem. C, 2017, 121, 2014–2022 CrossRef CAS.
- L. Shi, J. H. Yang, H. B. Zeng, Y. M. Chen, S. C. Yang, C. Wu, H. Zeng, O. Yoshihito and Q. Zhang, Carbon Dots with High Fluorescence Quantum Yield: The Fluorescence Originates from Organic Fluorophores, Nanoscale, 2016, 8, 14374–14378 RSC.
- J. B. Essner, J. A. Kist, L. Polo-Parada and G. A. Baker, Artifacts and Errors Associated with the Ubiquitous Presence of Fluorescent Impurities in Carbon Nanodots, Chem. Mater., 2018, 30, 1878–1887 CrossRef CAS.
- S. Khan, A. Sharma, A. Ghoshal, S. Jain, M. K. Hazra and C. K. Nandi, Small Molecular Organic Nanocrystals Resemble Carbon Nanodots in Terms of their Properties, Chem. Sci., 2018, 9, 175–180 RSC.
- M. Righetto, A. Privitera, I. Fortunati, D. Mosconi, M. Zerbetto, M. L. Curri, M. Corricelli, A. Moretto, S. Agnoli, L. Franco, R. Bozio and C. Ferrante, Spectroscopic Insights into Carbon Dot Systems, J. Phys. Chem. Lett., 2017, 8, 2236–2242 CrossRef CAS PubMed.
- V. Strauss, J. T. Margraf, C. Dolle, B. Butz, T. J. Nacken, J. Walter, W. Bauer, W. Peukert, E. Spiecker, T. Clark and D. M. Guldi, Carbon Nanodots: Toward a Comprehensive Understanding of Their Photoluminescence, J. Am. Chem. Soc., 2014, 136, 17308–17316 CrossRef CAS PubMed.
- A. P. Demchenko and M. O. Dekaliuk, The Origin of Emissive States of Carbon Nanoparticles Derived from Ensemble-averaged and Single-molecular Studies, Nanoscale, 2016, 8, 14057–14069 RSC.
- Z. C. Su, H. G. Ye, Z. Xiong, Q. Lou, Z. Zhang, F. Tang, J. Y. Tang, J. Y. Dai, C. X. Shan and S. J. Xu, Understanding and Manipulating Luminescence in Carbon Nanodots, Carbon, 2018, 126, 58–64 CrossRef CAS.
- K. Bera, A. Sau, P. Mondal, R. Mukherjee, D. Mookherjee, A. Metya, A. K. Kundu, D. Mandal, B. Satpati, O. Chakrabarti and S. Basu, Metamorphosis of Ruthenium-Doped Carbon Dots: In Search of the Origin of Photoluminescence and Beyond, Chem. Mater., 2016, 28, 7404–7413 CrossRef CAS.
- S. Mondal, M. Chatti, A. Mallick and P. Purkayastha, pH Triggered Reversible Photoinduced Electron Transfer to and from Carbon Nanoparticles, Chem. Commun., 2014, 50, 6890–6893 RSC.
- Q. Fang, Y. Dong, Y. Chen, C. Lu, Y. Chi, H. Yang and T. Yu, Luminescence Origin of Carbon Based Dots Obtained from citric Acid and Amino Group Containing Molecules, Carbon, 2017, 118, 319–326 CrossRef CAS.
- M. Jang, S. H. Song, H. D. Ha, T. S. Seo, S. Jeon and Y. Cho, Origin of Extraordinary Luminescence Shift in Graphene Quantum Dots with Varying Excitation Energy: An Experimental Evidence of Localized sp2 Carbon Subdomain, Carbon, 2017, 118, 524–530 CrossRef CAS.
- C. J. Reckmeier, Y. Wang, R. Zboril and A. L. Rogach, Influence of Doping and Temperature on Solvatochromic Shifts in Optical Spectra of Carbon Dots, J. Phys. Chem. C, 2016, 120, 10591–10604 CrossRef CAS.
- S. Zhu, Y. Song, J. Wang, H. Wan, Y. Zhang, Y. Ning and B. Yang, Photoluminescence Mechanism in Graphene Quantum Dots: Quantum Confinement Effect and Surface/Edge State, Nano Today, 2017, 13, 10–14 CrossRef CAS.
- Y. Wang, S. Kalytchuk, Y. Zhang, H. Shi, S. V. Kershaw and A. L. Rogach, Thickness-Dependent Full-Color Emission Tunability in a Flexible Carbon Dot Ionogel, J. Phys. Chem. Lett., 2014, 5, 1412–1420 CrossRef CAS PubMed.
- Z. Gan, H. Xu and Y. Hao, Mechanism for Excitation-Dependent Photoluminescence from Graphene Quantum Dots and Other Graphene Oxide Derivates: Consensus, Debates and challenges, Nanoscale, 2016, 8, 7794–7807 RSC.
- A. Sharma, T. Gadly, A. Gupta, A. Ballal, S. K. Ghosh and M. Kumbhakar, Origin of Excitation Dependent Fluorescence in Carbon Nanodots, J. Phys. Chem. Lett., 2016, 6, 3695–3702 CrossRef PubMed.
- Y. Dong, H. Pang, H. B. Yang, C. Guo, J. Shao, Y. Chi, C. M. Li and T. Yu, Carbon-Based Dots Co-doped with Nitrogen and Sulfur for High Quantum Yield and Excitation-Independent Emission, Angew. Chem., Int. Ed., 2013, 52, 7800–7804 CrossRef CAS PubMed.
- C. Galande, A. D. Mohite, A. V. Naumov, W. Gao, L. Ci, A. Ajayan, H. Gao, A. Srivastava, R. B. Weisman and P. M. Ajayan, Quasi-Molecular Fluorescence from Graphene Oxide, Sci. Rep., 2011, 1, 1–5 CrossRef PubMed.
- J. Shang, L. Ma, J. Li, W. Ai, T. Yu and G. G. Gurzadyan, The Origin of Fluorescence from Graphene Oxide, Sci. Rep., 2012, 2, 1–8 Search PubMed.
- Y. Song, S. Zhu, S. Zhang, Y. Fu, L. Wang, X. Zhao and B. Yang, Investigation from Chemical Structure to Photoluminescent Mechanism: A Type of Carbon Dots from the Pyrolysis of Citric Acid and an Amine, J. Mater. Chem. C, 2015, 3, 5976–5984 RSC.
- A. Sharma, T. Gadly, S. Neogy, S. K. Ghosh and M. Kumbhakar, Addition to “Molecular Origin and Self-Assembly of Fluorescent Carbon Nanodots in Polar Solvents”, J. Phys. Chem. Lett., 2017, 8, 5861–5864 CrossRef CAS PubMed.
- M. Sudolská, M. Dubecký, S. Sarkar, C. J. Reckmeier, R. Zbořil, A. L. Rogach and M. Otyepka, Nature of Absorption Bands in Oxygen-Functionalized Graphitic Carbon Dots, J. Phys. Chem. C, 2015, 119, 13369–13373 CrossRef.
- A. Sharma, T. Gadly, S. Neogy, S. K. Ghosh and M. Kumbhakar, Molecular Origin and Self-Assembly of Fluorescent Carbon Nanodots in Polar Solvents, J. Phys. Chem. Lett., 2017, 8, 1044–1052 CrossRef CAS PubMed.
- S. Dutta Choudhury, J. M. Chethodil, P. M. Gharat, P. K. Praseetha and H. Pal, pH-Elicited Luminescence Functionalities of Carbon Dots: Mechanistic Insights, J. Phys. Chem. Lett., 2017, 8, 1389–1395 CrossRef CAS PubMed.
- A. Sciortino, E. Marino, B. van Dam, P. Schall, M. Cannas and F. Messina, Solvatochromism Unravels the Emission Mechanism of Carbon Nanodots, J. Phys. Chem. Lett., 2016, 7, 3419–3423 CrossRef CAS PubMed.
- S. Mukherjee, E. Prasad and A. Chadha, H-Bonding controls the emission properties of functionalized carbon nano-dots, Phys. Chem. Chem. Phys., 2017, 19, 7288–7296 RSC.
- O. Kozák, K. K. R. Datta, M. Greplová, V. Ranc, J. Kašlík and R. Zbořil, Surfactant-Derived Amphiphilic Carbon Dots with Tunable Photoluminescence, J. Phys. Chem. C, 2013, 117, 24991–24996 CrossRef.
- H. Wang, C. Sun, X. Chen, Y. Zhang, V. L. Colvin, Q. Rice, J. Seo, S. Feng, S. Wang and W. W. Yu, Excitation Wavelength Independent Visible Color Emission of Carbon Dots, Nanoscale, 2017, 9, 1909–1915 RSC.
- T. Zhang, J. Zhu, Y. Zhai, H. Wang, X. Bai, B. Dong, H. Wang and H. Song, A Novel Mechanism for Red Emission Carbon Dots: Hydrogen Bond Dominated Molecular States Emission, Nanoscale, 2017, 9, 13042–13051 RSC.
- F. Gao, S. Ma, J. Li, K. Dai, X. Xiao, D. Zhao and W. Gong, Rational Design of High Quality Citric Acid-Derived Carbon Dots by Selecting Efficient Chemical Structure Motifs, Carbon, 2017, 112, 131–141 CrossRef CAS.
- J. R. Lakowicz, Principles of Fluorescence Spectroscopy, Springer, New York, 2006 Search PubMed.
- M. Maroncelli and G. R. Fleming, Picosecond Solvation Dynamics of Coumarin 153: The Importance of Molecular Aspects of Solvation, J. Chem. Phys., 1987, 86, 6221–6239 CrossRef CAS.
- A. S. R. Koti and N. Periasamy, Application of Time Resolved Area Normalized Emission Spectroscopy to Multicomponent Systems, J. Chem. Phys., 2001, 115, 7094–7099 CrossRef CAS.
- S. Dutta Choudhury, P. Vir, J. Mohanty, A. C. Bhasikuttan and H. Pal, RSC Adv., 2016, 6, 6111–6124 RSC.
- S. Dutta Choudhury and H. Pal, Intriguing Tautomerism of Lumichrome in Binary Aqueous Solvent Mixtures: Implications for Probing Microenvironments, J. Phys. Chem. B, 2016, 120, 11970–11977 CrossRef CAS PubMed.
- M. J. Krysmann, A. Kelarakis, P. Dallas and E. P. Giannelis, Formation Mechanism of Carbogenic Nanoparticles with Dual Photoluminescence Emission, J. Am. Chem. Soc., 2012, 134, 747–750 CrossRef CAS PubMed.
- B. Konkena and S. Vasudevan, Understanding Aqueous Dispersability of Graphene Oxide and Reduced Graphene Oxide through pKa Measurements, J. Phys. Chem. Lett., 2012, 3, 867–872 CrossRef CAS PubMed.
- X. Li, S. Zhang, S. A. Kulinich, Y. Liu and H. Zeng, Engineering Surface States of Carbon Dots to Achieve Controllable Luminescence for Solid-luminescent Composites and Sensitive Be2+Detection, Sci. Rep., 2014, 4, 1–8 CAS.
- S. Khan, A. Gupta, N. C. Verma and C. K. Nandi, Time-Resolved Emission Reveals Ensemble of Emissive States as the Origin of Multicolor Fluorescence in Carbon Dots, Nano Lett., 2015, 15, 8300–8305 CrossRef CAS PubMed.
- N. Dhenadhayalan, K.-C. Lin, R. Suresh and P. Ramamurthy, Unravelling the Multiple Emissive States in Citric-Acid-Derived Carbon Dots, J. Phys. Chem. C, 2015, 120, 1252–1261 CrossRef.
- A. S. R. Koti, M. M. G. Krishna and N. Periasamy, Time-Resolved Area-Normalized Emission Spectroscopy (TRANES): A Novel Method for Confirming Emission from Two Excited States, J. Phys. Chem. A, 2001, 105, 1767–1771 CrossRef CAS.
- J. A. Dean, Lange's handbook of Chemistry, 13th edn., McGraw-Hill, New York, 1987 Search PubMed.
- S. K. Cushing, M. Li, F. Huang and N. Wu, Origin of Strong Excitation Wavelength Dependent Fluorescence of Graphene Oxide, ACS Nano, 2014, 8, 1002–1013 CrossRef CAS PubMed.
Footnote |
| † Electronic supplementary information (ESI) available: Note S1, Fig. S1–S7 and Tables S1–S4. See DOI: 10.1039/c8pp00373d |
| This journal is © The Royal Society of Chemistry and Owner Societies 2019 |

