Metal–organic framework derived hierarchical Ni/Ni3S2 decorated carbon nanofibers for high-performance supercapacitors†
Di
Tian
,
Sihui
Chen
,
Wendong
Zhu
,
Ce
Wang
 * and
Xiaofeng
Lu
 *
*
Alan G. MacDiarmid Institute, College of Chemistry, Jilin University, Changchun, 130012, P. R. China. E-mail: cwang@jlu.edu.cn; xflu@jlu.edu.cn; Fax: +86-431-85168292; Tel: +86-431-85168292
First published on 11th June 2019
Abstract
Metal–organic frameworks (MOFs) and their derivatives have emerged as promising electrode materials in the energy conversion and storage field in the past few years. Herein, hierarchical Ni/Ni3S2 decorated carbon nanofibers (CNFs) have been fabricated based on the template growth of MOFs on pre-oxidized electrospun polyacrylonitrile (PAN) nanofibers followed by carbonization and sulfurization processes. The formation of Ni and CNFs provides high conductivity, while the hierarchical structure contributes to a large number of exposed redox active sites. Thus the optimized hierarchical Ni/Ni3S2/CNFs achieve a high electrochemical performance as supercapacitor electrodes, exhibiting a specific capacitance of 830.0 F g−1 at 0.2 A g−1 and ideal rate capabilities. In addition, the assembled solid-state supercapacitor delivers a high energy density of 31.6 W h kg−1 at a power density of 1800 W kg−1 and a good capacitance retention of 95.7% after 5000 charge–discharge cycles. This strategy provides a basis for the efficient construction of MOF-derived electrode materials for their application in energy storage systems.
Introduction
The growing demand for clean and sustainable energy sources has promoted the development of supercapacitors because of their advantages of high power energy, fast recharge ability, long cycling life, and excellent safety.1–5 As a vital contributor, a large variety of electrode materials have been prepared to satisfy the requirements of high-performance supercapacitors including large specific capacitance, superior rate capability, excellent stability and huge energy densities. The commonly used single component electrode materials including carbon materials, transition metal oxides and conductive polymers exhibit some advantages in certain aspects, but usually suffer from their respective intrinsic shortcomings. Therefore, designing new types of functional hybrid materials with multiple components and a unique hierarchical structure is necessary to achieve an improved electrochemical performance.From a chemical point of view, the lower electronegativity of sulfur than oxygen leads to a more stable structure and faster electron transport in metal sulfides than oxides.6,7 Among a large number of metal sulfides, Ni3S2, as a rich and cheap mineral in nature, displays rich valences, large theoretical capacity, and good electrochemical performance, which has been regarded as a remarkable electrode material for energy storage.8–11 Additionally, in order to further improve the inferior conductivity and enlarge the Faraday active areas of Ni3S2 materials, they are usually decorated on highly conductive substrates such as graphenes, carbon nanotubes and carbon nanofibers. There are two common synthetic routes. One is to directly grow Ni3S2 on the substrates. For example, a Ni3S2 nanoparticles/carbon nanotube hybrid is prepared through a glucose-assisted hydrothermal approach, displaying a high specific capacitance of 800 F g−1 at 3.2 A g−1 and great cycling stability.13 The other is to prepare Ni3S2 composites using Ni, NiO, Ni(OH)2, etc. as precursors. Li and co-workers have synthesized grass-like Ni3S2 nanorod/nanowire arrays grown on a Ni foam network, providing a large interfacial area and effective pathway for charge transport, which showed a specific area capacitance of 4.52 F cm−2 at 1.25 mA cm−2 as supercapacitor electrodes.12 Compared with the former, the latter is more conducive to the synergy of multi-component or hierarchical structures.
Recently, metal–organic frameworks (MOFs) have been demonstrated as efficient electrode materials for supercapacitors owing to their porous architecture, diverse composition and redox reactivity.14–17 According to their unique characteristics, some typical MOFs have been directly used as parts or all of electrode materials to provide a large specific surface area and abundant pseudocapacitive sites.18–21 Furthermore, for the purpose of achieving better conductivity, enhanced structural stability, and specific compositional transformation, a large number of MOF derived electrode materials including carbon materials, oxides and sulfides have aroused increasing attention recently.22–27 In our previous work, MOF derived Ni doped carbon nanofibers were prepared, which have been used as supercapacitor electrodes to achieve a specific capacitance of 300.0 F g−1 at a current density of 0.5 A g−1 and good rate capacity. However, the limitation of the active Faraday reactions of the single component, Ni, hindered their capacitance performance.28 Therefore, it is desirable to convert Ni to Ni3S2 with carbon substrates, thus the electrode materials can possess good conductivity, high surface area and excellent redox activity.
In this study, we have demonstrated a novel strategy to fabricate MOF derived hierarchical Ni/Ni3S2 decorated CNFs as supercapacitor electrodes through a template growth method followed by carbonization and sulfurization processes. Because of the unique hierarchical structure of Ni/Ni3S2 and highly conductive CNFs, the prepared Ni/Ni3S2/CNFs show a large redox active area and efficient electron transfer path, guaranteeing their excellent performance in terms of specific capacitance, rate capacity, and cycling stability. As a result, the largest specific capacitance of 830.0 F g−1 can be achieved at a current density of 0.2 A g−1 with a good rate capacitance retention of 42.4% as the current density increased to 5 A g−1. In addition, an asymmetric supercapacitor is assembled by using Ni/Ni3S2/CNFs as the anode material and active carbon as the cathode material, which extend the potential window to 1.8 V via the usage of a solid electrolyte, leading to a high energy density of 31.6 W h kg−1 at a power density of 1800 W kg−1. Furthermore, the supercapacitor shows a capacitance retention of 93.5% and high Coulombic efficiency after 5000 cycles. The high-performance of the supercapacitor reveals its great potential for practical applications in energy storage and conversion devices.
Experimental
All chemical reagents consisting of polyacrylonitrile (PAN, Mw = 80![[thin space (1/6-em)]](https://www.rsc.org/images/entities/char_2009.gif) 000, Jilin Chemical Plant.), N,N-dimethylformamide (DMF, Beijing Chemical Works), terephthalic acid (H2BDC, AR, Aladdin Industrial Corporation), nickel nitrate hexahydrate (Ni(NO3)2·6H2O, AR, Tianjin Tiantai Fine Chemicals Co., Ltd), thioacetamide (AR, Sinopharm Chemical Reagent Co., Ltd), ethanol (EtOH, Beijing Chemical Works), polytetrafluoroethylene (PTFE, Aladdin), potassium hydroxide (KOH, Beijing Chemical Works), and polyvinyl alcohol (PVA, Mw ≈ 77
000, Jilin Chemical Plant.), N,N-dimethylformamide (DMF, Beijing Chemical Works), terephthalic acid (H2BDC, AR, Aladdin Industrial Corporation), nickel nitrate hexahydrate (Ni(NO3)2·6H2O, AR, Tianjin Tiantai Fine Chemicals Co., Ltd), thioacetamide (AR, Sinopharm Chemical Reagent Co., Ltd), ethanol (EtOH, Beijing Chemical Works), polytetrafluoroethylene (PTFE, Aladdin), potassium hydroxide (KOH, Beijing Chemical Works), and polyvinyl alcohol (PVA, Mw ≈ 77![[thin space (1/6-em)]](https://www.rsc.org/images/entities/char_2009.gif) 000, Beijing Yili Fine Chemical Co., Ltd) were used as received without further purification. The water used in the experiment refers to ultrapure water.
000, Beijing Yili Fine Chemical Co., Ltd) were used as received without further purification. The water used in the experiment refers to ultrapure water.
Synthesis of MOF derived Ni/CNFs
The fabrication of MOF derived Ni/CNFs was similar to that in our previous report.28 In brief, Ni(NO3)2·6H2O (1.164 g) and H2BDC (0.168 g) were completely dissolved in DMF (25 mL) to form a transparent greenish solution. Then pre-oxidized polyacrylonitrile nanofibers (PPNFs, 10 mg) prepared by an electrospinning and calcination process at 240 °C were immersed in the above solution for 20 h and transferred into a Teflon-lined stainless-steel autoclave (50 mL) at 120 °C for 16 h. After washing with water and ethanol and drying, the obtained PPNF@MOF was carbonized at a high temperature in an Ar atmosphere to produce Ni/CNFs. The samples fabricated at carbonization temperatures of 500, 700 and 900 °C were designated as Ni/CNFs-500, Ni/CNFs-700 and Ni/CNFs-900, respectively.Preparation of hierarchical Ni/Ni3S2/CNFs
In a typical hydrothermal procedure, 40 mg of thioacetamide was added into 40 mL of ethanol. After magnetic stirring for 15 min, 18 mg of Ni/CNFs was dispersed in the solution and kept in an autoclave at 120 °C for 4 h. Finally, hierarchical Ni/Ni3S2/CNFs were collected by centrifugation, rinsed with ethanol several times, and dried at 50 °C for 12 h. The samples derived from Ni/CNFs-500, Ni/CNFs-700 and Ni/CNFs-900 were named Ni/Ni3S2/CNFs-500, Ni/Ni3S2/CNFs-700, Ni/Ni3S2/CNFs-900, respectively. In addition, a sample of MOF derived Ni/Ni3S2 was prepared using a similar procedure but without the addition of PPNF during the template growth of the MOF process. A not-MOF derived Ni/NiS2/CNFs sample was also prepared using a similar procedure but without the addition of H2BDC during the template growth of the MOF process.Electrochemical measurements
An electrochemical workstation (CHI660E Shanghai Chenhua instrument Co., Ltd) was employed for the measurements of cyclic voltammetry (CV), galvanostatic charge–discharge (GCD), and electrochemical impedance spectroscopy (EIS). For tests in a three-electrode system, a platinum foil electrode (20 × 20 × 1.5 mm), a Hg/HgO electrode, Ni foam, and 3 M KOH solution were selected for the counter electrode, reference electrode, current collector, and electrolyte, respectively. The manufacture of the working electrode was illustrated in detail. The ground powder samples (8 mg) were fully mixed with acetylene black (1 mg) and PTFE (1 mg). Then, a few drops of ethanol were added into the mixture to form a paste which was smeared on nickel foam. After drying at 50 °C overnight and being pressed, the electrode can be used for testing. Besides, the fabrication process of electrodes in the two-electrode system is analogous to the working electrodes, but nickel foam was replaced by carbon cloth. PVA–KOH as the solid-state electrolyte was prepared as follows. 3.0 g of PVA was absolutely dissolved in water (30 mL) at a temperature of 90 °C. Next, KOH (3.0 g) was slowly added into the transparent solution at room temperature. After stirring for two hours, the Ni/Ni3S2/CNFs and active carbon electrodes were coated with a PVA–KOH gel and dried at room temperature until totally solidified.Characterization
The morphologies of the samples were characterized using a field-emission scanning electron microscope (FESEM, FEI Nova NanoSEM 450) and a transmission electron microscope (TEM, JEOL JEM-1200 EX) operated at 15 and 100 kV, respectively. TEM combined with high resolution TEM (HRTEM), energy dispersive X-ray (EDX) spectroscopy and fast Fourier transform (FFT) versions for the existence of Ni3S2 was carried out on a FEI Tecnai G2 F20 instrument. The crystal structure and chemical composition of the as-prepared samples were confirmed by powder X-ray diffraction (XRD) patterns with Cu Kα radiation and X-ray photoelectron spectroscopy (XPS, Thermo Scientific ESCALAB250) analysis. Raman spectra were measured on a Horiba Lab RAM HR Evolution apparatus at an excitation wavelength of 532 nm.Results and discussion
The synthetic process of MOF derived hierarchical Ni/Ni3S2/CNFs is schematically illustrated in Scheme 1. And the detailed conversion process of the sample can be predicted. First, PPNFs are obtained through an electrospinning and preoxidation process. Second, Ni ions will penetrate and link to the functional groups of PPNF after being mixed with Ni(NO3)2, which can be coordinated with organic ligands H2BDC for the template growth of MOFs on the surface of PPNFs, resulting in a PPNF@MOF sample with a core–shell structure. Third, hierarchical Ni/CNFs were prepared via a carbonization process of the PPNF@MOF samples in argon. Finally, hierarchical Ni/Ni2S3/CNFs were obtained through the sulfurization reaction between Ni/CNFs and thioacetamide. The relevant reactions are shown below.| CH3CSNH2 + 2H2O → H2S + CH3COONH4 |
| 3Ni + 2H2S → Ni3S2 + 2H2 |
 | ||
| Scheme 1 Schematic demonstration of the fabrication process of MOF derived hierarchical Ni/Ni3S2/CNFs. | ||
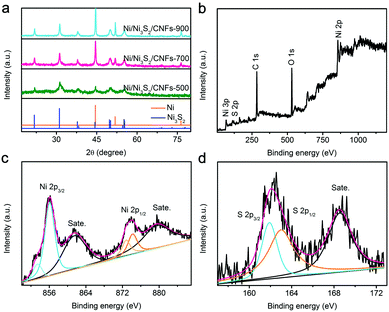
XRD patterns are carried out to explore the crystal phase of the prepared samples. As demonstrated in Fig. S4 (ESI†), after calcination at 700 °C, PPNF@MOF was converted into Ni/CNFs. The typical diffraction peaks (2θ) located at 44.5°, 51.9°, and 76.4° can be ascribed to the (111), (200) and (220) crystal planes of the face-centered-cubic phase of Ni (JCPDS no. 04-0850). Fig. S5 (ESI†) shows the XRD patterns of Ni/CNFs-500 and Ni/CNFs-900, whose peaks are in accordance with that of Ni/CNFs-700. But their intensity increases with increasing calcination temperature, revealing that the crystallization degree of nickel also increases. After sulfurization, some new distinct diffraction peaks (2θ) at 21.8°, 31.1°, 44.3°, and 50.1° can be detected in the XRD patterns of Ni/Ni3S2/CNFs, which are assigned to the (101), (110), (202), and (211) crystal planes of Ni3S2 (JCPDS no. 44-1418), respectively (Fig. 2a). Specifically, all the samples still show the characteristic Ni patterns, which could be owing to incomplete sulfurization of Ni nanoparticles. There are two speculations to explain this phenomenon (Scheme 1). On the one hand, the Ni particles within Ni/CNFs cannot be sulfurized due to the protection of the MOF which resists sulfur ion penetrating into the core material. On the other hand, the sulfurization process only occurs on the surface of some nickel particles, which is related to their higher crystallinity and larger diameters. Furthermore, XRD patterns of the MOF derived Ni/Ni3S2 exhibited similar patterns to those of Ni/Ni3S2/CNFs, while the not-MOF derived Ni/NiS2/CNFs show very weak NiS2 peaks. This result implies that Ni-CNFs derived from MOFs are easier to convert to Ni3S2 than Ni-CNFs derived from not-MOF materials. The Raman spectra and corresponding fitting curves of Ni/Ni3S2/CNFs-700, Ni/Ni3S2/CNFs-500 and PPNF@MOF are presented in Fig. S6 (ESI†). The intensity ratio of the D peak to the G peak (ID/IG) of Ni/Ni3S2/CNFs-700, Ni/Ni3S2/CNFs-500 and PPNF@MOF is calculated to be 1.03, 1.28, and 1.42, respectively. The lower ID/IG reflects the higher graphitization degree of Ni/Ni3S2/CNFs-700 than Ni/Ni3S2/CNFs-500, which is consistent with the results in previous work.28 In addition, compared with the ID/IG of PPNF@MOF, it can be inferred that the graphitization degree of the precursor can be greatly improved via the calcination at 500 °C and 700 °C.
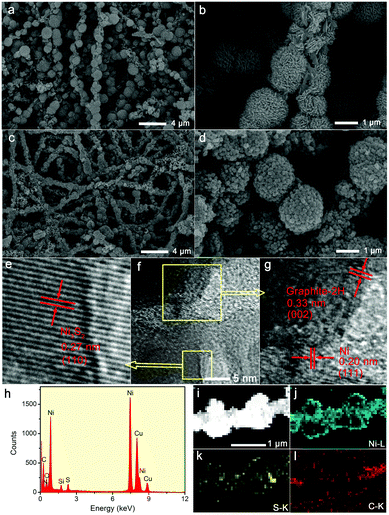
XPS analysis is further implemented to investigate the chemical states of Ni/Ni3S2/CNFs-700. From Fig. 2b, the characteristic peaks in the full survey scan spectrum confirm the existence of C, O, S and Ni elements. The Ni 2p spectrum is fitted into two spin–orbit doublets followed by two shake-up satellites. The peaks with binding energies at 853. 3 eV for Ni 2p3/2 and 872.8 eV for Ni 2p1/2 correspond to the spin–orbit characteristics of Ni2+, and the binding energies centered at 856.1 eV for Ni 2p3/2 and 874.2 eV for Ni 2p1/2 belong to the characteristics of Ni3+.29–31 Two shake-up typical peaks of nickel appear at the high binding energy sides of Ni 2p3/2 and Ni 2p1/2. Fig. 2d displays the high-resolution S 2p spectrum which can be deconvoluted into two main peaks and a satellite. The peaks located at binding energies of 161.9 eV and 163.0 eV are indexed to S 2p3/2 and S 2p1/2, which are explained as S2− with low surface coordination and sulfur–metal bonds, respectively. In addition, the S 2p peak at around 168.6 eV is attributed to the surface sulfur species at certain higher oxidation states.31–34 These results agree well with the HR-TEM, EDX and XRD analysis.
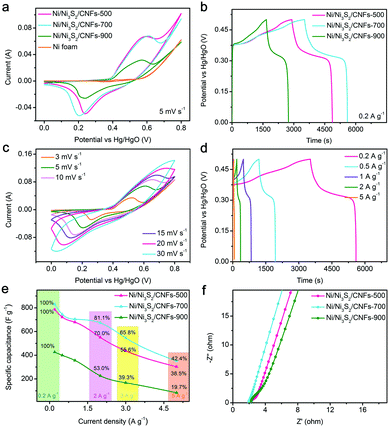
The electrochemical performance of the as-fabricated electrodes is tested in a three electrode system using 3 M KOH as the electrolyte. The influence of calcination temperature on electrochemical performance is investigated. In detail, as illustrated in Fig. 3a, one clear redox peak pair between 0.1 and 0.7 V appears in the CV curves of the Ni/Ni3S2/CNFs-500, Ni/Ni3S2/CNFs-700 and Ni/Ni3S2/CNFs-900 electrodes at a scan rate of 5 mV s−1, corresponding to the associated redox reactions of Ni2+/Ni3+ as shown below.
| Ni3S2 + 3OH− ↔ Ni3S2 (OH)3 + 3e−. |
| Cg = (IΔt)/(mΔV) |
From Fig. 3b, the specific capacitance of the Ni/Ni3S2/CNFs-500, Ni/Ni3S2/CNFs-700, and Ni/Ni3S2/CNFs-900 electrodes at 0.2 A g−1 is calculated to be 785.8, 830.0, and 426.5 F g−1, respectively, consistent with the results presented by the CV curves. Notably, because of the electrochemical polarization of the electrode material, the voltage range of the GCD curves deviates from that of the CV curves.35,36Fig. 3c displays CV curves at different scan rates ranging from 3 to 30 mV s−1 for the Ni/Ni3S2/CNFs-700 electrode. As the scan rate increases, the symmetric shape of the oxidation peak and reduction peak is well maintained, which is recorded to understand the good reversibility of electrodes. The redox peak shifts in their respective directions due to the increment in mass transport resistance.37 On the basis of GCD curves in Fig. 3d, the specific capacitance of the Ni/Ni3S2/CNFs-700 electrode is 744.5, 704.0, 672.8, and 352.0 F g−1 at densities of 0.5, 1, 2, and 5 A g−1. A detailed comparison of specific capacitance and capacitance retention at different densities for different electrodes are shown in Fig. 3e. When the current density is increased by 25 times, the specific capacitance can still maintain 42.4% of the original value, which is higher than 38.5% of the value of Ni/Ni3S2/CNFs-500, 19.7% of Ni/Ni3S2/CNFs-900 and some typical materials reported in previous literature, such as PPNF@Ni-MOF (from 0.5 to 5 A g−1, 42.9%);28 Co9S8/RGO/Ni3S2 on Ni foam (from 3.9 to 15.6 A g−1, 69.5%);38 hollow NiSx microspheres (from 0.5 to 8.0 A g−1, 20.4%);39 and NiMn-LDH nanosheet@Ni3S2 nanorod (from 3 to 20 A g−1, 68.3%).40
Electrochemical impedance spectroscopy (EIS) analysis is employed to understand the high performance of Ni/Ni3S2/CNFs-700. The Nyquist plots in Fig. 3f are tested within the frequency ranges from 0.01 Hz to 105 Hz. Charge-transfer impedance is represented by the semicircle in the high frequency region of the Nyquist plot, occurring on the electrode–electrolyte interface of the electrode. Smaller radius can be explained as lower charge transfer resistance, leading to the better rate performance of the Ni/Ni3S2/CNFs-700 electrode than other electrodes.41,42 And the lower ion transfer resistance of the Ni/Ni3S2/CNFs-700 electrode can be verified by the larger slope of inclined lines in the low frequency region, which is a key factor for high capacitance.43 These results reveal that the superior performance of Ni/Ni3S2/CNFs-700 to Ni/Ni3S2/CNFs-500 and Ni/Ni3S2/CNFs-900 electrodes benefits from the optimum degree of calcination of precursors. First, compared with Ni/CNFs-900, Ni/CNFs-700 with well-preserved morphologies as a template not only is conducive to making contact with sulfur sources but also provides a larger interface area between Ni/Ni3S2/CNFs-700 and KOH. Second, the higher degree of carbonization leads to better conductivity of Ni/Ni3S2/CNFs-700 than Ni/Ni3S2/CNFs-500, which is beneficial to the fast electron transport. In addition, the crystallization and particle size of nickel determine the sulfurization degree of the materials, further affecting their electrochemical behaviors.
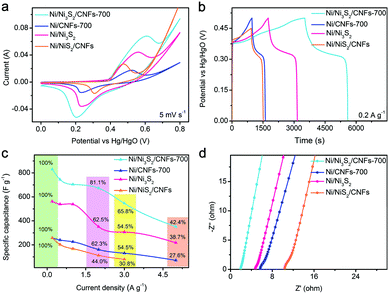
The samples of Ni/CNFs-700, MOF derived Ni/Ni3S2 and not-MOF derived Ni/NiS2/CNFs are prepared to evaluate the effects of the core–shell structure and sulfurization on the electrochemical behaviors of Ni/Ni3S2/CNFs-700. Fig. 4a shows the CV measurements of the Ni/Ni3S2/CNFs-700, Ni/CNFs-700, MOF derived Ni/Ni3S2 and not-MOF derived Ni/NiS2/CNFs electrodes at a constant scan rate of 5 mV s−1. It is found that the Ni/Ni3S2/CNFs-700 electrode delivers much larger capacitance than the Ni/CNFs-700 electrode, suggesting that the conversion from nickel to nickel sulfide contributes significantly to the capacity of the samples. As illustrated in Fig. 4b, charging and discharging platforms of four electrodes are associated with their corresponding redox reactions of Ni2+/Ni3+. When the current density is 0.2 A g−1, the specific capacitances of the Ni/CNFs-700, MOF derived Ni/Ni3S2 and not-MOF derived Ni/NiS2/CNFs electrodes are 257.5, 561.8, and 257.2 F g−1. The Ni/Ni3S2/CNFs-700 electrode possesses higher capacitance than both MOF derived Ni/Ni3S2 and not-MOF derived Ni/NiS2/CNFs, from which it can be inferred that the construction of the core–shell structure is beneficial to the increment of their electrochemical properties. Furthermore, the Ni/Ni3S2/CNFs-700 electrode exhibits a superior rate capacity over other electrodes (Fig. 4c). In particular, the introduction of nickel sulfide particles into carbon nanofibers not only plays an important role in the improved capacitance, but also helps in the improvement of the rate performance, which may be resulting from their relatively large redox active interface area and high conductivity.
Fig. 4d shows that both the Ni3S2 and core–shell structure of the Ni/Ni3S2/CNFs-700 sample synergistically facilitate the charge transfer and electrolyte diffusion into the electrode material. On the one hand, Ni3S2 with superior intrinsic electronic properties closely combines with conductive carbon materials, providing a large number of redox active sites and smooth channels for electrons. On the other hand, the core–shell structure constructs a high electrolyte/electrode interface area, resulting in efficient ion diffusion. These characteristics contribute to the improved electrochemical performance to some degree.
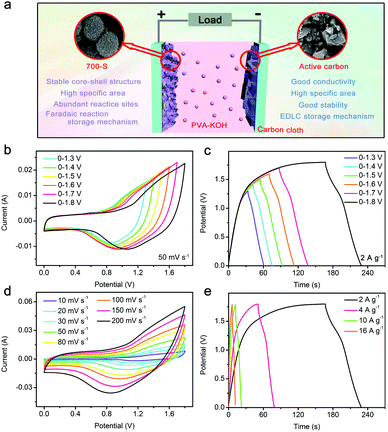
An asymmetric solid-state supercapacitor is assembled to further investigate the potential practical application of the Ni/Ni3S2/CNFs-700 materials. The loading mass ratio of Ni/Ni3S2/CNFs-700 to AC is estimated to be 1![[thin space (1/6-em)]](https://www.rsc.org/images/entities/char_2009.gif) :
:![[thin space (1/6-em)]](https://www.rsc.org/images/entities/char_2009.gif) 4.4 in light of the results exhibited in Fig. S7 (ESI†). Fig. 5a schematically demonstrates the construction of the asymmetric solid-state supercapacitor (ASC). PVA-KOH and carbon cloth are used as the electrolyte and current collector, respectively. CV curves at a scan rate of 50 mV s−1 and GV curves at a current density of 2 A g−1 are measured within different potential windows. From Fig. 5b and c, it is noticed that the voltage range can be extended to 1.8 V because of the application of solid electrolytes.44,45 And as the voltage range expands, the capacitance of the device is improved. The specific capacitance of the ASC is obtained according to the following formula:
4.4 in light of the results exhibited in Fig. S7 (ESI†). Fig. 5a schematically demonstrates the construction of the asymmetric solid-state supercapacitor (ASC). PVA-KOH and carbon cloth are used as the electrolyte and current collector, respectively. CV curves at a scan rate of 50 mV s−1 and GV curves at a current density of 2 A g−1 are measured within different potential windows. From Fig. 5b and c, it is noticed that the voltage range can be extended to 1.8 V because of the application of solid electrolytes.44,45 And as the voltage range expands, the capacitance of the device is improved. The specific capacitance of the ASC is obtained according to the following formula:
| Ccell = (IΔt)/(mtotalΔV) |
Referring to Fig. 5c, the specific capacitance with voltage windows of 0–1.3, 0–1.4, 0–1.5, 0–1.6, 0–1.7 and 0–1.8 V is calculated to be 43.6, 47.6, 52.7, 54.4, 58.8, and 70.2 F g−1, respectively. In addition, CV measurements at different scan rates and GV measurements at various current densities are explored in the potential range of 0–1.8 V. There is no distinct deformation for the shape of CV curves with the increase of scan rate, indicating the fast charging/discharging process of the ASC. The energy density and power density of the ASC can be calculated based on its specific capacitance at different current densities and the following formula.
| E = 1/2CcellΔV2 |
| P = E/t |
Ragone plots of energy density vs. power density are depicted in Fig. 6a. The ASC delivers the highest energy density of 31.6 W h kg−1 at 2 A g−1 with a power density of 1800 W kg−1. When the current density is increased to 16 A g−1, the maximum power density of 14![[thin space (1/6-em)]](https://www.rsc.org/images/entities/char_2009.gif) 400 W kg−1 is achieved, and the energy density can still be maintained at around 26.5 W h kg−1. The high energy density is related to the high specific capacitance of Ni/Ni3S2/CNFs-700 and the sufficient power from active carbon. This good performance is better than the performance reported in previous similar works on asymmetric supercapacitors, including Ni3S2/MWCNT-NC//AC (19.8 W h kg−1, 798 W kg−1);13 NiCo2S4@NiO//AC (30.4 W h kg−1, 288 W kg−1);46 NF@rGO/Ag/Ni3S2//N-G ASC (28.7 W h kg−1, 425 W kg−1);47 ppy@Ni3S2//AC (17.5 W h kg−1, 179.3 W kg−1);48 and NiS HNPs//AC (11.6 W h kg−1, 187.5 W kg−1).49
400 W kg−1 is achieved, and the energy density can still be maintained at around 26.5 W h kg−1. The high energy density is related to the high specific capacitance of Ni/Ni3S2/CNFs-700 and the sufficient power from active carbon. This good performance is better than the performance reported in previous similar works on asymmetric supercapacitors, including Ni3S2/MWCNT-NC//AC (19.8 W h kg−1, 798 W kg−1);13 NiCo2S4@NiO//AC (30.4 W h kg−1, 288 W kg−1);46 NF@rGO/Ag/Ni3S2//N-G ASC (28.7 W h kg−1, 425 W kg−1);47 ppy@Ni3S2//AC (17.5 W h kg−1, 179.3 W kg−1);48 and NiS HNPs//AC (11.6 W h kg−1, 187.5 W kg−1).49
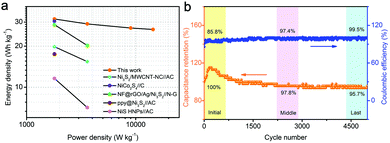 | ||
| Fig. 6 (a) Ragone plots (energy density vs. power density), (b) the cycling stability and Coulombic efficiency of the as-assembled ASC devices. | ||
Cycling stability is another important factor for practical application of supercapacitors. Fig. 6b shows the capacitance retention and corresponding Coulombic efficiency of the Ni/Ni3S2/CNFs//AC ASC device at a current density of 2 A g−1. For the first 400 cycles, because of the activation of the electrode material, the capacitance is on the rise and the Coulombic efficiency gradually stabilizes to be around 93.5%. After 5000 charge and discharge cycles, capacitance can still maintain 95.7% of the initial value and the Coulombic efficiency reaches 99.5% of the initial value, indicating the good cycling stability and reversibility.50,51
Conclusions
In summary, we have designed and prepared novel hierarchical Ni/Ni3S2 decorated CNFs through the template growth of MOF on PPNFs followed by carbonization and sulfurization processes. The obtained Ni/Ni3S2/CNFs electrode displays a high specific capacitance of 830.0 F g−1 at 0.2 A g−1 and excellent rate performance, which are attributed not only to the superior pseudocapacitance of Ni3S2 and the high conductivity of Ni/CNFs, but also to the large active interface area provided by the MOF on the PPNF derived core–shell structure. In addition, an asymmetric solid-state supercapacitor is assembled with a high energy of 31.6 W h kg−1 at a power density of 1800 W kg−1 and good cycling stability over 5000 cycles.Conflicts of interest
There are no conflicts to declare.Acknowledgements
This work was financially supported by the National Natural Science Foundation of China (21875084, 51773075) and the Project of Science and Technology Agency, Jilin Province (20190101013JH).References
- X. Lu, C. Wang, F. Favier and N. Pinna, Adv. Energy Mater., 2017, 7, 1601301 CrossRef.
- A. T. E. Vilian, B. Dinesh, M. Rethinasabapathy, S. K. Hwang, Ch. S. Jin, Y. S. Huh and Y. K. Han, J. Mater. Chem. A, 2018, 6, 14367–14379 RSC.
- X. Han, Y. Yang, J. Zhou, Q. Ma, K. Tao and L. Han, Chem. – Eur. J., 2018, 24, 1–10 CrossRef CAS.
- L. Liu, Y. Yan, Z. Cai, S. Lin and X. Hu, Adv. Mater. Interfaces, 2018, 5, 1701548 CrossRef.
- C. Qu, Z. Liang, Y. Jiao, B. Zhao, B. Zhu, D. Dang, S. Dai, Y. Chen, R. Zou and M. Liu, Small, 2018, 14, 1800285 CrossRef PubMed.
- J. S. Chen, C. Guan, Y. Gui and D. J. Blackwood, ACS Appl. Mater. Interfaces, 2017, 9, 496–504 CrossRef CAS PubMed.
- B. Li, M. Zheng, H. Xue and H. Pang, Inorg. Chem. Front., 2016, 3, 175–202 RSC.
- H. Huo, Y. Zhao and C. Xu, J. Mater. Chem. A, 2014, 2, 15111–15117 RSC.
- L. Mi, Q. Ding, W. Chen, L. Zhao, H. Hou, C. Liu, C. Shen and Z. Zheng, Dalton Trans., 2013, 42, 5724–5730 RSC.
- J. Zhu, S. P. Jiang, R. Wang, K. Shic and P. K. Shen, J. Mater. Chem. A, 2014, 2, 15448–15453 RSC.
- W. He, C. Wang, H. Li, X. Deng, X. Xu and T. Zhai, Adv. Energy Mater., 2017, 7, 1700983 CrossRef.
- T. Li, Y. Zuo, X. Lei, N. Li, J. Liu and H. Han, J. Mater. Chem. A, 2016, 4, 8029–8040 RSC.
- C. S. Dai, P. Y. Chien, J. Y. Lin, S. W. Chou, W. K. Wu, P. H. Li, K. Y. Wu and T. W. Lin, ACS Appl. Mater. Interfaces, 2013, 5, 12168–12174 CrossRef CAS PubMed.
- W. Du, Y. L. Bai, J. Xu, H. Zhao, L. Zhang, X. Li and J. Zhang, J. Power Sources, 2018, 402, 281–295 CrossRef CAS.
- C. Wang, Y. V. Kaneti, Y. Bando, J. Lin, C. Liu, J. Li and Y. Yamauchi, Mater. Horiz., 2018, 5, 394–407 RSC.
- W. Zhao, J. Peng, W. Wang, S. Liu, Q. Zhao and W. Huang, Coord. Chem. Rev., 2018, 377, 44–63 CrossRef CAS.
- S. Sundriyal, H. Kaur, S. K. Bhardwaj, S. Mishra, K. H. Kim and A. Deep, Coord. Chem. Rev., 2018, 369, 15–38 CrossRef CAS.
- Y. L. Li, J. J. Zhou, M. K. Wu, C. Chen, K. Tao, F. Y. Yi and L. Han, Inorg. Chem., 2018, 57, 6202–6205 CrossRef CAS PubMed.
- K. Rui, X. Wang, M. Du, Y. Zhang, Q. Wang, Z. Ma, Q. Zhang, D. Li, X. Huang, G. Sun, J. Zhu and W. Huang, ACS Appl. Mater. Interfaces, 2018, 10, 2837–2842 CrossRef CAS PubMed.
- K. Qi, R. Hou, S. Zaman, Y. Qiu, B. Y. Xia and H. Duan, ACS Appl. Mater. Interfaces, 2018, 10, 18021–18028 CrossRef CAS PubMed.
- C. Qu, Z. Liang, Y. Jiao, B. Zhao, B. Zhu, D. Dang, S. Dai, Y. Chen, R. Zou and M. Liu, Small, 2018, 14, 1800285 CrossRef PubMed.
- Y. Huang, L. Quan, T. Liu, Q. Chen, D. Cai and H. Zhan, Nanoscale, 2018, 10, 14171–14181 RSC.
- X. Liu, W. Zang, C. Guan, L. Zhang, Y. Qian, A. M. Elshahawy, D. Zhao, S. J. Pennycook and J. Wang, ACS Energy Lett., 2018, 3, 2462–2469 CrossRef CAS.
- C. Qu, L. Zhang, W. Meng, Z. Liang, B. Zhu, D. Dang, S. Dai, B. Zhao, H. Tabassum, S. Gao, H. Zhang, W. Guo, R. Zhao, X. Huang, M. Liu and R. Zou, J. Mater. Chem. A, 2018, 6, 4003–4012 RSC.
- Y. Su, S. Li, D. He, D. Yu, F. Liu, N. Shao and Z. Zhang, ACS Sustainable Chem. Eng., 2018, 6, 11989–11998 CrossRef CAS.
- Y. Zhang, H. Chen, C. Guan, Y. Wu, C. Yang, Z. Shen and Q. Zou, ACS Appl. Mater. Interfaces, 2018, 10, 18440–18444 CrossRef CAS PubMed.
- J. Zhao, H. Li, C. Li, Q. Zhang, J. Sun, X. Wang, J. Guo, L. Xie, J. Xie, B. He, Z. Zhou, C. Lu, W. Lu, G. Zhu and Y. Yao, Nano Energy, 2018, 45, 420–431 CrossRef CAS.
- D. Tian, X. Lu, Y. Zhu, M. Li and C. Wang, J. Power Sources, 2019, 413, 50–58 CrossRef CAS.
- C. Zhang, Y. Huang, S. Tang, M. Deng and Y. Du, ACS Energy Lett., 2017, 2, 759–768 CrossRef CAS.
- W. Wei, L. Mi, Y. Gao, Z. Zheng, W. Chen and X. Guan, Chem. Mater., 2014, 26, 3418–3426 CrossRef CAS.
- W. He, C. Wang, H. Li, X. Deng, X. Xu and T. Zhai, Adv. Energy Mater., 2017, 7, 1700983 CrossRef.
- X. Wang, B. Shi, X. Wang, J. Gao, C. Zhang, Z. Yang and H. Xie, J. Mater. Chem. A, 2017, 5, 23543–23549 RSC.
- X. Liu, Y. Li, N. Chen, D. Deng, X. Xing and Y. Wang, Electrochim. Acta, 2016, 213, 730–739 CrossRef CAS.
- J. Wen, S. Li, K. Zhou, Z. Song, B. Li, Z. Chen, T. Chen, Y. Guo and G. Fang, J. Power Sources, 2016, 324, 325–333 CrossRef CAS.
- S. Liu, S. C. Lee, U. M. Patil, C. Ray, K. V. Sankar, K. Zhang, A. Kundu, S. Kang, J. H. Parkc and S. C. Jun, J. Mater. Chem. A, 2017, 5, 4543–4549 RSC.
- A. S. Hameed, Phosphate Based Cathodes and Reduced Graphene Oxide Composite Anodes for Energy Storage Applications, Springer, 2016 Search PubMed.
- X. Xiong, B. Zhao, D. Ding, D. Chen, C. Yang, Y. Lei and M. Liu, NPG Asia Mater., 2016, 8, 1–7 Search PubMed.
- Z. Zhang, Q. Wang, C. Zhao, S. Min and X. Qian, ACS Appl. Mater. Interfaces, 2015, 7, 4861–4868 CrossRef CAS PubMed.
- J. Wang, K. Y. Ma, J. Zhang, F. Liu and J. P. Cheng, J. Colloid Interface Sci., 2017, 507, 290–299 CrossRef CAS PubMed.
- S. Yu, Y. Zhang, G. Lou, Y. Wu, X. Zhu, H. Chen, Z. Shen, S. Fu, B. Bao and L. Wu, Sci. Rep., 2018, 8, 5246 CrossRef PubMed.
- G. Zhu, H. Wen, M. Ma, W. Wang, L. Yang, L. Wang, X. Shi, X. Cheng, X. Sun and Y. Yao, Chem. Commun., 2018, 54, 10499–10502 RSC.
- H. Zhang, B. Xu, Z. Xiao, H. Mei, L. Zhang, Y. Han and D. Sun, CrystEngComm, 2018, 20, 4313–4320 RSC.
- X. M. Cao, Z. J. Sun, S. Y. Zhao, B. Wang and Z. B. Han, Mater. Chem. Front., 2018, 2, 1692–1699 RSC.
- L. Zhang, P. Zhu, F. Zhou, W. Zeng, H. Su, G. Li, J. Gao, R. Sun and C. Wong, ACS Nano, 2016, 10, 1273–1282 CrossRef CAS PubMed.
- D. Tian, X. Lu, G. Nie, M. Gao and C. Wang, Inorg. Chem. Front., 2018, 5, 635–642 RSC.
- Y. Huang, T. Shi, S. Jiang, S. Cheng, X. Tao, Y. Zhong, G. Liao and Z. Tang, Sci. Rep., 2016, 6, 38620 CrossRef CAS PubMed.
- J. Qi, Y. Chang, Y. Sui, Y. He, Q. Meng, F. Wei, Y. Ren and Y. Jin, Adv. Mater. Interfaces, 2018, 5, 1700985 CrossRef.
- L. Long, Y. Yao, M. Yan, H. Wang, G. Zhang, M. Kong, L. Yang, X. Liao, G. Yin and Z. Huang, J. Mater. Sci., 2017, 52, 3642–3656 CrossRef CAS.
- Z. Li, X. Yu, A. Gu, H. Tang, L. Wang and Z. Lou, Nanotechnology, 2017, 28, 065406 CrossRef PubMed.
- D. Tian, X. Lu, G. Nie, M. Gao, N. Song and C. Wang, Appl. Surf. Sci., 2018, 458, 389–396 CrossRef CAS.
- Z. Tang, C. Tang and H. Gong, Adv. Funct. Mater., 2012, 22, 1272–1278 CrossRef CAS.
Footnote |
| † Electronic supplementary information (ESI) available. See DOI: 10.1039/c9qm00296k |
| This journal is © the Partner Organisations 2019 |

