A glutathione responsive pyrrolopyrrolidone nanotheranostic agent for turn-on fluorescence imaging guided photothermal/photodynamic cancer therapy†
Jianhua
Zou
a,
Lei
Xue
a,
Nan
Yang
a,
Yanfang
Ren
b,
Zhe
Fan
c,
Wenjun
Wang
b,
Weili
Si
 *a,
Yewei
Zhang
*c,
Wei
Huang
ade and
Xiaochen
Dong
 *a
*a
aKey Laboratory of Flexible Electronics (KLOFE) & Institute of Advanced Materials (IAM), Nanjing Tech University (NanjingTech), 30 South Puzhu Road, Nanjing, 211800, China. E-mail: iamxcdong@njtech.edu.cn; iamwlsi@njtech.edu.cn
bSchool of Physical Science and Information Technology, Liaocheng University, Liaocheng 252059, China
cDepartment of Hepatobiliary and Pancreatic Surgery, Zhongda Hospital, Medical School, Southeast University, Nanjing 210009, China. E-mail: zhangyewei@njmu.edu.cn
dSchool of Chemistry and Materials Science, Nanjing University of Information Science & Technology, Nanjing, 210044, China
eShaanxi Institute of Flexible Electronics (SIFE), Northwestern Polytechnical University (NPU), 127 West Youyi Road, Xi'an, 710072, China
First published on 21st August 2019
Abstract
The high concentration of glutathione (GSH), a feature of solid tumors, can reduce the reactive oxygen species (ROS) damage to cancer cells, which seriously weakens the efficacy of photodynamic therapy in cancer treatment. Herein, we designed and synthesized two kinds of GSH responsive pyrrolopyrrolidone (DPP) derivatives that conjugated with 2-(diphenylmethylene) malononitrile (DPPBPh) and 2,3,3-triphenylacrylonitrile (DPPTPh), respectively. DPPTPh with two –CN groups shows higher singlet oxygen quantum yield and photothermal conversion efficiency than DPPBPh with four –CN groups. These two DPP derivatives can not only be used as colorimetric GSH probes to avoid the fluorescence quenching caused by aggregation, but also enhance the photodynamic/photothermal therapeutic efficacy of their corresponding nanoparticles (NPs). Moreover, DPPTPh NPs exhibit better therapeutic efficacy than DPPBPh NPs even at a low dose (0.2 mg kg−1). This work presents DPP derivative-based theranostic nanomedicines for GSH responsive fluorescence “turn on” imaging and enhanced photodynamic/photothermal synergistic therapy.
Introduction
Phototherapy, including photodynamic and photothermal therapy, is of great importance for cancer treatment due to its high selectivity and non-invasiveness.1–10 Different kinds of organic and inorganic materials have been utilized as photosensitizers (PSs) and achieved remarkable effectiveness in cancer diagnosis and therapy. Among these PSs, pyrrolopyrrolidone (DPP) derivatives show great potential in imaging guided phototherapy owing to their good photostability and high molar extinction coefficient.11–15 However, they usually suffer from poor solubility in aqueous solution and severe aggregation caused quenching (ACQ), which limit their biological applications. Therefore, modification of pyrrolopyrrolidone (DPP) derivatives is urgently needed to develop novel PSs for overcoming aggregation caused quenching and improving anticancer efficacy.Cancer cells with vasculature configuration and over proliferation of neoplastic cells, have an altered mitochondrial redox state, typically characterized by high levels of reactive oxygen species (ROS) and antioxidants, such as glutathione (GSH). GSH has been reported to be able to react with ROS, which can reduce the damage of ROS to the cancer cells. Therefore, it has been recognized that disrupting the redox homeostasis can be a potential strategy for cancer treatment. Depletion of antioxidants, such as GSH, will amplify intracellular oxidative stress, thereby triggering cancer cell death and enabling more effective cancer treatment.
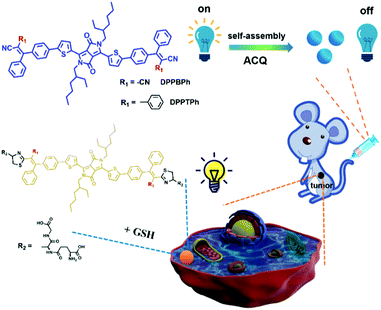
Thiols, the typical group in GSH, have been utilized as the targeting group of diverse fluorophores,16–25 such as fluorescein,26 rhodamine,27 and 4-bora-3a,4a-diaza-s-indacene (BODIPY).28,29 The above fluorescent thiol sensors are always designed based on the photo-induced electron transfer (PET) mechanism.16 It is well known that a –CN group is able to recognize the thiols of GSH to form a thiazole ring via the mechanism of Michael addition, leading to an enhanced fluorescence.30 Considering the fact that the concentration of GSH in cancer cells is higher than that in normal cells, we develop two DPP derivatives, namely 2,2′-(((5,5′-(2,5-bis(2-ethylhexyl)-3,6-dioxo-2,3,5,6-tetrahydropyrrolo[3,4-c]pyrrole-1,4-diyl)bis(thiophene-5,2-diyl))bis(3,1-phenylene))bis(phenylmethanylylidene))dimalononitrile (DPPBPh) and (2E,2′E)-3,3′-((5,5′-(2,5-bis(2-ethylhexyl)-3,6-dioxo-2,3,5,6-tetrahydropyrrolo[3,4-c]pyrrole-1,4-diyl)bis(thiophene-5,2-diyl))bis(3,1-phenylene))bis(2,3-diphenylacrylonitrile) (DPPTPh) (Fig. S1, ESI†) for GSH responsive fluorescence imaging and GSH depletion. The nanoparticles (NPs) of the two compounds obtained by the nano-precipitation method still display high singlet oxygen generation ability and excellent photothermal conversion efficiency (34.5% for DPPBPh and 45.2% for DPPTPh), which are desirable for photodynamic and photothermal synergistic therapy. Meanwhile, the half maximal inhibitory concentration (IC50) of DPPTPh NPs is lower than that of DPPBPh NPs due to more -CN groups for GSH depletion. Furthermore, the fluorescence imaging indicates that both DPPTPh and DPPBPh NPs can efficiently accumulate in the tumor site via the enhanced permeability retention (EPR) effect and present GSH responsive turn-on fluorescence imaging. Moreover, DPPBPh NPs exhibit improved therapeutic efficacy compared with DPPTPh NPs even at a low dose (Scheme 1). The results provide a new way to design colorimetric photosensitizers for GSH responsive fluorescence “turn on” imaging guided phototherapy.
Experimental
Materials and apparatus
All the chemicals were purchased from Sigma (Shanghai) and used without further purification. The 1H NMR and 13C NMR spectra were measured on a Bruker DRX NMR spectrometer (500 MHz) at 298 K in CDCl3 solution with solvent residual as internal standard (CDCl3, δ = 7.26 ppm). UV-vis spectra were recorded on a UV-3600 spectrophotometer (Shimadzu, Japan). Fluorescence spectra were obtained on an F-4600 HITACHI spectrometer from Japan. Dynamic light scattering (DLS) was measured on a 90 Plus particle size analyzer from the USA (Brookhaven Instruments). Transmission electron microscope (TEM) images of the NPs were measured on a JEOL JEM-2100. The fluorescence bio-imaging was recorded on a PerkinElmer IVIS Lumina K.Preparation of DPPBPh and DPPTPh NPs
A re-precipitation method was used to prepare DPPBPh and DPPTPh NPs. DPPBPh or DPPTPh (5 mg) was dissolved in tetrahydrofuran (THF, 1 mL) with ultrasonication. Then 400 μL of such solution (5 mg mL−1) was added into distilled water (10 mL) under vigorous stirring at room temperature, respectively. Nitrogen was purged into the solution for 20 min to remove THF and the solution was stirred overnight. DPPBPh and DPPTPh NPs were obtained by centrifugation and re-dispersed in water.Cell culture and MTT assay
HeLa cell lines were commercially available from Institute of Biochemistry and Cell Biology, SIBS, CAS (China). The cells were cultured in a medium consisting of Dulbecco's modified Eagle's medium (DMEM, Gibco) and fetal bovine serum (FBS, 10%) at 37 °C under the atmosphere of 5% CO2. The cells were seeded in a 96-well plate. Cell viability was determined by MTT (3-(4,5-dimethylthiazol-2-yl)-2,5-diphenyltetrazolium bromide) assay. Concentrated DPPBPh and DPPTPh NPs in phosphate buffer saline (PBS) were diluted with DMEM to various concentrations and added into the 96-well plate. After incubation for 24 h, for the illumination groups, cells were irradiated with a laser (660 nm, 0.5 W cm−2) for 5 min. While for the control or the no illumination groups, the cells were not irradiated exceptionally. After 12 h, a solution of MTT (5 mg mL−1, 20 μL) was added to each well under the same conditions at 37 °C. Then the liquid was discarded, followed by addition of 150 μL of DMSO. The absorbance (at 492 nm) was measured on a microplate reader (Bio-Tek microplate) at room temperature. Cell viability was determined by the following equation: viability (%) = mean absorbance in each group with different concentrations of NPs/mean absorbance incubated with DMEM only × 100%.Cellular uptake and in vitro ROS detection
HeLa cells were incubated with DPPBPh and DPPTPh NPs in a confocal dish for 24 h. Then the solution of the NPs was discarded and the cells were washed with PBS (3 mL), followed by treating with 1 mL polyoxymethylene for 25 min. The supernatant was discarded and the cells were washed with PBS three times (1 mL). These samples were further incubated with 2,7-dichlorodihydrofluorescein diacetate (DCF-DA, 10 μmol) for another 3 min and washed with PBS three times (1 mL). They were irradiated by a laser (660 nm, 0.5 W cm−2) for 3 minutes. Fluorescence images were recorded on a confocal laser scanning microscope (CLSM). The samples incubated with DCF-DA under irradiation were excited with a 488 nm laser and fluorescence was collected from 500 to 600 nm.Pharmacokinetic study
Six Sprague-Dawley rats (three males and three females, 220 ± 10.0 g) were obtained from the Animal Center of Nanjing Medical University (NJMU, Nanjing, China). The animals were housed under standard conditions and had free access to food and water. This animal study was reviewed and approved by the Animal Ethical Committee of Nanjing Tech University. After being fasted for 12 h, six rats were injected with DPPBPh, DPPTPh NPs, and molecular solutions dissolved in saline containing 10% DMSO, respectively, at the dose of 10 mg kg−1via the tail vein. Blood samples (0.2 mL) were collected in heparinized Eppendorf tubes from the ophthalmic venous plexus at 0 (pre-dose), 0.083, 0.25, 0.5, 1, 2, 4, 6, 8, 12 and 24 h after intravenous (i.v.) administration. Plasma was separated by centrifuging the blood at 3000 × g for 10 min at 4 °C and stored at −70 °C until analysis.The dispersions of DPPBPh and DPPTPh NPs at different concentrations were prepared by diluting stock solution with DMSO, while the working solutions for DPPBPh and DPPTPh NPs were diluted by PBS at the same range. Subsequently, the calibration standards were prepared by spiking 20 μL DPPBPh and DPPTPh NPs into 180 μL blank rat plasma at concentrations of 1.25, 2.5, 5, 10, 20, and 50 μg mL−1. The standard curve samples and the rat plasma samples were transferred to the micro cuvette and analyzed by using an ultraviolet spectrophotometer.
The pharmacokinetic parameters were calculated by a non-compartmental method using DAS 3.0 software (Mathematical Pharmacology Professional Committee of China, Shanghai, China). The area under the curve (AUC) from zero to the last measurable plasma concentration point (AUC0–t), AUC from zero to infinity (AUC0–∞), the elimination rate constant (K), the terminal elimination half-life (T1/2), mean residence time (MRT), and systemic clearance (CL) were calculated by software.
In vivo tumor treatment histology examination and fluorescence imaging
The animal ethic approval was available from the Animal Center of Nanjing Technological University (Nanjing, China, SCXK-2017-007). 20 nude mice were injected with HeLa cells into the armpit as the tumor source. The mice were divided into 5 groups randomly when the tumor volume reached approximately 100 mm3. The mice in the control group were intravenously injected with saline and the illumination groups were intravenously injected with DPPBPh and DPPTPh NPs (50 μg mL−1, 100 μL), respectively. The tumors of the control and illumination groups were irradiated by laser (660 nm, 0.5 W cm−2). Every two days, the body weight and tumor volume of these mice were recorded. The tumor volume was calculated with the following equation: volume = length × width2 × 0.5. The nude mice were then sacrificed after phototherapy. The tumors and normal organs, including heart, liver, spleen, lungs and kidneys, were analyzed by histology. The tissues of the tumor and main organs were embedded in paraffin cassettes and stained with hematoxylin and eosin (H&E) after dehydration, and the images were recorded on a microscope.Statistical analysis
Data were presented as mean ± standard error of the mean (SEM). Significant differences between groups were indicated by *p < 0.05, **p < 0.01 and ***p < 0.001, respectively.Results and discussion
Synthesis and characterization of DPPBPh and DPPTPh
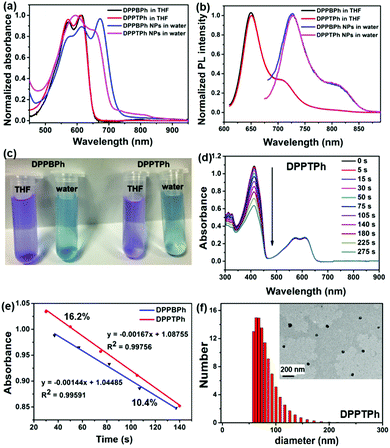
The general synthetic routes of DPPBPh and DPPTPh are shown in the ESI,† (Fig. S1). DPPBPh and DPPTPh were prepared through a C–H activation reaction in the presence of anhydrous K2CO3 and PivOH with Pd(OAc)2 as the catalyst in anhydrous DMA solution. These two compounds could be obtained in moderate yields. The structures of DPPBPh and DPPTPh have been characterized by 1H NMR, 13C NMR and mass spectroscopy (Fig. S2–S5, ESI†). As shown in Fig. 1a, DPPBPh and DPPTPh in THF exhibit maximum absorbance at 575 nm, 612 nm and 573 nm, 612 nm, respectively. The absorbance peaks of the as-prepared nanoparticles shift to 614, 672 nm for DPPBPh and 594, 655 nm for DPPTPh in water, respectively. In the photoluminescence spectra (Fig. 1b), DPPBPh and DPPTPh in THF show emission peaks at 649 nm, 710 nm, 651 nm, and 711 nm, respectively. In contrast, a large Stokes shift was also observed for those nanoparticles in water (727 nm, 808 nm for DPPBPh and 728 nm, 808 nm for DPPTPh), which can be ascribed to either the solvent effect or the aggregation of these compounds. The photograph of the compounds in THF and the NPs in water is shown in Fig. 1c.High production of 1O2 is of tremendous significance for photosensitizers. The 1O2 QYs of DPPBPh and DPPTPh in dichloromethane (DCM) were quantitatively calculated using methylene blue (MB) as a standard substance (ΦΔ = 57%,3 Fig. S6, ESI†). The degradation speed of 1,3-diphenylisobenzofuran (DPBF) with DPPTPh is higher than that of DPPBPh. And the 1O2 QY of DPPTPh was determined to be 22.3%, which is superior to that of DPPBPh (12.5%) (Fig. 1d and e). The morphology and size of DPPBPh and DPPTPh NPs were studied by transmission electron microscope (TEM) and dynamic light scattering (DLS), respectively. From Fig. 1f and Fig. S6d (ESI†), it can be seen that these compounds formed spherical NPs with hydrodynamic size distribution between 34 to 135 nm for DPPBPh and 58 to 192 nm for DPPTPh, respectively.
Photothermal conversion efficiency of DPPBPh and DPPTPh NPs
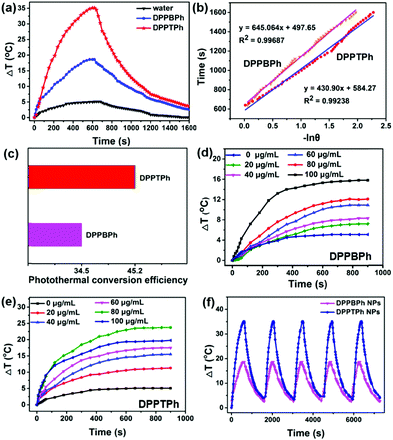
To examine the photothermal conversion efficiency, the temperature changes of DPPBPh and DPPTPh NPs in water were recorded under laser irradiation (660 nm, 0.5 W cm−2). As illustrated in Fig. 2a, the temperature increase of DPPBPh and DPPTPh NP dispersions are 34.8 °C and 17.2 °C, respectively, while that of water is almost negligible. The photothermal conversion efficiency of DPPTPh NPs was calculated to be 45.2%, which was higher than that of DPPBPh NPs (34.5%) (Fig. 2b and c). The singlet oxygen quantum yield of DPPBPh and DPPTPh is lower than that of the previously reported 3,6-bis(5-(4-(diphenylamino)-phenyl)thiophen-2-yl)-2,5-bis(2-ethyl heptyl)pyrrolo[3,4-c]pyrrole-1,4(2H,5H)-dione (DPPTPA) NPs (33.6%). And the photothermal conversion efficiency of DPPBPh is parallel to that of DPPTPA (34.5%) while that of DPPTPh is higher.15 In addition, the temperature increased with the increasing of the DPPBPh and DPPTPh NP concentrations, indicating obvious concentration dependence (Fig. 2d and e). Meanwhile, both the DPPBPh and DPPTPh NPs exhibited outstanding optical stability even after 5 cycles of laser-induced photothermal heating (Fig. 2f), demonstrating excellent photothermal stability.GSH responsiveness of DPPBPh and DPPTPh
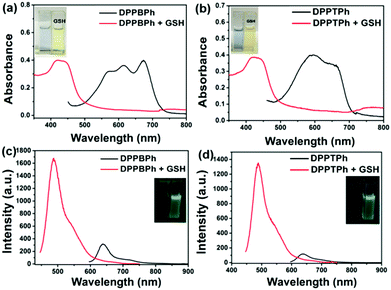
Due to the strong π–π stacking interaction between DPP molecules, they tend to suffer from severe fluorescence quenching in the aggregated state (aggregation caused quenching), which is disadvantageous for fluorescence imaging. Owing to the high GSH concentration in the tumor microenvironment (TME), the –CN of DPPBPh and DPPTPh can be used as the recognition site towards GSH, and lead to the fluorescence “on” state upon reaction with intracellular GSH. To investigate the GSH response property of these two compounds, the absorbance and fluorescence changes were measured before and after addition of GSH. As illustrated in Fig. 3a and b, the color of DPPBPh and DPPTPh changed from blue to yellow after reaction with GSH for 4 h, in accordance with the blue shift of the absorbance. Surprisingly, the fluorescence intensity of DPPBPh and DPPTPh after reaction with GSH was 6 and 8 times higher than that of the original ones, indicating that the two compounds can be used as colorimetric GSH probes to avoid the fluorescence quenching caused by aggregation (Fig. 3c and d). The mechanism can be ascribed to the Michael addition reaction of –SH and –CN groups to form a thiazole.In vitro experiment
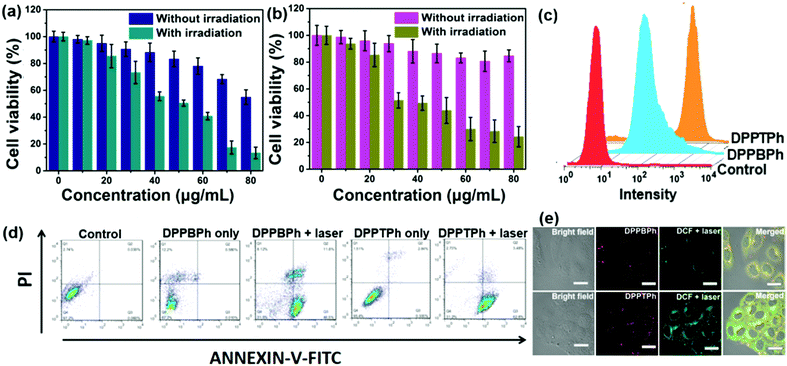
High phototoxicity as well as low dark toxicity is essential for an ideal photosensitizer. As demonstrated by MTT assay, both the DPPBPh NPs and DPPTPh NPs showed negligible cytotoxicity at low concentrations. However, with the increase of concentration, the DPPBPh NPs exhibited relatively higher dark toxicity to cancer cells compared with DPPTPh NPs, which might be due to more –CN groups in DPPBPh NPs than in DPPTPh NPs (Fig. 4a and b). DPPTPh NPs could kill cancer cells with higher efficiency than DPPBPh NPs under laser irradiation, resulting from higher 1O2 QY and photothermal conversion efficiency of DPPTPh NPs. Flow cytometry analysis confirmed that the NPs can be uptaken by HeLa cells and the fluorescence intensity of the groups incubated with DPPBPh NPs or DPPTPh NPs is much higher than that of the control group (Fig. 4c). Apoptosis assay after nanoparticle treatment and irradiation (Fig. 4d) confirmed that the apoptosis rates of DPPBPh NPs and DPPTPh NPs were 52.3% and 65.7%, respectively, which is consistent with the MTT assay. A confocal laser scanning microscope (CLSM) was used to investigate the cellular uptake and ROS generation in vitro. Fig. 4e shows that these NPs can be effectively uptaken by HeLa cells by observing the red fluorescence upon excitation at 633 nm. When 2,7-dichlorofluorescein diacetate (DCFH-DA) was added as an ROS probe, strong green fluorescence upon excitation at 488 nm could be observed in the cancer cells incubated with DPPBPh NPs or DPPTPh NPs after laser irradiation, suggesting the excellent ROS generation ability of DPPBPh NPs and DPPTPh NPs.In vivo fluorescence imaging and photothermal imaging
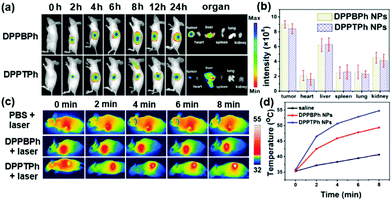
To investigate the tumor accumulation of DPPBPh and DPPTPh NPs in vivo, fluorescence imaging was utilized. HeLa cell xenograft mice were intravenously injected with DPPBPh and DPPTPh NPs (100 μg mL−1, 100 μL), respectively. Distribution of the NP fluorescence was imaged both in vivo and ex vivo. As illustrated in Fig. 5a, the fluorescence intensity gradually increased and reached the maximum at 8 h for DPPBPh NPs and 4 h for DPPTPh NPs, respectively. After 24 h post injection, the fluorescence intensity remained high for both of the two groups. The mice were sacrificed after treatment and the fluorescence intensity of the tumor, heart, liver, spleen, lungs and kidneys were quantitatively measured (Fig. 5b), showing the high tumor accumulation of the NPs via the EPR effect. To investigate the photothermal efficacy of these NPs, the temperature in the tumor site under laser irradiation was recorded by the IR camera. In the control group, the temperature increased from 35.2 to 38.6 °C, while the temperatures of the DPPBPh and DPPTPh NPs groups were increased 12.3 and 19.5 °C, respectively, suggesting the excellent photothermal effect (Fig. 5c and d).Pharmacokinetics analysis and phototherapy
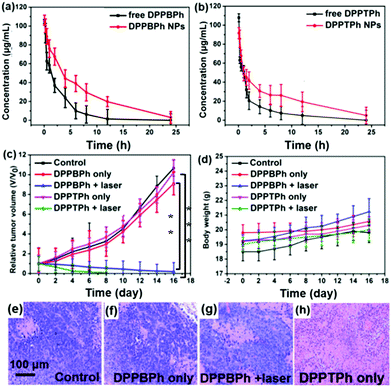
A sensitive and specific ultraviolet spectrophotometer was applied in the pharmacokinetic study of DPPBPh, DPPTPh and the corresponding NPs after intravenous administration. The mean plasma concentration-time profiles of DPPBPh, DPPTPh and their NPs are shown in Fig. 6a. The major pharmacokinetic parameters were calculated by a non-compartmental model and are presented in Table 1.31 The values of the AUC(0–t)/AUC(0–∞) were more than 80%, suggesting that the blood collection time point was suitable for pharmacokinetic studies. The terminal elimination half-life (T1/2) of DPPBPh and DPPTPh were 2.126 and 3.317 h, while that of the corresponding NPs were 6.851 and 7.362 h, respectively. These data showed that the clearance of free drug was more quick than that of the NPs, and DPPTPh NPs could reside longer than DPPBPh (Fig. 6a, b and Table 1). The systematic clearance (CLz) of the free drug for DPPBPh and DPPTPh was 0.039 and 0.023 L h−1 kg−1, respectively. While CLz of the DPPBPh and DPPTPh NPs was 0.014 and 0.008 L h−1 kg−1, respectively, indicating that the NPs were eliminated more slowly than the corresponding free drugs, and DPPBPh NPs eliminated quicker than DPPTPh NPs. All the results suggested that the NPs could extend the residence time in mice as compared with their corresponding free molecules.| Parameter | Free DPPBPh | DPPBPh NPs | Free DPPTPh | DPPTPh NPs |
|---|---|---|---|---|
| T 1/2: terminal elimination half-life; AUC0–t: the area under the curve from zero to the last measurable plasma concentration point; AUC0–∞: the area under the curve from zero to infinity; MRT(0–t): mean residence time; CLz: systemic clearance; VZ: apparent volume of distribution. | ||||
| T 1/2 | 2.126 | 6.851 | 3.317 | 7.362 |
| AUC(0–t) | 249.539 | 662.284 | 193.515 | 536.731 |
| AUC(0–∞) | 253.896 | 720.323 | 216.591 | 591.526 |
| MRT(0–t) | 2.676 | 6.267 | 3.317 | 7.362 |
| V Z | 0.121 | 0.137 | 0.14 | 0.092 |
| CLZ | 0.039 | 0.014 | 0.023 | 0.008 |
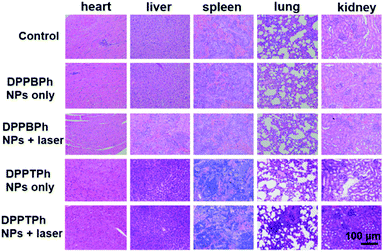
As demonstrated in Fig. 6c, tumor growth was distinctly suppressed in the DPPBPh and DPPTPh NPs groups by laser irradiation. The relative tumor volume is 0.18 for the DPPBPh group with laser irradiation while for the DPPTPh, the tumor growth has been completely inhibited. These results demonstrated that DPPTPh NPs are superior to DPPBPh NPs in terms of phototherapy efficacy. For the no illumination groups, the relative tumor volume of DPPBPh NP treated mice (8.52) is lower than that of the DPPTPh NP group (10.23) and the control group (10.82), showing the higher dark toxicity of DPPBPh but negligible one of DPPTPh at high concentration, which is consistent with the MTT assay. No obvious body weight decay was observed, indicating the good biocompatibility of these NPs (Fig. 6d). After treatment, the mice were sacrificed for H&E staining. The nuclei of the HeLa cells in the control group remain common. However, for the DPPBPh only group (Fig. 6e), a small proportion of the nuclei distorted and those of the irradiation group are severely destroyed (Fig. 6f and g). For the DPPTPh only group, the nuclei resemble those of the control group, suggesting the low dark toxicity of DPPTPh (Fig. 6h). The tumors of the mice in the groups are shown in Fig. S7 (ESI†). Furthermore, the H&E stained photograph of the normal tissues, such as heart, liver, spleen, lungs and kidneys have also been illustrated in Fig. 7. The normal tissues suffer from no damage, showing that these NPs have no side effects on them and the good biosafety.32–41
Conclusions
In summary, we have synthesized two kinds of GSH responsive DPP derivatives, including DPPBPh and DPPTPh, and their corresponding NPs via the nanoprecipitation method for combination cancer phototherapy. The thiol group in GSH can react with the –CN group in DPPBPh and DPPTPh to form thiazole through the Michael addition reaction and recover the quenched fluorescence. In vivo fluorescence imaging reveals that the NPs can target and accumulate in the tumor sites by the EPR effect for GSH responsive turn-on fluorescence imaging. In particular, the DPPTPh NPs, with higher 1O2 QY and photothermal conversion efficiency than DPPBPh NPs, exhibit remarkable efficiency in inhibiting tumor growth without adverse effects. The results provide a new approach to designing novel nanotheranostic agents for fluorescence “turn on” imaging guided PTT and PDT synergistic therapy.Conflicts of interest
There are no conflicts to declare.Acknowledgements
This work was supported by the NNSF of China (61525402, 61775095, 21704043 and 81872255), Jiangsu Provincial key research and development plan (BE2017741), Six talent peak innovation team in Jiangsu Province (TD-SWYY-009 and WSW041), the NSF of Jiangsu Province (BK20170990 and 17KJB150020), and Key medical talents fund of Jiangsu Province (2016KJQWZDRC-03).Notes and references
- W. P. Fan, P. Huang and X. Y. Chen, Chem. Soc. Rev., 2016, 45, 6488–6519 RSC.
- Y. J. Liu, P. Bhattarai, Z. F. Dai and X. Y. Chen, Chem. Soc. Rev., 2019, 48, 2053–2108 RSC.
- J. H. Zou, Z. H. Yin, K. K. Ding, Q. Y. Tang, J. W. Li, W. L. Si, J. J. Shao, Q. Zhang, W. Huang and X. C. Dong, ACS Appl. Mater. Interfaces, 2017, 9, 32475–32481 CrossRef CAS PubMed.
- J. H. Zou, Z. H. Yin, P. Wang, D. P. Chen, J. J. Shao, Q. Zhang, L. G. Sun, W. Huang and X. C. Dong, Chem. Sci., 2018, 9, 2188–2194 RSC.
- S. Y. Ye, J. M. Rao, S. H. Qiu, J. L. Zhao, H. He, Z. L. Yan, T. Yang, Y. B. Deng, H. T. Ke, H. Yang, Y. L. Zhao, Z. Q. Guo and H. B. Chen, Adv. Mater., 2018, 30, 1801216 CrossRef PubMed.
- Y. Y. Yuan, C. J. Zhang, M. Gao, R. Y. Zhang, B. Z. Tang and B. Liu, Angew. Chem., Int. Ed., 2015, 54, 1780–1786 CrossRef CAS PubMed.
- J. H. Zou, P. Wang, Y. Wang, G. Y. Liu, Y. W. Zhang, Q. Zhang, J. J. Shao, W. L. Si, W. Huang and X. C. Dong, Chem. Sci., 2019, 10, 268–276 RSC.
- M. Li, Y. Gao, Y. Y. Yuan, Y. Z. Wu, Z. F. Song, B. Z. Tang, B. Liu and Q. C. Zheng, ACS Nano, 2017, 11, 3922–3932 CrossRef CAS PubMed.
- Z. Yang, W. P. Fan, W. Tang, Z. Y. Shen, Y. L. Dai, J. B. Song, Z. T. Wang, Y. Liu, L. S. Lin, L. L. Shan, Y. J. Liu, O. Jacobson, P. F. Rong, W. Wang and X. Y. Chen, Angew. Chem., Int. Ed., 2018, 57, 14101–14105 CrossRef CAS PubMed.
- C. R. Gordijo, A. Z. Abbasi, M. Ali Amini, H. Y. Lip, A. Maeda, P. Cai, P. J. O'Brien, R. S. DaCosta, A. M. Rauth and X. Y. Wu, Adv. Funct. Mater., 2015, 25, 1858–1872 CrossRef CAS.
- Y. Cai, Q. Y. Tang, X. J. Wu, W. L. Si, Q. Zhang, W. Huang and X. C. Dong, ACS Appl. Mater. Interfaces, 2016, 8, 10737–10742 CrossRef CAS PubMed.
- Y. Cai, Q. Y. Tang, X. J. Wu, W. L. Si, W. Huang, Q. Zhang and X. C. Dong, ChemistrySelect, 2016, 12, 3071–3074 CrossRef.
- Z. W. Wei, M. Wu, S. Y. Lan, J. Li, X. L. Zhang, D. Zhang, X. L. Liu and J. F. Liu, Chem. Commun., 2018, 54, 13599–13602 RSC.
- J. Wang, Y. D. Hang, H. Q. Tan, T. Jiang, X. Qu and J. L. Hua, J. Photochem. Photobiol., A, 2017, 346, 265–272 CrossRef CAS.
- Y. Cai, P. P. Liang, Q. Y. Tang, X. Y. Yang, W. L. Si, W. Huang, Q. Zhang and X. C. Dong, ACS Nano, 2017, 11, 1054–1106 CrossRef CAS PubMed.
- X. Chen, Y. Zhou, X. Peng and J. Yoon, Chem. Soc. Rev., 2010, 39, 2120–2135 RSC.
- B. Tang, L. Yin, X. Wang, Z. Chen, L. Tong and K. Xu, Chem. Commun., 2009, 5293–5295 RSC.
- H. Guo, Y. Jing, X. Yuan, S. Ji, J. Zhao, X. Li and Y. Kan, Org. Biomol. Chem., 2011, 9, 3844–3853 RSC.
- J. Shao, H. Guo, S. Ji and J. Zhao, Biosens. Bioelectron., 2011, 26, 3012–3017 CrossRef CAS PubMed.
- S. Ji, J. Yang, Q. Yang, S. Liu, M. Chen and J. Zhao, J. Org. Chem., 2009, 74, 4855–4865 CrossRef CAS PubMed.
- S. Ji, H. Guo, X. Yuan, X. Li, H. Ding, P. Gao, C. Zhao, W. Wu, W. Wu. and J. Zhao, Org. Lett., 2010, 12, 2876–2879 CrossRef CAS PubMed.
- W. Lin, L. Long, L. Yuan, Z. Cao, B. Chen and W. Tan, Org. Lett., 2008, 10, 5577–5580 CrossRef CAS PubMed.
- J. Bouffard, Y. Kim, T. M. Swager, R. Weissleder and S. A. Hilderbrand, Org. Lett., 2008, 10, 37–40 CrossRef CAS PubMed.
- R. Zhang, X. Yu, Z. Ye, G. Wang, W. Zhang and J. Yuan, Inorg. Chem., 2010, 49, 7898–7903 CrossRef CAS PubMed.
- L. Xiong, Q. Zhao, H. Chen, Y. Wu, Z. Dong, Z. Zhou and F. Li, Inorg. Chem., 2010, 49, 6402–6408 CrossRef CAS PubMed.
- X. Chen, S. Ko, M. J. Kim, I. Shin and J. Yoon, Chem. Commun., 2010, 46, 2751–2753 RSC.
- H. Li, J. Fan, J. Wang, M. Tian, J. Du, S. Sun, P. Sun and X. Peng, Chem. Commun., 2009, 5904–5906 RSC.
- X. Li, S. Qian, Q. He, B. Yang, J. Li and Y. Hu, Org. Biomol. Chem., 2010, 8, 3627–3630 RSC.
- T. Matsumoto, Y. Urano, T. Shoda, H. Kojima and T. Nagano, Org. Lett., 2007, 9, 3375–3377 CrossRef CAS PubMed.
- L. Deng, W. T. Wu, H. M. Guo, J. Z. Zhao, S. M. Ji, X. Zhang, X. L. Yuan and C. L. Zhang, J. Org. Chem., 2011, 76, 9294–9304 CrossRef CAS PubMed.
- J. Zhu, B. Xue, B. Ma, Q. Zhang, M. Liu, L. Liu, D. Yao, H. Qi, Y. Wang, H. Ying and Z. Wu, J. Chromatogr. B: Anal. Technol. Biomed. Life Sci., 2015, 993, 47–59 CrossRef PubMed.
- Z. Yang, R. Tian, J. Wu, Q. L. Fan, B. C. Yung, G. Niu, O. Jacobson, Z. T. Wang, G. Liu, G. Yu, W. Huang, J. B. Song and X. Y. Chen, ACS Nano, 2017, 11, 4247–4255 CrossRef CAS PubMed.
- B. B. Gu, W. B. Wu, G. X. Xu, G. X. Feng, F. Yin, P. H. Joo Chong, J. L. Qu, K. T. Yong and B. Liu, Adv. Mater., 2017, 1701076 CrossRef PubMed.
- J. Shen, J. J. Chen, Z. Ke, D. F. Zou, L. G. Sun and J. H. Zou, Mater. Chem. Front., 2019, 3, 1123–1127 RSC.
- L. Huang, Z. J. Li, Y. Zhao, J. Y. Yang, Y. C. Yang, A. I. Pendharkar, Y. W. Zhang, S. Kelmar, L. Y. Chen, W. T. Wu, J. Z. Zhao and G. Han, Adv. Mater., 2017, 29, 1604789 CrossRef PubMed.
- C. J. Zhang, G. X. Feng, S. D. Xu, Z. S. Zhu, X. M. Lu, J. Wu and B. Liu, Angew. Chem., Int. Ed., 2016, 55, 6192–6196 CrossRef CAS PubMed.
- W. Sun, S. Y. Li, B. Häupler, J. Liu, S. B. Jin, W. Steffen, U. S. Schubert, H. J. Butt, X. J. Liang and S. Wu, Adv. Mater., 2017, 29, 1603702 CrossRef PubMed.
- Z. Yang, Y. L. Dai, C. Yin, Q. L. Fan, W. Zhang, J. B. Song, G. C. Yu, W. Tang, W. P. Fan, B. C. Yung, J. Li, X. Li, X. Li, Y. Tang, W. Huang, J. B. Song and X. Y. Chen, Adv. Mater., 2018, 30, 1707509 CrossRef PubMed.
- J. Yang, X. Q. Gu, W. T. Su, X. Y. Hao, Y. J. Shi, L. Y. Zhao, D. F. Zou, G. W. Yang, Q. Y. Li and J. H. Zou, Mater. Chem. Front., 2018, 2, 1842–1846 RSC.
- Z. Yang, J. B. Song, W. Tang, W. P. Fan, Y. L. Dai, Z. Y. Shen, L. S. Lin, S. Cheng, Y. Liu, G. Niu, P. Rong, W. Wang and X. Y. Chen, Theranostics, 2019, 9, 526 CrossRef CAS PubMed.
- Z. Yang, Y. L. Dai, L. Shan, Z. Y. Shen, Z. T. Wang, B. C. Yung, O. Jacobson, Y. Liu, W. Tang, S. Wang, L. S. Lin, G. Niu, P. Huang and X. Y. Chen, Nanoscale Horiz., 2019, 4, 426–433 RSC.
Footnote |
| † Electronic supplementary information (ESI) available. See DOI: 10.1039/c9qm00471h |
| This journal is © the Partner Organisations 2019 |

![[thin space (1/6-em)]](https://www.rsc.org/images/entities/char_2009.gif)
