 Open Access Article
Employing a novel O3/H2O2 + BiPO4/UV synergy technique to deal with thiourea-containing photovoltaic wastewater†
Zhikai Wei,
Peng Li,
Muhammad Hassan,
Pu Wang,
Cong Xu,
Long-Fei Ren and
Yiliang He *
*
School of Environmental Science and Engineering, Shanghai Jiao Tong University, 800 Dongchuan Road, 200240 Shanghai, PR China. E-mail: ylhe@sjtu.edu.cn; Tel: +86 21-54744008
First published on 2nd January 2019
Abstract
Photovoltaic wastewater contains a large amount of thiourea that cannot be directly treated by biological methods because of its biotoxicity. In this study, a novel O3/H2O2 + BiPO4/UV synergy technique was used as a pre-treatment process to degrade thiourea. The effects of H2O2 and catalyst loading were investigated, and the transformation pathway of thiourea was predicted based on the intermediates detected by UPLC-Vion-IMS-QToF. The synergy technique degraded 89.14% thiourea within only 30 min, and complete degradation occurred after 150 min. The TOC removal of O3/H2O2 + BiPO4/UV was 1.8, 1.5, and 1.9 times that of O3/H2O2 and BiPO4/UV/H2O2 single processes and O3/H2O2 + UV process, respectively, which was due to the synergy between H2O2 residues and BiPO4. In addition, thiourea was mainly degraded by ·OH into thiourea dioxide and melamine (polymerized by other intermediates) and then further degraded into biuret and methyl carbamate by the holes of BiPO4, followed by complete mineralization into H2O and CO2. These results confirm that the O3/H2O2 + BiPO4/UV synergy technique is a promising option for the degradation of thiourea.
1. Introduction
Thiourea is widely used in numerous industries,1–4 especially in the photovoltaic industry. It is used in chemical bath deposition to produce CdS polycrystalline films for thin-film solar cells.5 Hence, wastewater from photovoltaic plants contains a large amount of redundant thiourea. It degrades slowly in the natural environment and has serious effects on human health.6–8 Due to the biological toxicity of thiourea,9 it cannot be treated directly by biological methods. Advanced oxidation processes (AOPs) can be an alternative method for the pre-treatment of photovoltaic wastewater containing high concentration of thiourea, transforming thiourea into other substances without biotoxicity.Considering that photovoltaic wastewater contains high concentrations of organic matter and salts, the process we use cannot further introduce excess salt as it will be over-discharged. An O3/H2O2 Fenton-like process was selected as it generates extraordinarily reactive hydroxyl radicals (·OH) by the reaction of ozone and hydrogen peroxide without salt introduction. These radicals subsequently attack and decompose contaminants in the water, and the process is usually effective, simple, environment-friendly and economically sustainable. The O3/H2O2 method enables rapid degradation of various recalcitrant organic compounds such as perfluorinated chemicals, dibutylsulfide, dimethyl sulfoxide, phenol and linear alkyl benzene.10–14 However, using H2O2 alone in the O3/H2O2 process is not sufficient as excess H2O2 residues not only affect the degradation efficiency but also increase COD of the water sample and affect the post-treatment process.15
Some studies have improved the utilization efficiency of H2O2 residues by employing photo-irradiation.16 Nevertheless, ·OH generated by UV or O3/H2O2 is inferior in organic mineralization as ·OH tends to abstract hydrogen from C–H bonds or add hydrogen to unsaturated carbon–sulfur bonds; if these bonds are not present (e.g., oxalic acid, which is one of the intermediates in the degradation of phenol17), the oxidation ability of ·OH will be limited. A photocatalyst, namely, bismuth phosphate (BiPO4) is considered an alternative as it can generate holes, which enhance the mineralization efficiency. It has been proven to be an efficient catalyst and has an optical indirect band gap of 3.85 eV. The photocatalytic activity of BiPO4 is twice that of titanium dioxide (TiO2 P25, Degussa).18 BiPO4 possesses excellent photocatalytic activity due to the inductive effect of PO43− since it can separate electrons and holes. BiPO4 has been applied for the removal of dyes18 and phenols.19 BiPO4 not only improves the mineralization efficiency but also has a synergistic effect with H2O2. In a previous study, BiPO4 coupled with 60 mg L−1 H2O2 significantly improved the degradation efficiency of phenol20. Adequate H2O2 interacted with BiPO4, improving the photocatalytic efficiency of BiPO4 by increasing the separation efficiency of e− and h+ through the capture of e− by H2O2. Based on these facts, the O3/H2O2 + BiPO4/UV synergy technique was developed in this study. We hypothesize that H2O2 residues after O3/H2O2 treatment will be utilized by BiPO4/UV, which is a novel approach.
In this study, we report the improvement in thiourea transformation efficiency and TOC removal by using the O3/H2O2 + BiPO4/UV synergy technique coupled with the investigation of the utilization efficiency of residual H2O2. We have also investigated the effects of H2O2 concentration and catalyst loading. The possible transformation pathway of thiourea is predicted in the end.
2. Material and methods
2.1 Solution preparation
Synthetic solutions were prepared using 18.2 MΩ cm Milli-Q deionized water. All the reagents used were of analytical grade. Thiourea was supplied by Aladdin (USA), ammonium chloride by Sinopharm Chemical reagent Co., Ltd. (China) and hydrogen peroxide (30% w/v) by Macklin (USA). For residual H2O2 test, potassium titanyl oxalate was purchased from Macklin (USA). Thiourea (1.2 g) and ammonium chloride (0.535 g) (as the source of ammonium nitrogen) were added into 1 L of deionized distilled water to simulate photovoltaic wastewater.2.2 Preparation of BiPO4
BiPO4 nanorods were prepared via the reflux method.21 In short, 1.956 g of Bi(NO3)3·5H2O (AR, Macklin) and 3.145 g of NaH2PO4·2H2O (AR, Macklin) were added into a flask, followed by mixing with at least 750 mL of deionized water. After the pH was adjusted to 2.2 with concentrated nitric acid (Sinopharm Chemical reagent Co., Ltd.), the flask was placed in an oil bath (120 °C) and mixing was conducted at 800 rpm, followed by heating for 48 hours. The resultant white precipitate was washed three times with deionized water and dried at 120 °C for 12 hours.2.3 Experimental set-up and procedure
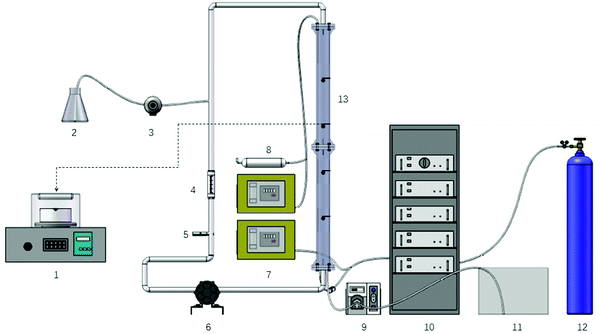
O3/H2O2 + BiPO4/UV synergy technique. O3/H2O2 + BiPO4/UV synergy technique was carried out in the self-designed setup (Fig. 1). The optimum conditions for maximizing the TOC residues and specifying the hydrogen peroxide residues of O3/H2O2 treatment were determined by means of a three-factor three-level Box–Behnken experimental design (BBD) combined with the response surface methodology (RSM) to correlate experimentally obtained criteria and experimental conditions given by the Box–Behnken experimental design. The independent variables were the initial concentrations of H2O2 (X1) and O3 (X2) and the initial pH (X3), which were coded as −1, 0 and +1, as shown in Table 1.
| Independent variable | Symbol | Code levels | ||
|---|---|---|---|---|
| −1 | 0 | 1 | ||
| H2O2 (mL) | X1 | 10 | 45 | 80 |
| O3 (mg L−1) | X2 | 20 | 50 | 80 |
| pH | X3 | 4 | 7 | 10 |
The total number of experimental trials was 17 based on a three level and a three factor experimental design with three replicates at the centre of the design to estimate a pure error sum of squares. TOC residues, H2O2 residues and the ‘pseudo’-second order rate constant were considered as dependent factors (process responses). Specific experimental conditions of the O3/H2O2 treatment were selected according to the reaction model generated by BBD. The experimental conditions could achieve the desired reaction results of the O3/H2O2 treatment process. After 150 min of the O3/H2O2 treatment, the treated effluent (100 mL) was transferred into a low-pressure (LP) UV collimated beam system with a specific amount of BiPO4 after stirring and ultrasonicating for 10 min before irradiation. The UV intensity was 4.73 mW cm−2 in average and the BiPO4/UV post-treatment lasted for 180 minutes.
O3/H2O2 + UV process. The experimental procedure of the O3/H2O2 + UV process was similar to that of the O3/H2O2 + BiPO4/UV synergy technique. Experimental conditions of the O3/H2O2 treatment were also selected according to the reaction model generated by BBD. The conditions were the same as that of the O3/H2O2 + BiPO4/UV synergy technique to compare their mineralization efficiencies. However, BiPO4 was not added in the post-treatment process. Samples were directly transferred into the LP UV collimated beam system.
O3/H2O2 single-process. The initial experimental conditions and the procedures of the O3/H2O2 single-process were the same as those of the O3/H2O2 + BiPO4/UV synergy technique; however, there was no post-treatment in this process. The O3/H2O2 treatment was sustained for 330 minutes.
BiPO4/UV/H2O2 process. BiPO4/UV/H2O2 process was carried out in the LP UV collimated beam system in the same manner as before. The initial amounts of H2O2 and BiPO4 loadings were equal to those used in the O3/H2O2 + BiPO4/UV synergy technique. A specific amount of BiPO4 was added after agitation and ultrasonication for 10 min before irradiation. The experiment was continued for 330 minutes.
A water sample (3 mL) was taken every 30 minutes from the reactor in each experiment mentioned above to analyse the TOC concentration and H2O2 residues. Moreover, three replicates were made for each analytical measurement.
2.4 Analytical methods
The concentration of thiourea was analyzed by a HPLC system (Agilent 6120B, USA) equipped with a multi-wavelength UV detector (ESI, Text S1†). TOC was monitored with a Multi N/C 3100 TOC/TN analyzer. H2O2 was measured by a spectrophotometric method22 using a HACH DR6000 UV-vis spectrophotometer. Ammonium nitrogen was determined by salicylic acid spectrophotometry (HJ 536-2009 in China). Nitrate nitrogen, sulfate and chloridion were determined by ion chromatography (Metrohm 820 IC). The morphology and the structure of the BiPO4 photocatalyst were examined with a scanning electron microscope (SEM) and powder X-ray diffraction (XRD). The Brunauer Emmett Teller (BET) specific surface area and the pore size distribution of the BiPO4 photocatalyst were characterized by nitrogen adsorption at 77 K with Micromeritics 3020. The degradation by-products of thiourea were analysed via high resolution mass spectrometry analysis carried out on Water I-Class Acquity UPLC (Waters, UK) coupled with Vion IMS QToF (Waters, UK) (ESI, Text S2†).3. Results and discussion
3.1 Experimental design and condition selection
The Box–Behnken statistical experiment design was employed to investigate the effects of three independent variables on the TOC and H2O2 residues as response functions. Table 2 depicts the three-factor three-level Box–Behnken experimental design and the observed and predicted values for the TOC and H2O2 residues by the developed quadratic model.| Run | Independent code variables | TOC | H2O2 | ||||
|---|---|---|---|---|---|---|---|
| H2O2 | O3 | pH | Observed | Predicted | Observed | Predicted | |
| 1 | 1 | 0 | −1 | 173.4 | 173.4 | 1046.9 | 1053 |
| 2 | −1 | −1 | 0 | 179.2 | 177.4 | 2.22 | 0.86 |
| 3 | −1 | 0 | −1 | 175 | 176.9 | 9.93 | 0.86 |
| 4 | 0 | 0 | 0 | 175.6 | 168.2 | 442.27 | 416.51 |
| 5 | 0 | −1 | 1 | 172.8 | 174.4 | 316.08 | 329.84 |
| 6 | 1 | 1 | 0 | 160.2 | 161.8 | 855.02 | 862.77 |
| 7 | 0 | 0 | 0 | 168.8 | 168.2 | 415.98 | 416.51 |
| 8 | 0 | 1 | −1 | 175.6 | 174 | 350.26 | 336.5 |
| 9 | 0 | −1 | −1 | 175 | 174.7 | 389.69 | 410.97 |
| 10 | −1 | 0 | 1 | 182.4 | 182.2 | 0.86 | 0.86 |
| 11 | 0 | 1 | 1 | 167.6 | 167.9 | 242.47 | 221.18 |
| 12 | 0 | 0 | 0 | 166.2 | 168.2 | 405.46 | 416.51 |
| 13 | 0 | 0 | 0 | 164.8 | 168.2 | 392.32 | 416.51 |
| 14 | 1 | 0 | 1 | 163.4 | 161.6 | 844.51 | 858.04 |
| 15 | 1 | −1 | 0 | 157 | 157.3 | 1120.6 | 1093.3 |
| 16 | 0 | 0 | 0 | 165.4 | 168.2 | 426.5 | 416.51 |
| 17 | −1 | 1 | 0 | 166 | 165.8 | 14.53 | 41.82 |
As mentioned before, RSM was used to estimate the parameters, indicating an empirical relationship between the input variables and the response, as shown in eqn (1) and (2). The quadratic model equation for predicting the response function (TOC, H2O2 residues) could be expressed by the following second-order polynomial equation in terms of the coded factors:
| Y = 168.16 − 6.07X1 − 1.82X2 − 1.60X3 + 4.10X1X2 − 4.35X1X3 − 1.45X2X3 − 0.88X12 − 1.68X22 + 6.27X32 | (1) |
| Z = 416.51 + 479.94X1 − 45.78X2 − 49.11X3 − 69.46X1X2 − 48.34X1X3 − 8.54X2X3 + 116.26X12 − 34.68X22 − 57.20X32 | (2) |
Here, Y and Z are the predicted responses for TOC and H2O2 residues, and X1, X2 and X3 are the independent variables.
The statistical significance of the second-order polynomial model to predict the TOC and H2O2 residues was tested by the analysis of variance (ANOVA). The results of ANOVA are presented in Table S1 and Table S2 (ESI, Table S1 and S2†). The significance of each coefficient in eqn (1) and (2) was determined by the Fisher's F-test and the values of probability were greater than F.
A small probability value (p <0.0001) indicated that the model was highly significant. The goodness of fit of the model was validated by the determination coefficient (R2). In this case, R2 values were 0.99758 and 0.874188, which showed high significance of the model. Also, the adequate precision greater than 4 (54.69 and 8.84 in this case) showed that the model could be used to navigate the design space defined by BBD. Adequate precision is a measure of the range in the predicted response relative to its associated error. The normality of data can be checked through the high correlation between observed and predicted data shown in Fig. S3 (ESI, Fig. S3†), which indicates their low discrepancies.
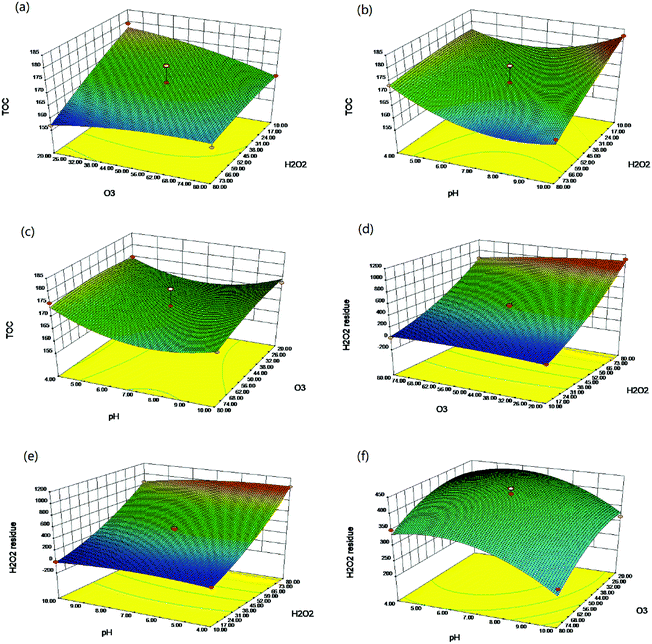
To study the interaction effects between the variables (initial concentration of polymer, initial concentration of H2O2, pH and recirculation rate), the 3D response surface and 2D contour curves based on the quadratic model were plotted, as shown in Fig. 2(a–f).
As illustrated in Fig. 2(a–f), TOC was significantly affected by the initial H2O2 dosage and O3 concentration. It can be seen that TOC decreased with increasing H2O2 dosage and O3 concentration. The effects of the initial H2O2 dosage and the O3 concentration are mainly due to the generation of ·OH by H2O2 and O3. The more the ·OH, the higher the mineralization efficiency. Also, it can be seen that minimum TOC is achieved at pH of 7. In alkaline solutions, the dissociated form of hydrogen peroxide (HO2−) reacts with ·OH more than 2 orders of magnitude faster than hydrogen peroxide.23 Therefore, the oxidation efficiency decreases as ·OH species are consumed. However, in acidic solutions, thiourea is stable and relatively hard to be mineralized. As for the amount of H2O2 residues, data are illustrated from Fig. 2(d)–(f). The initial H2O2 dosage is the main factor that influences the amount of H2O2 residues; however, the influence of pH and O3 concentration is much less pronounced than that of the initial H2O2 dosage. This is also confirmed in Table S2,† which shows the significance of the factors and their interaction.
To investigate the mineralization and degradation efficiency of the O3/H2O2 + BiPO4/UV synergy technique, we chose the initial experimental conditions of O3/H2O2 treatment based on the quadratic model equation calculated by BBD. According to these equations, specific experimental conditions were selected to achieve the maximum mineralization efficiency of thiourea under a targeted amount of H2O2 residues. In this experiment, we set the experimental conditions to obtain 70 mg L−1 H2O2 residues from the O3/H2O2 treatment with the maximum mineralization efficiency. According to this target, the ozone concentration was set at 55.71 mg L−1, the initial concentration of H2O2 was 435 mg L−1, and the initial pH value was 9.20.
3.2 Comparison of mineralization efficiencies among different treatment processes
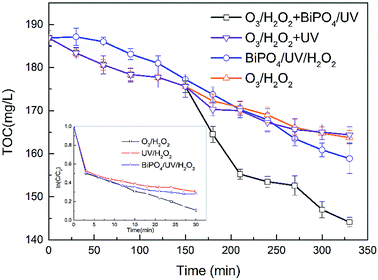
In this study, degradation efficiencies were compared among different treatment processes. As observed in Fig. 3, 89.14% of thiourea was degraded by O3/H2O2 within only 30 minutes. The chemical construction of thiourea includes a double bond between carbon and sulfur. It can be easily oxidized by an oxidizing agent, especially by strong oxidants such as ozone (E0 = 2.07 eV), hydrogen peroxide (E0 = 1.28 eV) and hydroxyl radicals (E0 = 2.8 eV). The ·OH species generated by O3/H2O2 as well as O3 and H2O2 oxidize thiourea into other products, which may contribute to the degradation of thiourea. The degradation efficiency of thiourea by UV/H2O2 and BiPO4/UV/H2O2 processes was also investigated and compared with that of O3/H2O2. In only 30 minutes of reaction time, 69.35% and 71.90% of thiourea were degraded by UV/H2O2 and BiPO4/UV/H2O2, respectively, which were much lower than the value obtained for O3/H2O2. The lower degradation efficiency might be due to the absence of O3 in the process, which reduced their oxidizability.The O3/H2O2 process only reduced 23.125 mg L−1 TOC, whereas O3/H2O2 + UV achieved TOC reduction of 22.5 mg L−1; also, the performance of the BiPO4/UV/H2O2 single-process was much lower than that of the O3/H2O2 + BiPO4/UV synergy technique. Nevertheless, Fig. 3 shows that the O3/H2O2 single-process achieved more TOC removal in the first half of the treatment process than the BiPO4/UV/H2O2 single-process; however, in the second half, the TOC removal rate of the O3/H2O2 single-process was exceeded by that of the BiPO4/UV/H2O2 single-process. Based on this phenomenon, the O3/H2O2 + BiPO4/UV synergy technique was applied to exert higher TOC removal and generate synergy effect. The amount of TOC removal by the O3/H2O2 + BiPO4/UV synergy technique was 1.8 and 1.5 times higher than that of the O3/H2O2 single-process and the BiPO4/UV/H2O2 single-process, respectively. Also, the TOC removal was much higher than that without BiPO4 addition, which was 1.9 times that of the O3/H2O2 + UV process. This is mainly due to two factors. The first factor is the synergy between BiPO4 and H2O2 residues from O3/H2O2. The H2O2 residues from O3/H2O2 are not wasted, and they further generate ·OH through UV irradiation; H2O2 residues can also capture e− generated in BiPO4, which can increase the separation efficiency of e− and h+.20 Also, a part of H2O2 is utilized in O3/H2O2; thus, we can avoid the negative effect on the synergy between BiPO4 and H2O2 due to excess H2O2. In BiPO4/UV/H2O2 single-process, excess H2O2 shows inhibition of the synergy between BiPO4 and H2O2; it can occupy the holes in BiPO4 but cannot improve the separation efficiency of e− and h+. Thus, the TOC removal of the BiPO4/UV/H2O2 single-process is limited. The second factor is the electron transfer oxidation of holes. ·OH tends to abstract hydrogen from C–H bonds or add hydrogen to unsaturated carbon–sulfur bonds; thus, it is superior in thiourea degradation but inferior in further mineralization. As for O3/H2O2, it can only generate ·OH that is inferior in mineralization; thus, the amount of TOC removal is much lower than that of the processes containing BiPO4. In contrast, BiPO4 in BiPO4/UV can generate holes that can directly mineralize the by-products of O3/H2O2.
3.3 Comparison of H2O2 utilization among different treatment processes
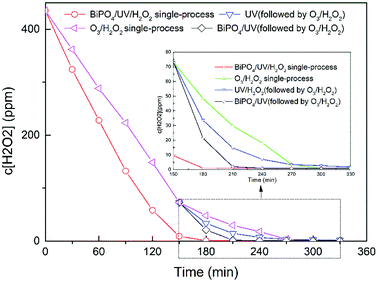
The O3/H2O2 + BiPO4/UV synergy technique could greatly improve the utilization efficiency of hydrogen peroxide, especially in the BiPO4/UV process, as shown in Fig. 4. After the treatment of O3/H2O2, about 70 mg L−1 hydrogen peroxide was retained, which could be utilized by BiPO4 photocatalysis in less than 1 h. The O3/H2O2 single-process and O3/H2O2 + UV needed more than 2 and 3 hours to consume hydrogen peroxide residues. Even though the consumption rate of hydrogen peroxide was higher in the BiPO4/UV/H2O2 single-process, the TOC removal rate of thiourea was 15%, as mentioned before, which was much lower than that of the O3/H2O2 + BiPO4/UV synergy technique. It has been proven that hydroxide radicals are quenched by additional hydrogen peroxide species;24,25 thus, the hydroxide radicals generated in BiPO4/UV/H2O2 single-process were not attached to thiourea but were consumed by extra H2O2 according to equation:26| H2O2 + ·OH → H2O + HO2. | (3) |
Therefore, excess H2O2 could lead to the consumption of active oxidizing hydroxyl radicals by a reaction other than the thiourea mineralization reaction, consequently reducing the rate of the latter reaction and wasting considerable H2O2 reagent.
In the O3/H2O2 + BiPO4/UV synergy technique, it is believed that H2O2 generates more ·OH in BiPO4/UV because of the synergy between BiPO4 and H2O2. Electron spin resonance (ESR) was carried out to investigate the hydroxyl radicals generated by H2O2, BiPO4 or both BiPO4 and H2O2 under UV irradiation. We measured hydroxyl radicals by ESR using DMPO as the spin-trap reagent. As shown in Fig. 5, the characteristic four peaks of DMPO-·OH with the intensities of 1![[thin space (1/6-em)]](https://www.rsc.org/images/entities/char_2009.gif) :
:![[thin space (1/6-em)]](https://www.rsc.org/images/entities/char_2009.gif) 2
2![[thin space (1/6-em)]](https://www.rsc.org/images/entities/char_2009.gif) :
:![[thin space (1/6-em)]](https://www.rsc.org/images/entities/char_2009.gif) 2
2![[thin space (1/6-em)]](https://www.rsc.org/images/entities/char_2009.gif) :
:![[thin space (1/6-em)]](https://www.rsc.org/images/entities/char_2009.gif) 1 appeared in all spectra. The intensity of ·OH generated in BiPO4 after the addition of 70 mg L−1 hydrogen peroxide was much higher than that in the H2O2 system and BiPO4 system. The result was in accordance with that of Elmolla's research.27 As an electron scavenger, H2O2 can react with e−, as shown in the following equation:
1 appeared in all spectra. The intensity of ·OH generated in BiPO4 after the addition of 70 mg L−1 hydrogen peroxide was much higher than that in the H2O2 system and BiPO4 system. The result was in accordance with that of Elmolla's research.27 As an electron scavenger, H2O2 can react with e−, as shown in the following equation:
| H2O2 + 2e− → ·OH + OH− | (4) |
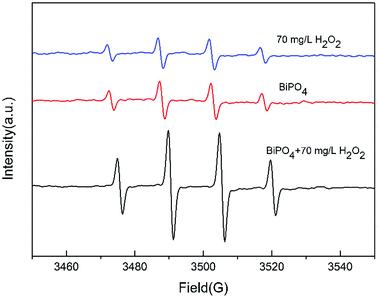 | ||
| Fig. 5 DMPO spin-trapping ESR spectra under UV irradiation for 2 min at room temperature water in the presence of BiPO4, H2O2 or both BiPO4 and H2O2. | ||
As explained before, an appropriate amount of H2O2 will capture the electrons in BiPO4, increasing the separation efficiency of e− and h+. This reaction also motivates H2O2 to generate ·OH. As a result, the electron capture process combined with the UV irradiation process increases ·OH generation; thus, it accelerates the consumption rate of residual H2O2 from O3/H2O2 treatment. Also, more ·OH generation indicates less residual H2O2, and it will change the ratio of ·OH and H2O2; thus, ·OH scavenge reaction will be limited and H2O2 will be used efficiently. Nonetheless, the residual H2O2 from O3/H2O2 not only increases the separation of e− and h+ in BiPO4, but also results in ·OH generation. Thus, high degradation of thiourea by O3/H2O2 and residual H2O2 is efficiently utilized by the synergy between H2O2 and BiPO4, attaining faster H2O2 consumption and higher TOC removal.
3.4 Effect of hydrogen peroxide
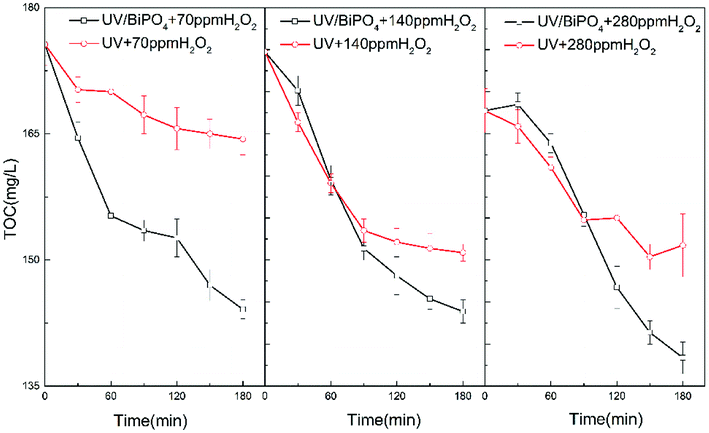
To investigate the effect of H2O2, different concentrations of H2O2 were employed in the O3/H2O2 + BiPO4/UV synergy technique. Based on the BBD model introduced before, we could predict the amount of residual H2O2 of O3/H2O2 under different H2O2 concentrations. We set 70 mg L−1, 140 mg L−1 and 280 mg L−1 as target H2O2 residues; 17.34 mL, 22.09 mL and 47.63 mL H2O2 were selected as initial concentrations.Table 3 shows various experimental parameters. Under these treatment conditions, we compared the TOC removal rates between BiPO4/UV and UV after the treatment of O3/H2O2. Fig. 6(a) shows that BiPO4 can significantly improve TOC removal under about 70 mg L−1 residual H2O2. The TOC removal was 2.8 times that of the treatment without BiPO4 addition. However, along with the increase in residual H2O2, the mineralization ability of BiPO4/UV was inhibited. We can see from Fig. 6(b) and (c) that the mineralization efficiency of BiPO4/UV was lower than that of the treatment without the BiPO4 addition in the initial 60 and 90 minutes. This phenomenon can be explained by the following equation:28
| H2O2 + 2h+ → O2 + 2H+ | (5) |
| Run | Independent code variables | TOC | H2O2 | ||||
|---|---|---|---|---|---|---|---|
| H2O2 (mL) | O3 (mg L−1) | pH | Observed | Predicted | Observed | Predicted | |
| 1 | 17.3 | 57.71 | 9.2 | 175.63 | 178 | 74.47 | 70 |
| 2 | 22.1 | 62.88 | 7.5 | 174.75 | 172 | 138.10 | 140 |
| 3 | 47.6 | 77.10 | 9.7 | 167.75 | 169 | 239.53 | 280 |
Excess H2O2 might be absorbed on the surface of the BiPO4 photocatalyst and can react with the holes on the surface of the catalyst. Since holes govern the mineralization efficiency of thiourea, consumption of holes by the absorbed H2O2 can result in retarded photocatalytic mineralization efficiency of thiourea. Also, excessive H2O2 can counteract the synergy between H2O2 residues and BiPO4 photocatalyst. Excessive H2O2 may scavenge the holes as well as ·OH generated by e− and H2O2. Thus, adequate H2O2 can improve the synergy between residual H2O2 and BiPO4, but superfluous H2O2 may cause negative effects and lead to the decline in the mineralization efficiency of the O3/H2O2 + BiPO4/UV synergy technique.
As shown in Fig. 7, we also investigated the residual H2O2 consumption rate by BiPO4/UV under conditions described in Table 3. The consumption rate of residual H2O2 by UV was calculated under 70 mg L−1, 140 mg L−1 and 280 mg L−1 H2O2 concentrations, which conformed to pseudo first order reaction kinetics (eqn (6)):
 | (6) |
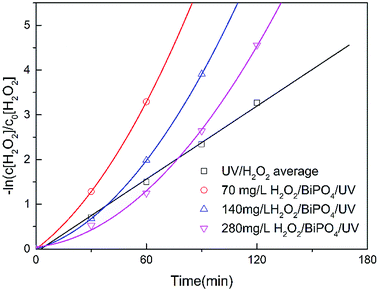 | ||
| Fig. 7 The consumption rate of H2O2 under UV and BiPO4/UV with about 70, 140, 280 mg L−1 H2O2 residues. | ||
Here, k0 is the reaction kinetic constant, c is the intercept, c[H2O2]t is the H2O2 concentration after reaction for different periods, and c[H2O2]0 is the initial H2O2 concentration. The residual H2O2 consumption rates by the BiPO4/UV system with different H2O2 concentrations were fit to eqn (7):
 | (7) |
Here, kp and kj are the coefficients of the BiPO4/UV system with different H2O2 residues, c is the intercept, c[H2O2]t is the H2O2 concentration after reaction for different periods, and c[H2O2]0 is the initial H2O2 concentration.
As shown in Fig. 7, BiPO4 can accelerate H2O2 consumption under 70 mg L−1 of residual H2O2. Nevertheless, along with the increase in residual H2O2 to 140 mg L−1 and 280 mg L−1, BiPO4 inhibited H2O2 consumption at the beginning; however, after the residual H2O2 was partially consumed, the consumption rate was expedited and exceeded the rate of the UV system. This phenomenon shows inactivation of H2O2 in the BiPO4/UV system under high concentrations of H2O2 residues because UV irradiation is first absorbed by the BiPO4 photocatalyst. Under this circumstance, less H2O2 can be driven to generate ·OH, and the consumption amount of H2O2 decreases. Although, e− and h+ on the surface of BiPO4 can consume H2O2 as explained before, considering that the amount of the BiPO4 photocatalyst is constant under these three conditions, the consumption amount of H2O2 does not change. Thus, the consumption rate of H2O2 in BiPO4/UV post-treatment decreases along with the increase in H2O2 concentration. This influences the TOC removal rate of the O3/H2O2 + BiPO4/UV synergy technique and also the utilization efficiency of the H2O2 reagent.
3.5 Effect of photocatalyst loading
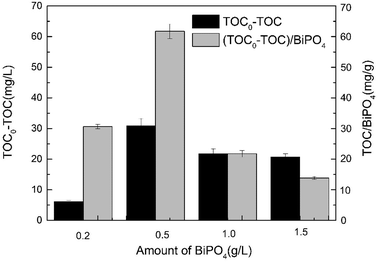
The amount of BiPO4 is another important parameter in the O3/H2O2 + BiPO4/UV synergy technique. To investigate the effect of BiPO4 loading on the TOC removal of thiourea by the O3/H2O2 + BiPO4/UV synergy technique, 0.2 g L−1, 0.5 g L−1, 1.0 g L−1 and 1.5 g L−1 of BiPO4 were loaded in the post-treatment process. We used TOC removal to show the treatment effect and used the ratio between the TOC removal and the BiPO4 loading to show the catalyst efficiency. As shown in Fig. 8, when the amount of BiPO4 was increased from 0.2 g L−1 to 0.5 g L−1, the TOC removal improved from 6.125 mg L−1 to 30.875 mg L−1 and the catalyst efficiency was greatly enhanced. However, upon further increasing the BiPO4 loading to 1.0 g L−1 and 1.5 g L−1, neither the TOC removal nor the catalyst efficiency decreased significantly, revealing negative effect on thiourea mineralization. This phenomenon showed a similar tendency to that reported in other researches:29,30 the mineralization efficiency cannot always increase with the increase in catalyst loading. Many studies have shown that the mineralization efficiency of a photocatalyst is strongly affected by the number of active sites and the photoabsorption ability of the catalyst used.31 Adequate catalyst loading increases the generation rate of e−/h+ pairs; hence, we observe the formation of ·OH for enhancing photodegradation and the formation of holes for enhancing mineralization. However, an excess dosage of the catalyst decreases light penetration via the shielding effect of suspended particles32,33 and thereby reduces the degradation and mineralization rates. Although the O3/H2O2 + BiPO4/UV synergy technique exhibits a synergistic effect between H2O2 and BiPO4, it still cannot avoid the shielding effect. Excess BiPO4 reduces the incident light intensity by reflection despite the large number of active sites present.3.6 Mineralization mechanism of thiourea
To elucidate the degradation pathways of thiourea by the O3/H2O2 + BiPO4/UV synergy technique, the reaction intermediates were detected by UPLC-IM-QTOF-MS (ESI, Fig. S4†); four compounds were identified with peaks of m/z 107 and m/z 126 after O3/H2O2 treatment as well as m/z 102 and m/z 74 after BiPO4/UV treatment. Product 1 was identified as thiourea dioxide with m/z 107, whereas product 2 was identified as melamine with m/z 126. Besides, after the treatment of BiPO4/UV, product 3 was identified as biuret with m/z 102.Based on the analytical intermediates mentioned above, the transformation pathway of thiourea by the O3/H2O2 + BiPO4/UV synergy technique is illustrated in Fig. 9. The first step of the O3/H2O2 treatment mainly contributed to thiourea degradation by hydroxyl radicals together with direct oxidation by hydrogen peroxide and ozone. Thiourea was converted to thiourea dioxide and melamine. We predicted that with further oxidation of hydroxyl radicals, an unstable intermediate was generated and polymerized into melamine immediately.
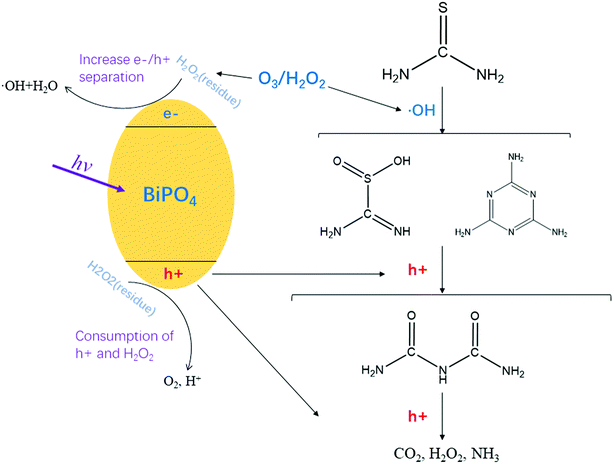 | ||
| Fig. 9 Prediction of mineralization pathway of thiourea by the O3/H2O2 + BiPO4/UV synergy technique. | ||
The mechanism of hydroxyl radicals' oxidation mainly occurred via the following two steps: first, the addition to unsaturated carbon; second, hydrogen abstraction from saturated carbon.34,35 According to this, hydroxyl radicals were weak in melamine mineralization. However, the treatment of BiPO4/UV after O3/H2O2 not only increased the amount of hydroxyl radicals, but also introduced the process of hole mineralization. Thus, after the first step of O3/H2O2, BiPO4/UV served as the second step to generate holes that carried out the electron transfer oxidation36 so that melamine and thiourea dioxide can be further transformed into biuret and then mineralized into H2O and CO2. In addition, the H2O2 residues from O3/H2O2 not only increased the separation of e−/h+ but also induced ·OH generation through the reaction between e− and H2O2; thus, more ·OH species could be generated, which contributed to acceleration of thiourea degradation and mineralization. No thiourea was detected after treatment with the O3/H2O2 + BiPO4/UV synergy technique, and it was transformed into substances introduced before without biotoxicity, which can be further treated by biological methods in a municipal wastewater treatment plant.
4. Conclusions
TOC removal, H2O2 utilization and the transformation pathway of thiourea by the newly invented O3/H2O2 + BiPO4/UV synergy technique was investigated in this study. Higher mineralization and degradation efficiency of thiourea was attained compared with that of O3/H2O2 and BiPO4/UV/H2O2 single-processes and O3/H2O2 + UV process. Thiourea could be completely transformed into substances without biotoxicity. The synergy between H2O2 and BiPO4 improved the TOC removal and also the utilization of residual H2O2 left from the O3/H2O2 treatment. H2O2 captured e− on BiPO4, which increased the separation of e− and h+ and generated more ·OH in a shorter period. The amount of added H2O2 influenced both O3/H2O2 and BiPO4/UV steps, especially BiPO4/UV, because the addition of excess H2O2 tended to generate more residual H2O2, which influenced the synergy between H2O2 and BiPO4 and decreased the amount of TOC removal. Excessive catalyst loading showed a negative effect on the mineralization efficiency. O3/H2O2 mainly degraded thiourea into thiourea dioxide and melamine by ·OH, and BiPO4/UV degraded them into biuret and methyl carbamate, followed by their further mineralization into CO2 and H2O.Conflicts of interest
The authors have no conflicts of interest to declare.Acknowledgements
We greatly acknowledge the financial support from the National Science and Technology Major Projects of Water Pollution Control and Management of China (2014ZX07206001).References
- P. Manivel, K. Prabakaran, V. Krishnakumar, F. R. N. Khan and T. Maiyalagan, Ind. Eng. Chem. Res., 2014, 25, 395–402 Search PubMed.
- R. S. Upadhayaya, G. M. Kulkarni, N. R. Vasireddy, J. K. Vandavasi, S. S. Dixit, V. Sharma and J. Chattopadhyaya, Bioorg. Med. Chem., 2009, 17, 4681–4692 CrossRef CAS.
- C. Kannan, P. Aditi and B. Zwanenburg, Crop Prot., 2015, 70, 92–98 CrossRef CAS.
- G. Vinithra, S. Suganya and S. Velmathi, Tetrahedron Lett., 2013, 54, 5612–5615 CrossRef CAS.
- L. Zhou, X. Hu and S. Wu, Surf. Coat. Technol., 2013, 228, S171–S174 CrossRef CAS.
- A. Korhonen, K. Hemminki and H. Vainio, Basic Clin. Pharmacol. Toxicol., 2010, 51, 38–44 Search PubMed.
- G. Mendoza, A. I. Álvarez, M. M. Pulido, A. J. Molina, G. Merino, R. Real, P. Fernandes and J. G. Prieto, Carbohydr. Res., 2007, 342, 96–102 CrossRef CAS PubMed.
- S. Dales and W. S. Hoar, Can. J. Zool., 2011, 32, 244–251 CrossRef.
- S. A. Khan, N. Singh and K. Saleem, Eur. J. Med. Chem., 2008, 43, 2272–2277 CrossRef CAS PubMed.
- A. Y. Lin, S. C. Panchangam, C. Chang, P. K. A. Hong and H. Hsueh, J. Hazard. Mater., 2012, 243, 272–277 CrossRef CAS PubMed.
- S. Popiel, T. Nalepa, D. Dzierżak, R. Stankiewicz and Z. Witkiewicz, J. Hazard. Mater., 2009, 164, 1364–1371 CrossRef CAS.
- J. J. Wu, M. Muruganandham and S. H. Chen, J. Hazard. Mater., 2007, 149, 218–225 CrossRef CAS PubMed.
- S. Esplugas, J. Gimenez, S. Contreras, E. Pascual and M. Rodriguez, Water Res., 2002, 36, 1034–1042 CrossRef CAS.
- H. Zangeneh, A. A. L. Zinatizadeh and M. Feizy, J. Ind. Eng. Chem., 2014, 20, 1453–1461 CrossRef CAS.
- T. Wu and J. D. Englehardt, Environ. Sci. Technol., 2012, 46, 2291–2298 CrossRef CAS PubMed.
- Y. Lee, D. Gerrity, M. Lee, S. Gamage, A. Pisarenko, R. A. Trenholm, S. Canonica, S. A. Snyder and U. von Gunten, Environ. Sci. Technol., 2016, 50, 3809–3819 CrossRef CAS PubMed.
- J. A. Zazo, J. A. Casas, A. F. Mohedano, M. A. Gilarranz and J. J. Rodríguez, Environ. Sci. Technol., 2005, 39, 9295–9302 CrossRef CAS.
- C. Pan and Y. Zhu, Environ. Sci. Technol., 2010, 44, 5570–5574 CrossRef CAS.
- C. Pan and Y. Zhu, Catal. Sci. Technol., 2015, 5, 371–383 RSC.
- Y. Liu, Y. Zhu, J. Xu, X. Bai, R. Zong and Y. Zhu, Appl. Catal., B, 2013, 142–143, 561–567 CrossRef CAS.
- Y. Zhu, Y. Liu, Y. Lu, H. Wang, Q. Ling and Y. Zhu, Acta Phys.-Chim. Sin., 2013, 576–584 CAS.
- R. M. Sellers, Analyst, 1980, 105, 950 RSC.
- H. Christensen, K. Sehested and H. Corfitzen, J. Phys. Chem., 1982, 86 CrossRef CAS.
- M. F. Kabir, E. Vaisman, C. H. Langford and A. Kantzas, Chem. Eng. J., 2006, 118, 207–212 CrossRef CAS.
- M. Tokumura, A. Ohta, H. T. Znad and Y. Kawase, Water Res., 2006, 40, 3775–3784 CrossRef CAS PubMed.
- S. Haji, B. Benstaali and N. Al-Bastaki, Chem. Eng. J., 2011, 168, 134–139 CrossRef CAS.
- E. S. Elmolla and M. Chaudhuri, Desalination, 2010, 252, 46–52 CrossRef CAS.
- V. Auguliaro, E. Davì, L. Palmisano, M. Schiavello and A. Sclafani, Appl. Catal., 1990, 65, 101–116 CrossRef CAS.
- C. Chiou, C. Wu and R. Juang, Chem. Eng. J., 2008, 139, 322–329 CrossRef CAS.
- Y. Zhang, R. Selvaraj, M. Sillanpää, Y. Kim and C. Tai, Chem. Eng. J., 2014, 245, 117–123 CrossRef CAS.
- S. Lathasree, A. N. Rao, B. SivaSankar, V. Sadasivam and K. Rengaraj, J. Mol. Catal. A: Chem., 2004, 223, 101–105 CrossRef CAS.
- A. Burns, W. Li, C. Baker and S. I. Shah, MRS Proceedings, 2001, 703 Search PubMed.
- A. Sobczyński, Ł. Duczmal and W. Zmudziński, J. Mol. Catal. A: Chem., 2004, 213, 225–230 CrossRef.
- J. A. Khan, X. He, N. S. Shah, H. M. Khan, E. Hapeshi, D. Fatta-Kassinos and D. D. Dionysiou, Chem. Eng. J., 2014, 252, 393–403 CrossRef CAS.
- T. Olmez-Hanci and I. Arslan-Alaton, Chem. Eng. J., 2013, 224, 10–16 CrossRef CAS.
- A. Y. Ahmed, T. A. Kandiel, I. Ivanova and D. Bahnemann, Appl. Surf. Sci., 2014, 319, 44–49 CrossRef CAS.
Footnote |
| † Electronic supplementary information (ESI) available. See DOI: 10.1039/c8ra08085b |
| This journal is © The Royal Society of Chemistry 2019 |

