 Open Access Article
Microfiltration of raw soy sauce: membrane fouling mechanisms and characterization of physicochemical, aroma and shelf-life properties†
Hao Guo ab,
Jun Huangab,
Rongqing Zhouabc,
Chongde Wu
 ab and
Yao Jin*ab
aCollege of Light Industry, Textile & Food Engineering, Sichuan University, Chengdu 610065, China. E-mail: yaojin12@scu.edu.cn; Fax: +86-28-85405237; Tel: +86-138-8219-7633
bKey Laboratory for Leather and Engineering of the Education Ministry, Sichuan University, Chengdu 610065, China
cNational Engineering Research Center of Solid-State Manufacturing, Luzhou 646000, China
First published on 22nd January 2019
Abstract
Refinement to remove fermented mash residue is essential for obtaining clarified, stable and high-quality soy sauce. In this study, raw soy sauce microfiltration was investigated. Four widely-used microfiltration membranes were employed: ceramic, polyethersulfone (PES), polyvinylidene fluoride (PVDF) and mixed cellulose ester (MCE). Membrane fouling mechanisms were identified based on the blocking filtration model, indicating that the dominant fouling mechanism during soy sauce microfiltration was cake formation on the membrane surface. Microfiltration delivered highly dispersed soy sauce having superior clarity and a light color, with satisfactory sterilization quality, and preserved well the NaCl, reducing sugar, total acid and amino nitrogen content, leading to a product having a longer shelf life as compared to pasteurization. The loss of volatile compounds after refinement (microfiltration and pasteurization) was not neglected, particularly the ester groups (total loss of 76.3% to 96.4%), which affected the aroma profile of the soy sauce; all the samples from microfiltration seemed to lack the floral aroma. Ceramic membrane filtration and pasteurization exhibited relatively good preservation of the aroma of soy sauce, which then obtained the best scores in sensory analysis.
1. Introduction
As a traditional fermented food in eastern Asia, soy sauce has become a widely accepted seasoning across the world.1 Soy sauce is typically produced from soybean and wheat by complex fermentation processes involving enzymatic catalysis by various microorganisms.2 As time goes by, the soy sauce is endowed with a unique flavor, formed mainly by volatile components with aromas that could be described as smoky, fruity, flowery, mellow, malt-like and mushroom-like.3 In addition to volatiles, the contents of saccharides, amino acid nitrogen, organic acids and other constituents are all related to the taste and quality of soy sauce.4After brewing for several months, raw soy sauce contains large amounts of fermented mash, which is usually filter-pressed to remove the extra suspended solids, then a final refinement is required to stabilize the flavor and color. Pasteurization is often employed to refine the filter-pressed soy sauce by stopping the microbial and enzymatic reaction. Before packaging, it may be necessary to additionally clarify the soy sauce by centrifugation, sedimentation or microfiltration.5 Among these processes, microfiltration is considered a promising technology for soy sauce production; not only it can provide products with superior clarity while keeping most of the flavor and nutrition substances, but it is also able to remove the microorganisms to stop the fermentation and stabilize the soy sauce.6 Therefore, microfiltration has already been studied as an alternative to heat treatments and is proposed as a process for simultaneous sterilization/refinement for food production.7,8
To date, several studies have focused on the microfiltration of soy sauce. Tien et al.9 reported that the general composition of soy sauce treated with ceramic membrane filtration was not altered while the turbidity and count of microorganisms in the product were significantly decreased. Li et al.6 investigated the hydraulic resistances of two different ceramic membranes and found that the total resistance of the ZrO2 membrane was much greater than that of the α-Al2O3 membrane in soy sauce microfiltration. Furukawa et al.10 modeled the microfiltration of soy sauce by a polysulfone membrane and developed an analytical method to help to select appropriate operating conditions for many cross-flow systems with both ultrafiltration and microfiltration membranes. Sun et al.5 used a spiral wound polyvinylidene fluoride membrane to explore the influences of processing conditions on membrane fouling mechanisms under total recycle mode in the pilot scale of soy sauce microfiltration.
These studies have contributed to a better understanding of the soy sauce microfiltration mechanism and guidance for operational parameters. However, none of them provided a global understanding of soy sauce microfiltration, by systematically taking into account the filtration mechanisms as well as the effect of such a process on the physicochemical properties, aroma and shelf life of soy sauce. Moreover, with the rapid development of the membrane industry, the choices of membrane materials are getting larger and larger. Choosing the most appropriate membrane for soy sauce microfiltration is, therefore, becoming of central interest in industrial application.
The changes in volatile compounds subjected to refinement are crucial in defining the aroma of the soy sauce product.11,12 Feng et al.13 have shown that flavor is a key index for soy sauce, which determines consumer acceptance; they optimized the extraction method for the volatile components in soy sauce via coupling direct GC-olfactometry and gas chromatography-mass spectrometry. Gao et al.2 believe that soy sauce contains a variety of volatiles that are highly valuable to its quality with regard to sensory characteristics and they described the analysis of volatile compounds influencing the flavor quality of Chinese-type soy sauce. Therefore, the changes in the volatile compounds in the refined soy sauce can provide important information for both the science and production of soy sauce. However, such a report can be hardly found in the literature.
In this study, we focus on the membrane fouling mechanisms, the effect of microfiltration on the physicochemical properties, aroma and shelf life of soy sauce, by employing 4 widely-used commercial membrane materials, while taking pasteurization as a reference. The aim of this work is to provide a global understanding of soy sauce microfiltration, and guidance for soy sauce production in industry.
2. Materials and methods
2.1. Soy sauce samples
High-salt liquid-state fermentation soy sauce was used in this study. The soy sauce samples were kindly provided by a local soy sauce brewing company in Sichuan Province of China, and were treated by filter-pressing after fermentation, before the refinement. Four filtered soy sauce samples were obtained by microfiltration. In order to provide a reference technique, a sample was also investigated after pasteurization: a standard process involved 30 minutes of heating at 80 ± 2 °C, and then settling during 5 days before analysis.142.2. Microfiltration pilot and procedure
Four types of membranes were used: mixed cellulose ester (MCE), polyethersulfone (PES), polyvinylidene fluoride (PVDF) membrane (Moshu, Co. Ltd., Shanghai, China) and ceramic (Al2O3) membrane (Lj6t, Co. Ltd., Chengdu, China). The membrane surface porosity was determined by analyzing the scanning electron microscope (SEM) images with the software, Image-Pro Plus (version 6.0, Media Cybernetics, Co. Ltd., America). Each reported value was expressed as the average of five different position measurements for each membrane. The specific membrane performance is shown in Table 1. Prior to use, the PVDF membrane was immersed in 75% (v/v) alcohol for 15 min to ensure that the membrane was sufficiently wetted and degassed because of hydrophobicity. The membrane of organic materials, as well as the wetted PVDF membrane, were soaked in distilled water for 24 h successively to remove impurities or additives from the fabrication process. All chemical reagents used in this study were purchased from Sigma-Aldrich (St. Louis, MO, USA) and Aladdin (Shanghai, China); they were of analytical grade.| Material | Module | Supplier | Filtration area | Pore diameter | Porosity | Hydrophobic/hydrophilic |
|---|---|---|---|---|---|---|
| PES | Flat sheet | Moshu, Co. Ltd., Shanghai, China | 0.005 m2 | 0.22 μm | 35.05% | Hydrophilic |
| PVDF | Flat sheet | Moshu, Co. Ltd., Shanghai, China | 0.005 m2 | 0.22 μm | 36.47% | Hydrophobic |
| MCE | Flat sheet | Moshu, Co. Ltd., Shanghai, China | 0.005 m2 | 0.22 μm | 42.08% | Hydrophilic |
| Ceramic | Tubular | Lj6t, Co. Ltd., Chengdu, China | 0.032 m2 | 0.2 μm | 36.00% | Hydrophilic |
Raw soy sauce samples were microfiltered under a transmembrane pressure of 0.08–0.1 MPa, either with three flat membranes (MCE, PES, PVDF) by a commercial stirred (400 rpm) dead-end filtration cell (Moshu, Co. Ltd., Shanghai, China) or with a ceramic tubular membrane by a customized cross-flow filtration module at a cross-flow rate of 2 m s−1. The pressure was applied via purified compressed air and was monitored by pressure gauges, the filtration temperature was maintained at 20 °C by a thermostatic bath (SDC-6, SCIENTZ, Co. Ltd., China). The permeate flux was monitored by measuring the mass variation in a reservoir vessel every 1 minute with an accuracy of 0.01 g (CP4102, Ohaus, Co. Ltd., America).
2.3. Filtration mechanism models
 | (1) |
| Rt = Rm + Rf = Rm + Rrf + Rirrf | (2) |
 | (3) |
 | (4) |
 | (5) |
2.4. Analysis
A 10 μL injection volume of the purified samples and organic acid were injected into an Agilent 1260 HPLC system equipped with an Alltech OA-1000 organic acid column (300 × 78 mm) maintained at 75 °C with UV detector (215 nm). All samples were measured in triplicate.
GC-MS apparatus (Trace GC Ultra gas chromatograph-DSQ II mass spectrometer, Thermo Electron Corporation, Waltham, America) equipped with an HP-INNOWAX capillary column (30.0 m × 0.25 mm × 0.25 μm, Agilent Technology, Santa, USA) was used to separate and detect the volatile components of the soy sauce samples. The injector temperature was set to 250 °C, high purity helium gas (99.999%) with a flow rate of 1.00 mL min−1 was used as the carrier gas. The split mode was used and the ratio was 10![[thin space (1/6-em)]](https://www.rsc.org/images/entities/char_2009.gif) :
:![[thin space (1/6-em)]](https://www.rsc.org/images/entities/char_2009.gif) 1. The oven temperature was programmed as follows: held at 40 °C for 5 min, then ramped at 5 °C min−1 to 220 °C and held for 5 min. The mass spectrum was operated in the positive ion electron impact ionization (EI+) mode at 70 eV in a range of 40–400 amu. The temperature of the ion source, quadrupole mass filter, and transfer line was set at 230 °C, 150 °C and 250 °C, respectively.
1. The oven temperature was programmed as follows: held at 40 °C for 5 min, then ramped at 5 °C min−1 to 220 °C and held for 5 min. The mass spectrum was operated in the positive ion electron impact ionization (EI+) mode at 70 eV in a range of 40–400 amu. The temperature of the ion source, quadrupole mass filter, and transfer line was set at 230 °C, 150 °C and 250 °C, respectively.
The identification and retention index of each volatile were respectively obtained by comparing their mass spectrum with the NIST05 library database (Finnigan Co. Ltd., California, USA). The relative content of each volatile was then determined by the ratio between the peak area of the specific compound and that of the internal standard. All tests were carried out in triplicate and the data were indicated as the mean value ± relative standard deviation (RSD).
3. Results and discussion
3.1. Microfiltration performance
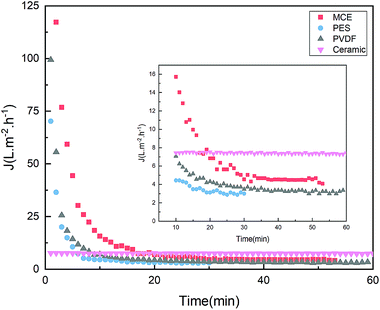
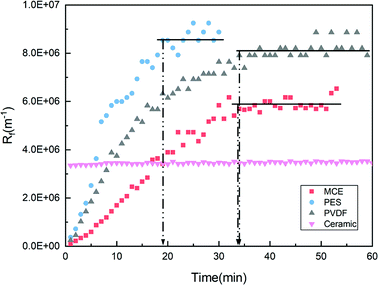
In this section, fouling resistance and blocking mechanisms during microfiltration of the specific raw soy sauce is discussed in order to identify the major problematic issues of this process.Fig. 2 demonstrates the evolution of the fouling layer resistance (Rf) over time during microfiltration. Rf was calculated by eqn (4) and thus provided information on the fouling magnitude for different membranes. The increasing rate of fouling resistance on the PES membrane was the fastest; it was, therefore, the first to reach the maximum, suggesting a relatively poor anti-fouling ability during raw soy sauce microfiltration. Both the increasing rate and steady-state resistance on the MCE membrane were the lowest among the three flat membranes, implying a better anti-fouling ability in this situation. The ceramic membrane, under the cross-flow mode, exhibited a stable fouling resistance, which was the lowest of all four. As mentioned before, this sharp difference probably resulted from the different operating modes. Indeed, it may also relate to the intrinsic properties of the membrane, which were the focus of our next investigation.
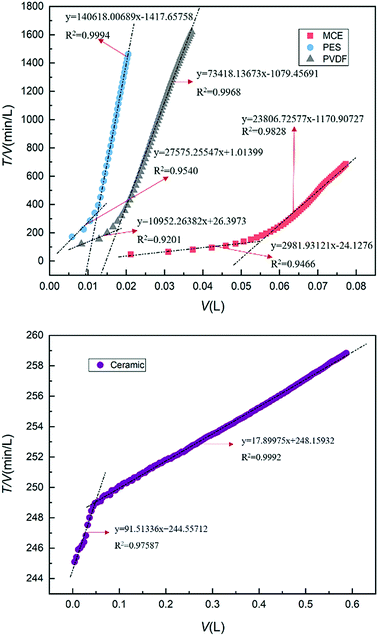
The blocking filtration models were therefore established to identify the membrane fouling mechanism. Fig. 3 and S1–S3 (ESI†) illustrate the fitting of the different fouling models corresponding to the flux data for the whole filtration period (cake filtration, intermediate blocking, complete blocking, standard blocking), the type of membrane fouling during microfiltration was then estimated by the linear correlation coefficient (R2).
Fig. 3 demonstrates the fitting results of the cake filtration model; the respective linear correlation coefficients of MCE, PES, PVDF, and the ceramic membrane in this model were 0.9828, 0.9994, 0.9968, and 0.9992, indicating that the flux decline during the microfiltration of raw soy sauce was mainly caused by cake formation on the membrane surface, regardless of the membrane. Otherwise, the intermediate blocking and standard blocking model fit fairly well for the very early stage in the case of flat membrane dead-end filtration (Fig. S1 and S2†). Since the linear regression could hardly fit the data deduced from the complete blocking model (Fig. S3†), this model was not considered as the main fouling contributor in the microfiltration of our soy sauce samples.
3.2. The effect of refinement on physicochemical properties
The physicochemical properties of different soy sauce samples are shown in Table 3. In terms of NaCl, reducing sugar, total acid, amino nitrogen, and pH value, there was little difference among soy sauce samples, indicating that the involved refining treatment (pasteurization or microfiltration) did not alter the quality of the raw soy sauce. Otherwise, the content of soluble (saltless) solids was slightly lower in the microfiltration treated samples as compared to the others, while in the pasteurized sample it was comparable to the raw sample, especially for the ceramic membrane filtered soy sauce. A similar result can be seen from the comparison of turbidity and chromaticity, which were the main differences among samples. The turbidity of microfiltration treated samples decreased significantly, suggesting the removal of micron-size particles, with the removal ratio of more than 87%. The clarification performance of the ceramic membrane was the best, with the final turbidity of 0.41 NTU and the removal ratio of 99.1%, followed by PES and PVDF. The MCE membrane exhibited relatively low clarification as compared to the other tested membranes, with a removal ratio of 87.2%. On the contrary, the turbidity of the sample greatly increased to 73.80 NTU after pasteurization, which was much higher than that of the raw soy sauce. This may be explained by the protein denaturation and aggregation of charged particles during heating.28 In terms of chromaticity, a slight reduction was observed in the microfiltration treated samples, resulting from the retention of color compounds by the membranes,29 while it was higher in the pasteurized sample as compared to other samples due to the Maillard reaction between the amino compounds and sugars.30| Raw soy sauce | Treatment by pasteurization | Treatment by microfiltration | ||||
|---|---|---|---|---|---|---|
| MCE | PES | PVDF | Ceramic | |||
| Notes: Values represent the mean of triplicate samples ± standard deviation. Mean values in the same row with different superscripted letters indicate that they are significantly different at p < 0.05. ANOVA analysis was applied. | ||||||
| Soluble solids (g/100 mL) | 33.36 ± 0.59a | 34.00 ± 0.53a | 31.44 ± 0.41b | 30.99 ± 0.08b | 31.44 ± 0.36b | 29.83 ± 0.48c |
| NaCl (g/100 mL) | 16.42 ± 0.00a | 16.42 ± 0.00a | 16.33 ± 0.17a | 16.33 ± 0.17a | 16.42 ± 0.00a | 16.04 ± 0.17b |
| Soluble saltless solid (g/100 mL) | 16.94 ± 0.59a | 17.58 ± 0.53a | 15.11 ± 0.30b | 14.66 ± 0.21b | 15.02 ± 0.36b | 13.79 ± 0.35c |
| Reducing sugar (g/100 mL) | 4.22 ± 0.00a | 4.09 ± 0.03b | 4.20 ± 0.03a | 4.14 ± 0.03b | 4.20 ± 0.03a | 4.10 ± 0.03b |
| Total acid (g/100 mL) | 2.24 ± 0.01b | 2.31 ± 0.00a | 2.19 ± 0.03c | 2.16 ± 0.01d | 2.21 ± 0.01c | 2.05 ± 0.01e |
| Amino nitrogen (g/100 mL) | 1.09 ± 0.00a | 1.06 ± 0.00d | 1.07 ± 0.00c | 1.06 ± 0.00d | 1.08 ± 0.00b | 1.00 ± 0.00e |
| pH | 4.51 ± 0.01ab | 4.48 ± 0.01c | 4.50 ± 0.01b | 4.50 ± 0.01b | 4.50 ± 0.01b | 4.52 ± 0.01a |
| Chromaticity | 2.065 ± 0.005b | 2.194 ± 0.003a | 1.932 ± 0.002c | 1.750 ± 0.001f | 1.815 ± 0.002e | 1.853 ± 0.004d |
| Turbidity (NTU) | 48.00 ± 0.00b | 73.80 ± 0.42a | 6.13 ± 0.02c | 2.58 ± 0.01e | 5.48 ± 0.05d | 0.41 ± 0.01f |
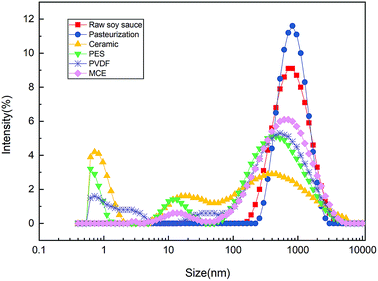
Since we observed a sharp difference in turbidity for diverse samples, it was, therefore, worthwhile to carry out a dynamic light scattering measurement to characterize the particle size distribution of samples.
As shown in Fig. 4 and Table 4, the mean particle sizes of the microfiltration samples were decreased to different extents, and they were all highly polydisperse, with an elevated polydispersity index (PDI). This suggests that the microfiltration removed a considerable amount of large particles or aggregation of soy sauce samples, which was consistent with the turbidity results (see Section 3.3). Among the membranes, the ceramic membrane exhibited the best particle removal performance, since the mean particle size, in this case, was the smallest, being only 52.9 nm, with PDI = 1. As for the pasteurized sample, the mean particle size increased from 490.2 nm of raw soy sauce to 651.0 nm, and its PDI was decreased from 0.478 to below 0.3, indicating a transition from polydispersity to monodispersity. This result implies a possible particle aggregation resulting from pasteurization, consolidating the observation of turbidity, which may have a negative impact on client perception and the shelf life of the product.
| Samples | PDI | Z-Average (nm) | Peak (max.) | |
|---|---|---|---|---|
| Size (nm) | Intensity (%) | |||
| Raw soy sauce | 0.478 | 490.2 | 848.6 | 100.0 |
| Pasteurization | 0.296 | 651.0 | 939.4 | 97.8 |
| MCE | 0.678 | 340.8 | 886.3 | 93.5 |
| PES | 1.000 | 93.0 | 681.1 | 78.0 |
| PVDF | 1.000 | 134.5 | 796.4 | 83.9 |
| Ceramic | 1.000 | 52.9 | 518.3 | 82.2 |
3.3. The effect of refinement on shelf life
Microfiltration treatment, for all used membranes, reached a satisfactory sterilization quality as well as pasteurization: no living bacteria or yeast was detected in the samples subjected to these processes, while the raw soy sauce contained 500 CFU mL−1 of total bacteria and 3 × 10⁷ CFU mL−1 of yeast.The shelf life test was then conducted at 37 °C, and the total bacteria of soy sauce samples were tested 7 and 15 days, and the results showed that the total bacteria in raw soy sauce and pasteurized samples increased to 6 × 10⁵ CFU mL−1 and 700 CFU mL−1, respectively, after 7 days, and 9 × 10⁵ CFU mL−1 and 1100 CFU mL−1, respectively, after 15 days. On the contrary, the microfiltration treated soy sauce samples remained sterilized since no bacteria were detected. For soy sauce products, the increase of bacteria reduced the stability of the soy sauce, which was not conducive for long-term storage. This effect was confirmed by the change in the turbidity: bacteria multiplied over time, along with the increase in turbidity for the raw and pasteurized sample, whereas no remarkable change was observed for the microfiltration treated samples. It is also worth noting that chromaticity increased over time for all the samples under test, probably due to the Maillard reaction. These results indicate that microfiltration had a prominent effect on raw soy sauce refinement, which could effectively extend the shelf life and guarantee a better quality product (Table 5).
| Raw soy sauce | Treatment by pasteurization | Treatment by microfiltration | ||||
|---|---|---|---|---|---|---|
| MCE | PES | PVDF | Ceramic | |||
| Note 1: Values represent the mean of triplicate samples ± standard deviation. Note 2: The left-superscripted symbols for chromaticity, turbidity and total bacteria indicate the test day of shelf life analysis: # for day 0 (d0), * for the 7th day (d7) and ☆ for the 15th day (d15). Note 3: Mean values in the same row with different superscripted letters indicate that they are significantly different at p < 0.05. ANOVA analysis was applied. | ||||||
| #Chromaticity-d0 | 2.065 ± 0.005b | 2.194 ± 0.003a | 1.932 ± 0.002c | 1.750 ± 0.001f | 1.815 ± 0.002e | 1.853 ± 0.004d |
| *Chromaticity-d7 | 2.304 ± 0.002b | 2.489 ± 0.005a | 2.108 ± 0.006c | 2.010 ± 0.001f | 2.037 ± 0.002e | 2.101 ± 0.001d |
| ☆Chromaticity-d15 | 3.384 ± 0.002b | 4.006 ± 0.013a | 3.311 ± 0.001c | 3.057 ± 0.003f | 3.172 ± 0.002e | 3.245 ± 0.002d |
| #Turbidity (NTU)-d0 | 48.00 ± 0.00b | 73.80 ± 0.42a | 6.13 ± 0.02c | 2.58 ± 0.01e | 5.48 ± 0.05d | 0.41 ± 0.01f |
| *Turbidity (NTU)-d7 | 65.05 ± 0.35b | 80.75 ± 0.35a | 5.16 ± 0.04c | 1.97 ± 0.07e | 4.79 ± 0.01d | 0.74 ± 0.02f |
| ☆Turbidity (NTU)-d15 | 78.55 ± 1.63b | 92.15 ± 1.06a | 4.91 ± 0.04c | 1.60 ± 0.02e | 4.37 ± 0.01d | 0.89 ± 0.05f |
| #Total bacteria (CFU mL−1)-d0 | 500 | <1 | <1 | <1 | <1 | <1 |
| *Total bacteria (CFU mL−1)-d7 | 6 × 10⁵ | 700 | <1 | <1 | <1 | <1 |
| ☆Total bacteria (CFU mL−1)-d15 | 9 × 10⁵ | 1100 | <1 | <1 | <1 | <1 |
| #Total yeast (CFU mL−1)-d0 | 3 × 10⁷ | <1 | <1 | <1 | <1 | <1 |
3.4. The effect of refinement on organic acid content
The organic acid standard solutions of 7 different concentration gradients were tested and the calibration curve of each organic acid standard was established based on the concentration and peak area. The linear correlation coefficient (R2) for each calibration curve was greater than 0.9995 (not shown), which validated the reliability of the HPLC analysis for organic acid detection.31Fig. 5 illustrates the contents of 7 organic acids for the investigated soy sauce samples. In general, the organic acid content was well preserved, whether treated by microfiltration or pasteurization, since no sharp decrease in content was observed after both refining treatments. The prominent organic acid of these soy sauce samples was malic acid, and its content decreased to different extents after refinement, especially in the case of the ceramic membrane process, whose sample was shown to be different from the others by ANOVA analysis. In fact, the contents of these 7 organic acids were all slightly lower in the ceramic membrane treated sample as compared to the other samples, which may relate to its high particle removal efficiency, as shown in Section 3.2. Otherwise, the content of succinic acid in the pasteurized sample was slightly reduced as compared with the other samples, while the membranes of PES, PVDF and MCE strongly retained the components of the organic acid.
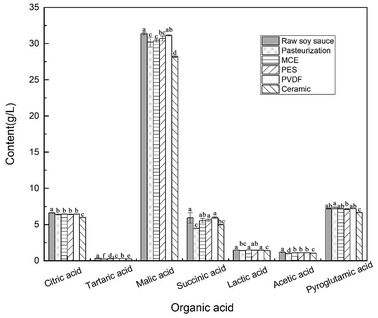 | ||
| Fig. 5 The organic acid content of soy sauce samples. Different letters indicate that they are significantly different at p < 0.05. ANOVA analysis was applied. | ||
3.5. The effect of refinement on volatile compounds
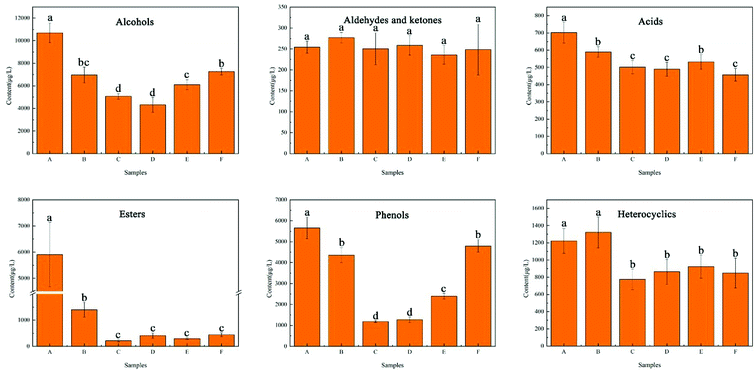
HS-SPME-GC-MS was used to detect the volatile compounds of the soy sauce samples. A total of 63 substances were identified and clustered into 6 groups according to the chemical structure, including 11 alcohols, 4 aldehydes and ketones, 7 acids, 20 esters, 4 phenols and 17 heterocyclic compounds (Table S1†).In terms of the proportions of the 6 volatile groups, alcohols, esters, and phenols were the dominant compounds in the raw sample. The alcohol content was the highest, accounting for 43.76% of the total amount of volatiles. Alcohols were closely related to the aroma and were the basis for the formation of esters, which could produce a pleasant taste. Esters are produced by the non-enzymatic esterification of organic acids and alcohols during fermentation and they are the main components leading to the aroma of soy sauce,32 accounting for 24.17% of the total content of volatiles in the raw sample. The major phenolic components of soy sauce were 4-ethyl-2-methoxy-phenol and 4-ethyl phenol, which were generated by the fermentation of Aspergillus and yeast.33 There were only a few kinds of phenolic substances in soy sauce but they were rich in content, which had a significant effect on the overall aroma, accounting for 23.15% of the total volatile components.
Fig. 6 illustrates the content/proportion of the 6 volatile groups in different soy sauce samples. A decrease in the total volatile constituent content for each refined sample was revealed. In comparison, from the perspective of the total amount of volatile constituents, pasteurization and ceramic membrane filtration performed the best with the amount lost being around 40%, followed by PVDF membrane, with a loss of around 60%. The treatments by PES and MCE membranes were unsatisfactory, removing around 70% of the volatile components.
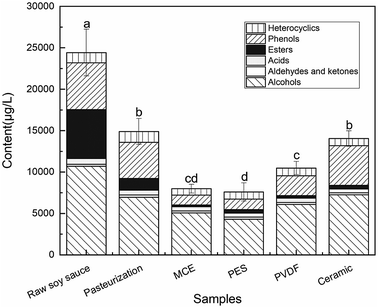 | ||
| Fig. 6 Concentration/proportion of volatile compounds in soy sauce samples. Different letters indicate that they are significantly different at p < 0.05. ANOVA analysis was applied. | ||
As the most abundant volatile components in soy sauce, alcohols were produced by yeast fermentation.34–37 It can be seen from Fig. 7 that the total amount of alcohols in soy sauce decreased to various extents after refining treatments. The total alcohol content losses were 32.0%, 34.8%, 42.9%, 52.6%, and 59.6% for the ceramic membrane, pasteurization, PVDF membrane, MCE membrane, and PES membrane samples, respectively. The ceramic membrane performed the best in terms of alcohol preservation. 2-Methyl-1-propanol, 3-methyl-1-butanol, 1-octen-3-ol, 3-(methylthio)-1-propanol and phenylethyl alcohol were considered as the main components of alcohols, contributing greatly to the flavor of soy sauce.2,38–40 These substances were slightly decreased after pasteurization while the larger loss was demonstrated after microfiltration (Table S1†).
As one of the predominant groups, esters also greatly contribute to the flavor of soy sauce.32,38,41 All of the ester constituents were greatly reduced after refinement (Fig. 7), especially hexadecanoic acid ethyl ester and 9,12-octadecadienoic acid ethyl ester, two dominant ester components in the raw soy sauce sample (Table S1†). We observed a huge loss of the total ester content: 76.30% for the pasteurized sample, and greater than 90% for all the membrane-treated samples (from 92.5% to 96.4%).
A total of 4 phenolic substances was detected in HS-SPME-GC-MS analysis. They were reported to be the main aroma components of soy sauce and contribute to the strong smoky aroma of soy sauce.4,12 As shown in Fig. 7 and Table S1,† after refinement, the total phenolic content losses were 15.2%, 22.9%, 57.6%, 77.5% and 79.0% for the ceramic membrane, pasteurization, PVDF, PES and MCE membrane samples, respectively. The results suggest the fairly good retention of the phenolic components in the sample when treated by ceramic microfiltration, while PES and MCE membranes may not be appropriate choices for the same task.
Other volatile components, such as acids, heterocyclics, aldehydes, and ketones, were also important for the aroma of soy sauce, accounting for 8.92% of the total content. It is interesting to note that no dramatic decrease was revealed after refinement, suggesting that with either microfiltration or pasteurization, acids, heterocyclics, aldehydes, and ketones were largely preserved in soy sauce sample.
3.6. The effect of refinement on the overall aroma
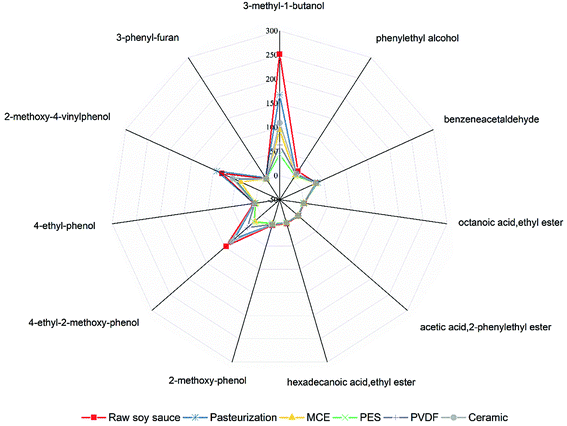
To further investigate the effect of refinement on the overall aroma of soy sauce, the OAV analysis was carried out. In fact, the final contribution of a particular constituent to the overall aroma depends on not only its content but also its odor threshold, which can be gauged by OAV. It is generally considered that OAV > 1 indicates a direct impact of the compound on the overall fragrance, and the greater the OAV, the greater the contribution of the component to the overall odor. This was, therefore, the principle for screening the important aroma components in soy sauce.A total of 20 volatiles in samples were involved in OAV analysis in order to characterize their contribution to overall aroma (Table 6). There were 11 constituents with OAV > 1, among them, 5 constituents had OAV > 10, which were 3-methyl-1-butanol, phenylethyl alcohol, benzeneacetaldehyde, 4-ethyl-2-methoxy-phenol, and 2-methoxy-4-vinylphenol. The volatiles with high OAV contributed to the of malt, floral, mushroom, fruity, sweet, smoky aromas.4,42 In the raw sample, 3-methyl-1-butanol (malty) had the highest OAV (252), followed by 4-ethyl-2-methoxy-phenol (smoky, 97), 2-methoxy-4-vinylphenol (woody, 81), benzene acetaldehyde (honey-like, 33) and phenylethyl alcohol (honey-like, 20).
| Volatile compounds | OAV | Threshold (μg L−1) | Ref. a | Odor descriptionsb | |||||
|---|---|---|---|---|---|---|---|---|---|
| Raw soy sauce | Pasteurization | MCE | PES | PVDF | Ceramic | ||||
| a Odor threshold was taken from previous studies (1 (ref. 3), 2 (ref. 42), 3 (ref. 12), 4 (ref. 44)).b Odor descriptions are based on (1) the University of Florida Citrus Flavor database (http://www.crec.ifas.ufl.edu/rouseff/#) and (2) Flavornet (http://www.flavornet.org/flavornet.html). | |||||||||
| 1-Butanol | 0.12 | 0.10 | 0.06 | 0.05 | 0.05 | 0.10 | 459.2 | 1 | Alcoholic |
| 3-Methyl-1-butanol | 251.99 | 167.28 | 94.41 | 43.80 | 63.51 | 109.19 | 4 | 1 | Malty |
| 1-Octen-3-ol | 0.70 | 0.31 | 0.00 | 0.00 | 0.00 | 0.19 | 1.5 | 1 | Mushroom |
| 3-(Methylthio)-1-propanol | 0.45 | 0.33 | 0.24 | 0.24 | 0.28 | 0.32 | 856.1 | 1 | Raw potato, garlic, vegetable |
| Phenylethyl alcohol | 20.26 | 13.13 | 10.36 | 9.03 | 12.81 | 14.64 | 390 | 2 | Honey, rose, lilac, spicy |
| Benzaldehyde | 0.12 | 0.14 | 0.14 | 0.14 | 0.12 | 0.14 | 750.9 | 2 | Bitter almond, woody, burnt |
| Benzeneacetaldehyde | 32.85 | 36.38 | 31.60 | 33.63 | 31.99 | 32.33 | 4 | 3 | Honey |
| Octanoic acid, ethyl ester | 1.55 | 0.18 | 0.46 | 0.45 | 0.50 | 0.32 | 19.4 | 4 | Floral |
| Benzeneacetic acid, ethyl ester | 0.13 | 0.12 | 0.03 | 0.03 | 0.02 | 0.06 | 650 | 4 | Rose, honey |
| Acetic acid, 2-phenylethyl ester | 0.99 | 1.36 | 0.02 | 0.02 | 0.08 | 0.66 | 249.6 | 3 | Floral |
| 3-Phenyl-2-propenoic acid, ethyl ester | 0.20 | 0.00 | 0.00 | 0.00 | 0.00 | 0.00 | 50 | 4 | Floral, fruity |
| Hexadecanoic acid, ethyl ester | 1.58 | 0.27 | 0.02 | 0.03 | 0.02 | 0.04 | 1500 | 4 | Floral, fruity |
| Ethyl oleate | 0.17 | 0.03 | 0.00 | 0.04 | 0.00 | 0.00 | 3500 | 4 | Floral, fruity |
| 9,12-Octadecadienoic acid, ethyl ester | 0.49 | 0.07 | 0.00 | 0.01 | 0.02 | 0.00 | 4000 | 4 | Floral, fruity |
| 2-Methoxy-phenol | 4.97 | 3.69 | 2.67 | 1.61 | 3.09 | 4.20 | 9.5 | 3 | Smoky |
| 4-Ethyl-2-methoxy-phenol | 96.87 | 72.98 | 17.98 | 20.10 | 38.34 | 82.43 | 50 | 3 | Smoky, clove, spicy with vanilla note |
| 4-Ethyl-phenol | 4.00 | 3.04 | 1.12 | 0.73 | 2.25 | 3.57 | 130 | 3 | Shoe polish, leather, smoky |
| 2-Methoxy-4-vinylphenol | 81.46 | 92.85 | 38.92 | 52.19 | 52.29 | 56.91 | 3 | 3 | Woody, amber, cedar, peanut |
| 3-Phenyl-furan | 1.95 | 3.96 | 1.65 | 1.85 | 1.77 | 1.62 | 5.9 | 3 | Green bean-like |
| 1-(1H-Pyrrol-2-yl)-ethanone | 0.28 | 0.29 | 0.16 | 0.17 | 0.21 | 0.24 | 1000 | 4 | Roasted, nutty |
Fig. 8 illustrates the OAV profile of the soy sauce samples, involving the 11 constituents with OAV > 1. It shows that the employed refining treatments induced a loss of the malty aroma (3-methyl-1-butanol), especially in the cases of PES and PVDF membranes. The smoky aroma (4-ethyl-2-methoxy-phenol) was well preserved in the ceramic membrane and pasteurization samples while a relatively high-level loss occurred in the cases of the MCE, PES and PVDF membranes. The woody/amber aroma (2-methoxy-4-vinylphenol) was enhanced by pasteurization and weakened by microfiltration.
It should be equally noted (based on Fig. 8 and Table 6) that the aroma compounds of benzeneacetaldehyde (honey-like) and 3-phenyl-furan (green bean-like) were well preserved in all the samples after microfiltration and were even enhanced by pasteurization. Samples refined by MCE and PES membranes were the most aroma-stripped samples, while the ceramic membrane exhibited a relatively good ability for the preservation of the aroma of soy sauce. It is also reasonable to claim that all the samples after microfiltration lacked the floral aroma since most of the esters (the main floral aroma compounds) were stripped from the samples during this process, for all 4 used membranes.
3.7. Principal component analysis of samples
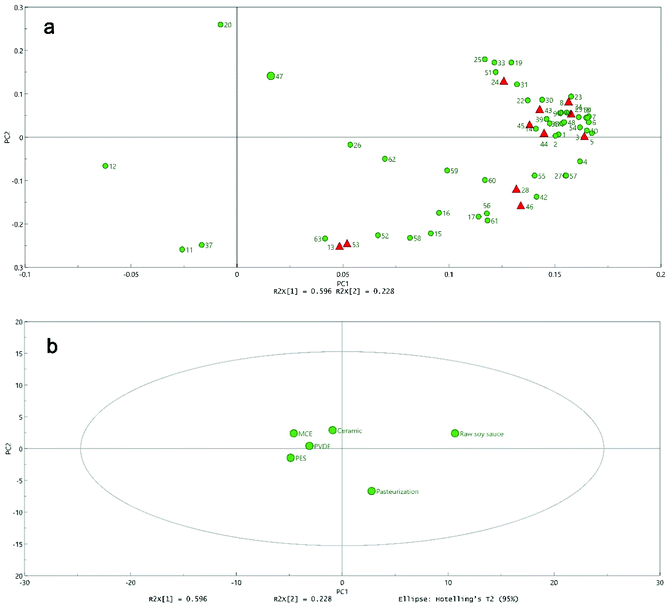
Principal component analysis (PCA) can simplify the analyses by displaying similarities and differences among different samples by compressing the number of dimensions without much loss of information.43 PCA was therefore implemented for the entire data matrix (6 samples × 63 volatiles).As shown in Fig. 9, the first two principal components, PC1, and PC2, explained 82.4% of the total variance in raw data, 59.6% and 22.8%, respectively. The loading values of the first two principal components were investigated to explain the basis of separation and reflect the influence of substances on principal components (Fig. 9a). The score plot (Fig. 9b) indicated the similarities and differences among samples resulting from the volatile contents. The raw sample was positioned in the positive region of both PC1 and PC2; the pasteurized sample was positioned in the positive region of PC1 and negative region of PC2; all the microfiltration-treated samples were gathered in the negative region of PC1 and spread around both the negative and positive attributes of PC2, showing a certain trend of clustering.
After either microfiltration or pasteurization, the volatile components were reduced to some extent, which caused most of the substances to be concentrated on the positive axis of PC1 and contributed greatly to the difference between raw soy sauce and the other samples. As illustrated in the two figures, the PC1 axis was strongly influenced by the volatile components: all the 11 key aroma-active compounds were situated in the positive region, and the volatile compounds such as 1-octen-3-ol (5), 1-phenyl-cyclopropanemethanol (10), 3-(methylthio)-1-propanol (6), benzyl alcohol (7), 2-furanmethanol (50), 2-methyl-propanoic acid (18), 3-methyl-1-butanol (3), etc., located toward the highest weight on PC1, were actually the major volatiles in the raw sample, but were greatly removed by refinement. Similarly, benzaldehyde (12), located toward the highest negative weight on PC1, was the key volatile enriched in the other samples as compared to the raw sample. Maltol (52), 3-phenyl-furan (53) and benzeneacetaldehyde (13) were the main volatiles that differentiated the pasteurized sample from the others. 4-Methyl-pentanoic acid (20), 3-furaldehyde (47), hexadecanoic acid methyl ester (33), and 2-methyl-hexanoic acid (19) were situated toward the highest weight on PC2, among which 3-furaldehyde (47) differentiated the ceramic membrane sample from the others, and 4-methyl-pentanoic acid (20) was the key volatile stripped only by pasteurization.
3.8. Sensory analysis of soy sauce samples
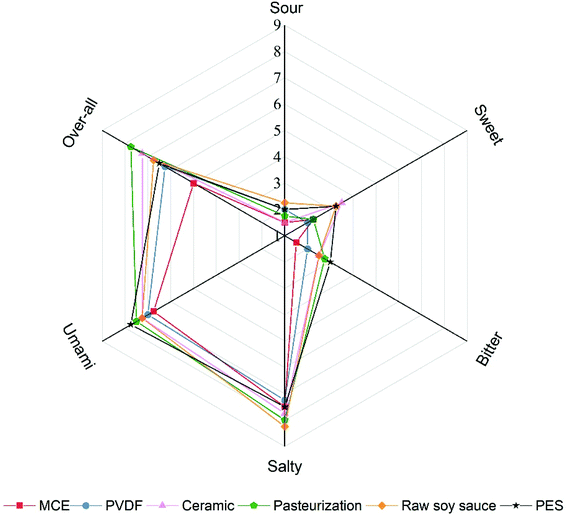
So far, all the characterizations were carried out based on the instrumental detector. The human senses, without doubt, are the direct indicators of product quality, especially when a food product is involved. Therefore, sensory panel studies were conducted in order to further distinguish the involved samples by human senses.It can be seen from Fig. 10 that the soy sauce refined by pasteurization and ceramic membrane, as well as the raw sample, performed better than the others in sensory evaluation, and the overall perception of the pasteurized sample was the best, followed by a ceramic refined sample and the raw soy sauce, while the MCE sample was far behind the others. All the samples exhibited comparable intensities in terms of umami, salty and sour tastes, with high intensities for the former two tastes and low intensities for the latter. In fact, the sweet, sour and bitter tastes were not pronounced for all tested samples. Nevertheless, certain panelists pointed out a noticeable sweet taste in the ceramic sample and a markedly bitter aftertaste in the PES sample.
The panelists made a common conclusion that the pasteurization and ceramic refined samples were endowed with harmonious tastes, while the overall taste of the MCE refined sample was pale in comparison. In general, the results from the sensory evaluation were consistent with the changes in the physicochemical properties and volatile profiles after refinement (Tables 3 and S1†).
4. Conclusion
In this work, raw, high-salt liquid-state fermentation soy sauce was refined by microfiltration or pasteurization. Four different widely-used commercial membranes (ceramic, PES, PVDF and MCE) were employed for microfiltration. The membrane fouling mechanisms and characterization of physicochemical properties, aroma components and shelf life of soy sauce after refinement were investigated and the following results were obtained:(1) The MCE membrane exhibited relatively good anti-fouling ability deduced from the fouling resistance model. Cake formation on the membrane surface was the main mechanism resulting in permeate flux decline during raw soy sauce microfiltration, deduced from the blocking filtration model.
(2) Microfiltration delivered soy sauce with high dispersion, superior clarity and a light color, having a satisfactory sterilization quality, and preserved well the NaCl, reducing sugar, total acid and amino nitrogen contents, which could effectively extend the shelf life and guarantee a better quality of the product. In comparison, pasteurization led to a denser, darker aroma-rich fine soy sauce with a shorter shelf life.
(3) Both microfiltration and pasteurization induced a non-negligible loss of volatile compounds, especially for the esters group (total loss of 76.3% to 96.4%). All the refining treatments induced a loss of malty aroma (3-methyl-1-butanol). Aromas, such as smoky, woody, amber, honey, and green bean, were well preserved in the ceramic membrane and pasteurization samples. All the samples from microfiltration seemed to lack the floral aroma. Ceramic membrane and pasteurization exhibited the relatively good aroma preservation of soy sauce, which then obtained the best scores in sensory analysis, while the MCE sample was considered unsatisfactory.
Conflicts of interest
There are no conflicts of interest to declare.Acknowledgements
This work was sponsored by the Fundamental Research Funds for the Central Universities of China (Grant number: YJ201835). It was also supported by Qianhe Co. Ltd., of Sichuan Province, China.References
- J. Liu, D. Li, Y. Hu, C. Wang, B. Gao and N. Xu, Int. J. Food Sci. Technol., 2015, 50, 1352–1358 CrossRef CAS.
- L. Gao, T. Liu, X. An, J. Zhang, X. Ma and J. Cui, J. Food Sci. Technol., 2017, 54, 130–143 CrossRef CAS PubMed.
- A. Giri, K. Osako, A. Okamoto and T. Ohshima, Food Res. Int., 2010, 43, 1027–1040 CrossRef CAS.
- P. Steinhaus and P. Schieberle, J. Agric. Food Chem., 2007, 55, 6262–6269 CrossRef CAS PubMed.
- Y. Sun, Z. Qin, L. Zhao, Q. Chen, Q. Hou, H. Lin, L. Jiang, J. Liu and Z. Du, J. Food Process Eng., 2018, 41, e12599 CrossRef.
- M. Li, Y. Zhao, S. Zhou, W. Xing and F.-S. Wong, J. Membr. Sci., 2007, 299, 122–129 CrossRef CAS.
- C. Bhattacharjee, V. K. Saxena and S. Dutta, Innovative Food Sci. Emerging Technol., 2017, 43, 136–153 CrossRef CAS.
- A. Colantuono, P. Vitaglione, N. Manzo, G. Blaiotta, I. Montefusco, A. Marrazzo, F. Pizzolongo and R. Romano, J. Sci. Food Agric., 2018, 98, 3324–3332 CrossRef CAS PubMed.
- C. H. J. Tien and B. E. H. Chiang, J. Food Sci., 1992, 57, 740–742 CrossRef CAS.
- T. Furukawa, K. Kokubo, K. Nakamura and K. Matsumoto, J. Membr. Sci., 2008, 322, 491–502 CrossRef CAS.
- Y. Feng, Y. Cai, G. Su, H. Zhao, C. Wang and M. Zhao, Food Chem., 2014, 145, 126–134 CrossRef CAS PubMed.
- Y. Feng, G. Su, H. Zhao, Y. Cai, C. Cui, D. Sun-Waterhouse and M. Zhao, Food Chem., 2015, 167, 220–228 CrossRef CAS PubMed.
- Y. Feng, G. Su, D. Sun-Waterhouse, Y. Cai, H. Zhao, C. Cui and M. Zhao, Food Anal. Methods, 2017, 10, 713–726 CrossRef.
- B. Luh, J. Ind. Microbiol., 1995, 14, 467–471 CrossRef CAS.
- W. Li, G. Ling, F. Lei, N. Li, W. Peng, K. Li, H. Lu, F. Hang and Y. Zhang, Sep. Purif. Technol., 2018, 190, 9–24 CrossRef CAS.
- P. H. Hermans and H. L. Bredée, J. Soc. Chem. Ind., 1936, 55T, 1–4 Search PubMed.
- K.-J. Hwang and T.-T. Lin, J. Membr. Sci., 2002, 199, 41–52 CrossRef CAS.
- R.-Y. Cui, J. Zheng, C.-D. Wu and R.-Q. Zhou, Eur. Food Res. Technol., 2014, 239, 321–331 CrossRef CAS.
- H. N. Lioe, K. Wada, T. Aoki and M. Yasuda, Food Chem., 2007, 100, 1669–1677 CrossRef CAS.
- P. Singracha, N. Niamsiri, W. Visessanguan, S. Lertsiri and A. Assavanig, LWT–Food Sci. Technol., 2017, 78, 181–188 CrossRef CAS.
- W. Wang and W. Zhou, J. Food Eng., 2012, 109, 399–405 CrossRef CAS.
- L. Zhang, J. Huang, R. Zhou and C. Wu, Int. J. Food Microbiol., 2017, 255, 42–50 CrossRef CAS PubMed.
- X. Ding, C. Wu, J. Huang and R. Zhou, LWT–Food Sci. Technol., 2016, 66, 124–133 CrossRef CAS.
- M. Niu, J. Huang, Y. Jin, C. Wu and R. Zhou, J. Inst. Brew., 2018, 124, 68–76 CrossRef CAS.
- T. Stoichev, P. de Morais, M. C. P. Basto, M. Teresa and S. D. Vasconcelos, J. AOAC Int., 2015, 98, 524–528 CrossRef CAS PubMed.
- X. Gao, C. Cui, J. Ren, H. Zhao, Q. Zhao and M. Zhao, Int. J. Food Sci. Technol., 2011, 46, 243–249 CrossRef CAS.
- J. Jiang, Q. Zeng, Z. Zhu and L. Zhang, Food Chem., 2007, 104, 1629–1634 CrossRef CAS.
- V. A. Borzova, K. A. Markossian, N. A. Chebotareva, S. Y. Kleymenov, N. B. Poliansky, K. O. Muranov, V. A. Stein-Margolina, V. V. Shubin, D. I. Markov and B. I. Kurganov, PLoS One, 2016, 11, e0153495 CrossRef PubMed.
- A. Miyagi, T. Suzuki, H. Nabetani and M. Nakajima, Food Bioprod. Process., 2013, 91, 507–514 CrossRef CAS.
- M. Ando, K. Harada, S. Kitao, M. Kobayashi and Y. Tamura, Int. J. Mol. Med., 2003, 12, 923–928 CAS.
- V. Ivanova-Petropulos, Z. Naceva, V. Sandor, L. Makszin, L. Deutsch-Nagy, B. Berkics, T. Stafilov and F. Kilar, Electrophoresis, 2018, 39, 1597–1605 CrossRef CAS PubMed.
- Z. Yanfang and T. Wenyi, Afr. J. Biotechnol., 2009, 8, 673–681 Search PubMed.
- Y. Suezawa and M. Suzuki, Biosci., Biotechnol., Biochem., 2007, 71, 1058–1062 CrossRef CAS PubMed.
- C. van der Sluis, J. Tramper and R. H. Wijffels, Trends Food Sci. Technol., 2001, 12, 322–327 CrossRef.
- K. Takeshige and K. Ouchi, J. Ferment. Bioeng., 1995, 79, 449–452 CrossRef CAS.
- K. Iwasaki, M. Nakajima, H. Sasahara and A. Watanabe, Agric. Biol. Chem., 1991, 55, 2201–2207 CAS.
- R. Jones, N. Pamment and P. Greenfield, Process Biochem., 1981, 16, 42–49 CAS.
- S. Y. Sun, W. G. Jiang and Y. P. Zhao, J. Inst. Brew., 2010, 116, 316–328 CrossRef CAS.
- S. Kaneko, K. Kumazawa and O. Nishimura, J. Agric. Food Chem., 2012, 60, 3831–3836 CrossRef CAS PubMed.
- S. Kaneko, K. Kumazawa and O. Nishimura, J. Agric. Food Chem., 2013, 61, 3396–3402 CrossRef CAS PubMed.
- W. Fan, H. Shen and Y. Xu, J. Sci. Food Agric., 2011, 91, 1187–1198 CrossRef CAS PubMed.
- A. Giri, K. Osako and T. Ohshima, Food Chem., 2010, 120, 621–631 CrossRef CAS.
- Q. Wei, H. Wang, Z. Lv, G. Hu, Y. Li, Y. Liu, Y. Wang and F. Lu, Food Res. Int., 2013, 53, 189–194 CrossRef CAS.
- L. J. V. Gemert, Compilations of odour threshold values in air, water and other media, Oliemans Punter & Partners BV, The Netherlands, 2003 Search PubMed.
Footnote |
| † Electronic supplementary information (ESI) available. See DOI: 10.1039/c8ra08395a |
| This journal is © The Royal Society of Chemistry 2019 |


