 Open Access Article
Electrocatalytic oxygen reduction reaction activity of KOH etched carbon films as metal-free cathodic catalysts for fuel cells
Ni Suoa,
Aimin Wu*a,
Hao Huang a,
Guozhong Cao
 b and
Guifeng Zhang
 *a
*a
aEnergy Materials & Devices Laboratory, School of Materials Science and Engineering, Dalian University of Technology, Dalian 116024, China. E-mail: aimin@dlut.edu.cn; gfzhang@dlut.edu.cn
bDepartment of Materials Science and Engineering, University of Washington, Seattle, WA 98195, USA
First published on 21st January 2019
Abstract
In this article, surface-modified graphite materials as cathodic catalysts are prepared by hot filament chemical vapor deposition and then chemically etched by KOH solution. Surface morphology, elemental composition, microstructure and surface chemical state of the modified graphite films are characterized by scanning electron microscopy, transmission electron microscopy, energy dispersive spectroscopy, Raman spectroscopy and X-ray photoelectron spectroscopy techniques. Results indicate that the surface of the pristine graphite can be refined to effectively improve the surface area by etching using the KOH solution with a moderate concentration. The graphite catalyst etched with 4.8 mg mL−1 KOH solution shows a higher catalytic activity for the oxygen reduction reaction and a superior methanol tolerance than that of the un-etched and the other etched graphite catalysts. The stability of the etched graphite materials needs to be improved.
1. Introduction
The electrocatalysts for oxygen reduction reaction (ORR) are a cornerstone of fuel cells. Excellent ORR activity plays an important role in fuel cell performance. Typically, platinum and its alloy materials have been regarded as the most active catalysts for cathode reactions.1,2 However, the high cost, limited supply, sluggish ORR kinetics, poor stability, and poor methanol tolerance pose key technical challenges to wide-spread commercialization of fuel cells.3–5 Therefore, numerous non-precious metal and metal-free carbon-based electrocatalysts have been screened and developed in terms of their favorable ORR activity.6–9In recent years, various carbon-based materials, including graphene, carbon nanotubes and carbon fibers etc.10 have been widely researched as catalytic or supporting materials due to their larger surface areas. In the reported literature, the reduction peak potential and the onset potential of these materials in alkaline media were in the range of −0.36 to −0.30 V vs. Ag/AgCl and −0.23 to −0.15 V vs. Ag/AgCl, respectively.11–16 In addition to the aforementioned carbon materials, graphite also exhibits a certain catalytic activity. This carbon material is advantageous for large-scale commercial production of fuel cells due to its low cost. Yet, there is still a problem that the current density required in practical applications of fuel cells cannot be reached.17–19
Currently, the current density for the ORR can be improved by adjusting the electronic density of states and increasing the surface area etc.20–23 In terms of enhancing the surface area, one of the simplest methods is to create pores in the active materials. There are a few studies on investigating porous graphite materials obtained by etching using KOH solution under mild temperature bath or high temperature annealing for lithium batteries as anodes.24–28 However, to the best of our knowledge, studies on the KOH etched graphite as cathode catalysts for fuel cells are clearly lacking.
In this paper, graphite films were synthesized by hot filament chemical vapor deposition (HFCVD) technique and then chemically etched. The as-prepared graphite (a-G) films were soaked in KOH solutions with various concentrations and then annealed in a vacuum tubular furnace. The influence of the concentration of KOH solution on the ORR performance of the etched graphite (e-G) films was investigated to obtain a catalyst with better ORR catalytic activity.
2. Materials and methods
Reagents
Potassium hydroxide, methanol, hydrofluoric acid and isopropyl alcohol (analytical reagent) were purchased from Tianjin Damao Chemical Reagent Factory and acetone (analytical reagent), ethanol absolute (guarantee reagent), and Nafion from Guangdong Xilong Scientific Co., Ltd., Tianjin Tianli Chemical Reagents Co., Ltd., and Alfa Aesar, respectively.Synthesis of catalysts
Graphite films were prepared by using a HFCVD system. Titanium sheets with 18 mm in diameter and 0.6 mm in thickness as substrates were polished with fine sandpapers and ultrasonically rinsed in acetone, ethanol and deionized water for 30 min successively, and then dried with nitrogen gas. Gas flow rate of methane and hydrogen was controlled by mass flowmeters. The volume ratio of methane was fixed at 3% and the total pressure was about 5.3 × 10³ Pa. The distance between the tantalum filament with 0.6 mm in diameter and the substrate placed on the sample stage was approximately 6–8 mm. Filament and substrate temperatures were about 2000 °C and 850 °C, respectively. The deposition time was set to 6 h.The KOH solution with a concentration of 3.2, 4.8, 6.4 and 8.0 mg mL−1 respectively was placed in a drying oven at 30 °C for 1.5 h. The a-G films were soaked in the above various KOH solutions in PTFE containers for 8 h, then dried in a vacuum oven at 60 °C for 12 h.
The processed a-G films were placed in a sealed alumina crucible, and then were put in the center of the corundum tube in a vacuum tube furnace. The samples were preheated at 200 °C for 0.5 h, and subsequently calcined at 800 °C for 2 h with a heating rate of 5 °C min−1. As a contrast experiment, an a-G film without KOH etching (u-G) was similarly treated under argon atmosphere maintaining the pressure of −0.08 × 10⁻³ Pa in the tube.
Characterizations
The surface morphology was observed by means of scanning electron microscopy (SEM, Zeiss Supra55) and transmission electron microscopy (TEM, Tecnai G220 S-Twin). The elemental composition was obtained by energy dispersive spectroscopy (EDS). The microstructure was characterized using Raman spectroscopy with the Green Light laser line at 532 nm (Renishaw inVia). X-ray photoelectron spectroscopy (XPS) measurements were performed on an ESCALAB 250Xi spectrometer with a monochromatized Al Kα radiation (hν = 1486.6 eV).Electrocatalytic measurements were carried out using CHI760E electrochemical workstation with a three-electrode potentiostat (Shanghai Chen Hua). The glassy carbon (GC) loaded catalyst, platinum wire and Ag/AgCl were used as working, counter and reference electrodes, respectively.
The catalysts were obtained by removing the substrates using 5 wt% HF and were rinsed thoroughly with diluted KOH solution and deionized water until neutral pH was reached. 5 mg catalysts in 5 mL isopropyl alcohol and 25 μL Nafion solution (5 wt% Alfa Aesar) as a binder were ultrasonically vibrated for 1 h to obtain a catalyst ink. The electrode was polished on the rayon cloth using 0.30 and 0.05 μm alumina slurry successively and then cleaned using distilled water. The ORR catalytic activity of catalysts under steady-state condition was investigated by a cyclic voltammetry (CV) in the potential range of −1.0 V to 0.2 V vs. Ag/AgCl at a scan rate of 50 mV s−1. 10 μL catalyst ink was loaded on the surface of the rotating disk electrode (RDE) with 3 mm GC in diameter and then dried at room temperature. Recording of linear sweep voltammograms (LSVs) was performed by sweeping the potential from −1.0 V to 0.0 V vs. Ag/AgCl at a scan rate of 10 mV s−1 and a rotation speed from 400 to 2500 rpm. 14 μL catalyst ink was dropped onto the rotating ring-disk electrode (RRDE) consisting of Pt ring and GC disk with a diameter of 4 mm. The catalyst loading for RDE and RRDE was about 0.14 mg cm−2 and 0.11 mg cm−2, respectively. All the electrocatalytic experiments were conducted in 0.1 M KOH electrolyte at room temperature.
3. Results and discussion
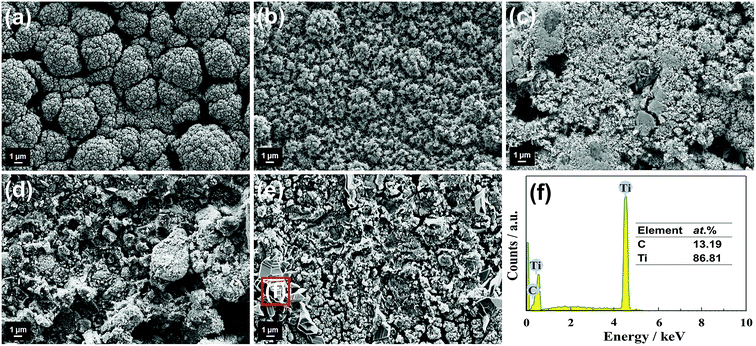
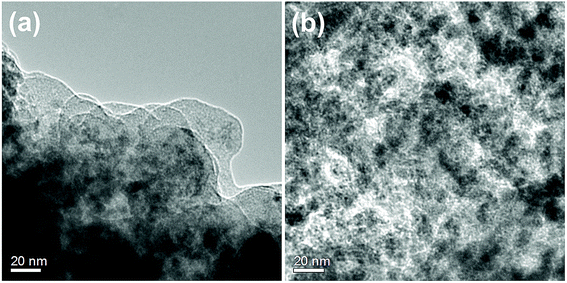
Fig. 1 shows SEM images of the u-G and the e-G films obtained using different concentration KOH solutions and elemental analysis of an enclosed region marked by solid line in Fig. 1e from the EDS measurement. The surface morphology of the u-G film has obvious changes due to KOH activation. The mechanism of the KOH activation can be explained by eqn (1)–(3).29–31 The u-G film consists of cauliflower-like polycrystals with wider boundary (Fig. 1a). The cauliflower-like morphological characteristic almost disappears after chemically etching and the crystal grains change fine (Fig. 1b). With the increase of KOH solution concentration, the grains become more refined and the surface area has been effectively increased, and then a very small number of pits appear probably due to uneven etching (Fig. 1c). The film is excessively etched (Fig. 1d) or even the substrate is exposed when KOH concentration is too high (Fig. 1e). It has been confirmed by the EDS measurement, as shown in Fig. 1f. The surface morphology of the carbon film before and after etching was further examined by TEM technique as shown in Fig. 2. It can be observed from Fig. 2 that the structure of the carbon film before and after etching does not change and remains schistose. In addition, the different contrast of TEM image reflects degree of etching, confirming the formation of pits with different sizes, in good agreement with the result of SEM observation.| 6KOH + 2C = 2K + 3H2 + 2K2CO3 | (1) |
| K2CO3 + 2C = 2K + 3CO | (2) |
| K2O + C = 2K + CO | (3) |
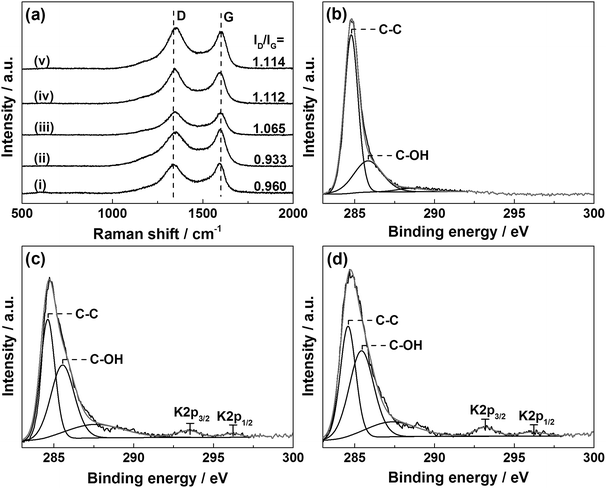
Raman spectra of the u-G and the e-G films obtained at different concentration KOH solutions are shown in Fig. 3a. Two distinct peaks of graphitic carbon are ascribed to the D band at 1335 cm−1 and the G band at 1592 cm−1, respectively.32 The D band corresponds to the structural defects of graphitic carbon, and the G band is associated with the first-order scattering of the E2g mode.33,34 The shift of D band to the high-frequency region is observed after etching treatment, explaining that the greater internal stress in the seriously disordered structure is generated. The intensity ratio of the D and G bands is calculated by the peak height and defined as ID/IG. The ID/IG value increases from 0.933 to 1.114 with increasing concentration of KOH solution, illustrating the decrease of the graphitization degree.
The chemical states of the carbon materials before and after KOH activation were analyzed by XPS measurement. The fitted XPS C1s and K2p spectra of u-G and e-G samples obtained at 4.8 and 8.0 mg mL−1 KOH solutions respectively are shown in Fig. 3b–d, respectively. The broadening C1s signal in the range of 286–291 eV is a feature commonly found in many carbon materials and is attributed to carbon atoms singly or doubly coordinated with different atoms.35 The peaks centered at about 284.6 eV and 285.8 eV in all samples correspond to the C–C and C–OH bonds.36 The C–OH bond content can be estimated using the peak area. It is clearly observed that the C–OH bond content increases with increasing concentration of KOH solution and is 28.36%, 38.87% and 43.38% for u-G and e-G samples obtained at 4.8 and 8.0 mg mL−1 KOH solutions, respectively (see Table 1). The higher C–OH bond content in the e-G sample obtained at 8.0 mg mL−1 KOH solution indicates that the excessive KOH activation consumes a certain amount of carbon. This also explains that the sample has lower carbon content, in agreement with the SEM result. The other peaks located at approximately 293.4 eV and 296.2 eV are assigned to K2p3/2 and K2p1/2 of K element, respectively (Fig. 3c and d).
| Sample | (a) | (b) | (c) | |||
|---|---|---|---|---|---|---|
| Name | BE (eV) | % Area | BE (eV) | % Area | BE (eV) | % Area |
| C–C | 284.8 | 68.47 | 284.6 | 38.93 | 284.6 | 35.60 |
| C–OH | 285.8 | 28.36 | 285.5 | 38.87 | 285.5 | 43.38 |
| Others | 286–291 | 3.17 | 286–291 | 17.00 | 286–291 | 15.15 |
| K2p3/2 | — | — | 293.4 | 3.60 | 293.2 | 3.67 |
| K2p1/2 | — | — | 296.2 | 1.60 | 296.2 | 2.20 |
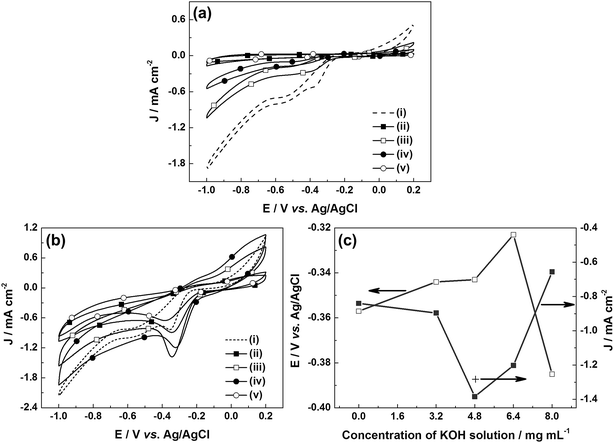
The ORR performance of the u-G and e-G catalysts obtained at various KOH solution concentrations was investigated by the CV measurement in the potential range of −1.0 to 0.2 V vs. Ag/AgCl at a scan rate of 50 mV s−1. No peaks were observed in the CV curves (CVs) of the samples tested in N2-saturated 0.1 M KOH solution (Fig. 4a). Another important aspect is that the area of the above CV curve is regarded as a good benchmark to evaluate the surface area of the catalytic material.37 It can be found from Fig. 4a that the area of CV curve of the e-G catalyst at 4.8 mg mL−1 KOH solution is slightly larger than that of the other catalysts, indicating that the electrochemically active surface area of the catalyst is higher, confirming the SEM observation. When the solution was saturated with oxygen, significant oxygen reduction peaks can be found in all CVs, as can be seen in Fig. 4b. The potential and the current density of the oxygen reduction peaks are shown in Fig. 4c. The reduction peak potentials of the e-G catalysts etched using KOH solution with concentrations of 4.8 and 6.4 mg mL−1 are at −0.343 V and −0.323 V vs. Ag/AgCl corresponding to the reduction peak current density of 1.384 mA cm−2 and 1.203 mA cm−2, respectively. Besides, the current density (1.283 mA cm−2) at −0.323 V vs. Ag/AgCl for the e-G catalyst obtained by 4.8 mg mL−1 KOH solution (see the cross symbol in Fig. 4c) is higher than that by 6.4 mg mL−1 KOH solution. It is clear that the e-G catalyst etched by KOH solution with a concentration of 4.8 mg mL−1 shows the highest ORR activity among all the investigated samples due to the morphology and structure changes, which is caused by the appropriate etching. As can be seen from the reduction peak potential and current density given in Table 2 that the catalyst in this work exhibits better ORR catalytic activity compared to previously reported pristine carbon materials.
| Sample | Reduction peak potentiala (V vs. Ag/AgCl) | Reduction peak current densitya (mA cm−2) | Eonsetb (V vs. Ag/AgCl) | n/potential (V vs. Ag/AgCl) | Reference |
|---|---|---|---|---|---|
| a In O2-saturated 0.1 M KOH electrolyte at a potential scanning rate of 50 mV s−1.b In O2-saturated 0.1 M KOH electrolyte at a potential scanning rate of 10 mV s−1 with a rotation rate of 1600 rpm.c For comparison, the potentials in ref. 13 and 14 were converted to the EAg/AgCl according to the following equations: ESCE + 0.2438 V = EAg/AgCl + 0.1976 V and ERHE = EAg/AgCl + 0.965 V. | |||||
| Etched graphite | −0.34 | 1.38 | −0.12 | (2.5–3.9)/(−0.4 to −0.8) | This work |
| Graphene | −0.36 | 0.62 | −0.15 | (2.1–2.7)/(−0.4 to −0.9) | 11 |
| Carbon aerogel | −0.35 | 0.78 (mA mg−1) | −0.19 | (2.05–2.70)/(−0.4 to −1.0) | 12 |
| Carbon nanotubec | −0.35 | 0.44 | −0.19 | (2.21)/(−0.75) | 13 |
| Carbon nanofiberc | −0.34 | 1.22 | −0.15 | (2.28–2.51)/(−0.37 to −0.57) | 14 |
| Carbon nanoparticle | −0.30 | 1.13 | −0.22 | (2.40–2.70)/(−0.3 to −1.0) | 15 |
| Ordered mesoporous carbon | −0.32 | 0.84 | −0.23 | (1.84–2.64)/(−0.30 to −0.65) | 16 |
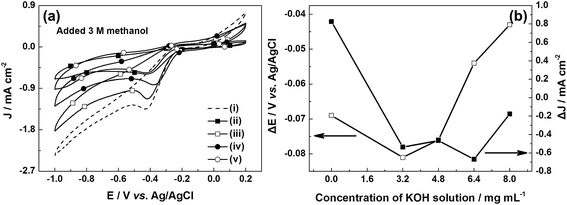
The methanol crossover effect of the electrocatalysts was examined by collecting the CVs for the ORR of all samples in O2-saturated 0.1 M KOH solution added 3 M methanol, as shown in Fig. 5a. The changes in the potential and the current density of the oxygen reduction peak can be calculated from the CVs in the solutions with and without 3 M methanol. The current density and potential are attenuated after methanol injection, indicating the deactivation of e-G catalysts by methanol attributed to the crossover effect. The attenuation degree of the current density and potential for e-G catalysts obtained in various KOH solutions follows the sequence 8.0 mg mL−1 < 4.8 mg mL−1 < 3.2 mg mL−1 < 6.4 mg mL−1 and 8.0 mg mL−1 < 6.4 mg mL−1 < 4.8 mg mL−1 < 3.2 mg mL−1, respectively, as can be seen in Fig. 5b. The results show that the e-G catalyst obtained at 8.0 mg mL−1 KOH solution represents a well tolerance to methanol poisoning effects. This is because the catalytic material is excessively etched by a high concentration of KOH solution and the catalytic area diminishes, causing a decrease in the number of active sites and thereby degrading the overall catalytic performance (see SEM and CV data). In this case, however, it makes no sense to study the properties of the catalytic material. The above results also reflect that the superior methanol tolerability of the e-G catalyst obtained at 4.8 mg mL−1 KOH solution, arising from the lower ORR potential on this catalyst than what required for methanol oxidation.38
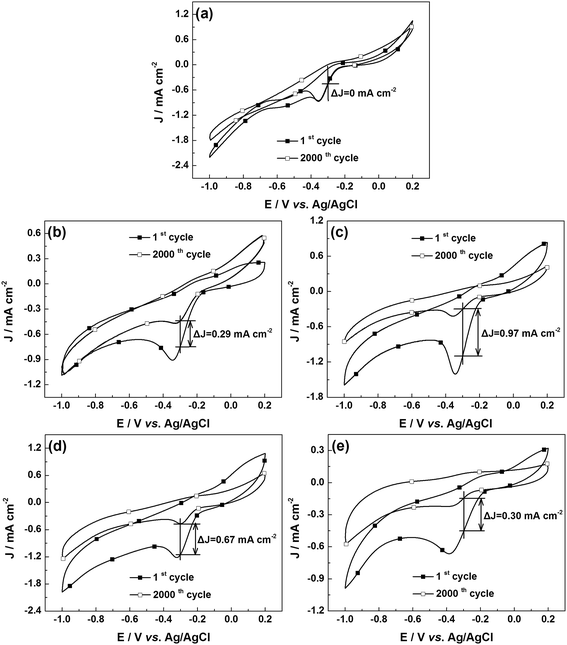
The stability is also one of the important indicators to evaluate fuel cell catalysts. Fig. 6 shows the CVs of the u-G and e-G catalysts after continuous CV scanning for 2000 cycles. The ΔJ-values of the u-G and e-G catalysts obtained at 3.2, 4.8, 6.4, and 8.0 mg mL−1 KOH solutions are gained as 0, 0.29, 0.97, 0.61 and 0.30 mA cm−2 respectively. The ΔJ-value is defined as the difference in current density between the first and the 2000th cycles at −0.3 V vs. Ag/AgCl. According to the ΔJ-values, the long-term stability of the u-G and e-G catalysts obtained at various concentrations of KOH solutions significantly enhances with the order of 4.8 mg mL−1 < 6.4 mg mL−1 < 8.0 mg mL−1 < 3.2 mg mL−1 < 0.0 mg mL−1. The experimental result combined with the CV data from Fig. 4b exhibits that a catalyst with good ORR activity possesses poor electrocatalytic stability.
The ORR mechanism in alkaline media includes two-electron pathway to produce HO2− and four-electron pathway to H2O (eqn (4) and (5)). The number of transferred electron and the yield of HO2− during the ORR process can be monitored by the RRDE measurements to verify the ORR catalytic pathways.
| O2 + H2O + 2e− = HO2− + OH− (two-electron pathway) | (4) |
| O2 + 2H2O + 4e− = 4OH− (four-electron pathway) | (5) |
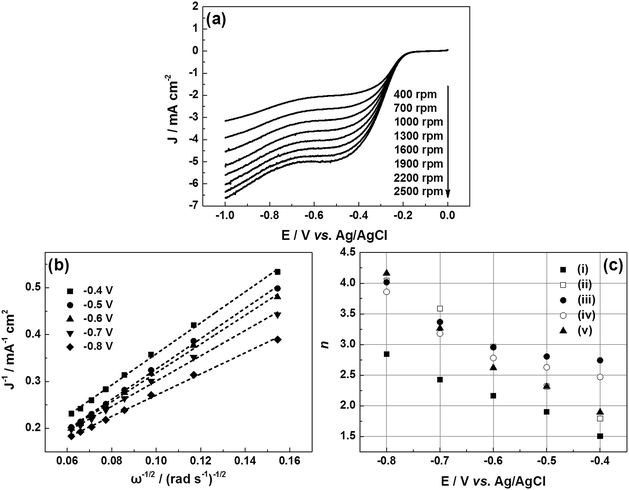
Fig. 7a displays a series of LSVs of the e-G catalyst obtained at 4.8 mg mL−1 KOH solution in O2-saturated alkaline solution at a potential sweep rate of 10 mV s−1 and at different rotation rates. It can be seen that the current density increases with increasing rotation speed. The corresponding Koutecky–Levich (K–L) plots are given in Fig. 7b. The slope of the K–L plots changes with the electrode potential, elucidating that the transferred electron number (n) at various potentials is non-constant. The n value of the catalysts during the oxygen reduction can be evaluated according to K–L equations (eqn (6) and (7)).39
 | (6) |
| B = 0.62nFCO(DO)2/3ν−1/6 | (7) |
![[thin space (1/6-em)]](https://www.rsc.org/images/entities/char_2009.gif) 485 C mol−1), CO is the bulk concentration of oxygen (1.2 × 10⁻³ mol L−1), DO is the oxygen diffusion coefficient (1.9 × 10⁻⁵ cm2 s−1), and ν is the kinematic viscosity of the electrolyte (1.13 × 10⁻² cm2 s−1).40,41 The n consumed per O2 molecule generally increases with the ORR overvoltage and is in the range from 2.5 to 3.9. The n value of the e-G catalysts obtained at 4.8 mg mL−1 KOH solution in the potential range from −0.4 to −0.8 V vs. Ag/AgCl is highest in all samples, as can be seen in Fig. 7c.
485 C mol−1), CO is the bulk concentration of oxygen (1.2 × 10⁻³ mol L−1), DO is the oxygen diffusion coefficient (1.9 × 10⁻⁵ cm2 s−1), and ν is the kinematic viscosity of the electrolyte (1.13 × 10⁻² cm2 s−1).40,41 The n consumed per O2 molecule generally increases with the ORR overvoltage and is in the range from 2.5 to 3.9. The n value of the e-G catalysts obtained at 4.8 mg mL−1 KOH solution in the potential range from −0.4 to −0.8 V vs. Ag/AgCl is highest in all samples, as can be seen in Fig. 7c.
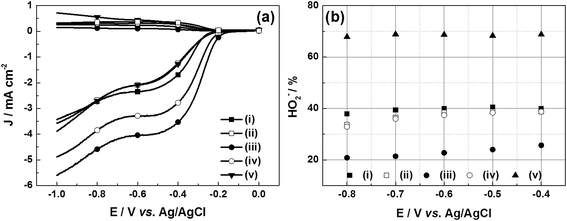
The RRDE polarization curves are obtained in 0.1 M KOH solution with saturated oxygen at a fixed rotation speed of 1600 rpm and a sweep rate of 10 mV s−1. Two parameters, the onset potential (Eonset), and the half-wave potential (E1/2), can be used to evaluate the ORR catalytic activity of different catalysts. They can be gained from the LSVs at the lower part in Fig. 8a. The Eonset and E1/2 values of all catalysts have been given, as shown in Table 3. It can be known from Table 3 that the two indicators of the e-G catalyst at 4.8 mg mL−1 KOH solution are about at −0.12 V and −0.33 V vs. Ag/AgCl respectively, which are higher than that of the other catalysts. In addition, the onset potential also indicates that this catalyst displays better charge transfer kinetics than the other previously reported carbon catalysts (see Table 2). These results demonstrate that this catalyst possesses the best ORR catalytic activity. The larger surface area and the higher carbon content by KOH activation treatment both work together for the improved reduction kinetics.
| Sample | (i) | (ii) | (iii) | (iv) | (v) |
|---|---|---|---|---|---|
| Eonset (V vs. Ag/AgCl) | −0.199 | −0.180 | −0.121 | −0.139 | −0.164 |
| E1/2 (V vs. Ag/AgCl) | −0.402 | −0.478 | −0.330 | −0.368 | −0.514 |
The collected HO2− yield of u-G and e-G catalysts obtained at various KOH concentrations on the RRDE during the oxygen reduction process can be calculated from the LSVs in Fig. 8a and eqn (8). The results are presented in Fig. 8b and it can be seen that the HO2− yields at −0.8 V vs. Ag/AgCl are 37.90%, 33.71%, 20.83%, 32.92% and 67.83% for the u-G and e-G catalysts obtained at the KOH solutions with a concentration of 3.2, 4.8, 6.4, and 8.0 mg mL−1, respectively. This is consistent with the result obtained from the K–L plots from the RDE measurements, suggesting the ORR of the e-G catalyst etched by 4.8 mg mL−1 KOH solution is mainly four-electron pathway.
 | (8) |
4. Conclusions
The graphite catalysts were obtained by hot filament chemical vapor deposition method and modified by chemical KOH etching approach. The refinement of the graphite film surface by using an appropriate concentration of KOH solution increases the surface area and generates more carbon edge active sites. Meanwhile the higher carbon content is retained under the same experimental condition. Thus the electrocatalytic activity of the e-G catalysts has been effectively improved. When the KOH concentration is moderate, the highest ORR electrocatalytic activity is achieved. As the KOH concentration continues to increase, the catalytic activity begins to deteriorate. In addition, it has been found that the catalysts with a high catalytic activity have good methanol resistance performance and poor catalytic stability instead.Conflicts of interest
There are no conflicts to declare.Acknowledgements
This study was supported by the National Key R&D Program of China (2016YFB0101206), the Fundamental Research Funds for the Central Universities (DUT17ZD101) and the National Natural Science Foundation of China (NSFC 51171033).References
- J. E. Choe, M. S. Ahmed and S. Jeon, J. Power Sources, 2015, 281, 211–218 CrossRef CAS.
- Y. Dong, Y. W. Zhou, M. Z. Wang, S. L. Zheng, K. Jiang and W. B. Cai, Electrochim. Acta, 2017, 246, 242–250 CrossRef CAS.
- Y. Zhao, L. J. Yang, S. Chen, X. Z. Wang, Y. W. Ma, Q. Wu, Y. F. Jiang, W. J. Qian and Z. Hu, J. Am. Chem. Soc., 2013, 135, 1201–1204 CrossRef CAS PubMed.
- A. A. Gewirth and M. S. Thorum, Inorg. Chem., 2010, 49, 3557–3566 CrossRef CAS PubMed.
- Y. Nie, L. Li and Z. D. Wei, Chem. Soc. Rev., 2015, 44, 2168–2201 RSC.
- Q. G. He, W. Chen, S. Mukerjee, S. W. Chen and F. Laufek, J. Power Sources, 2009, 187, 298–304 CrossRef CAS.
- J. Suntivich, H. A. Gasteiger, N. Yabuuchi, H. Nakanishi, J. B. Goodenough and Y. Shao-Horn, Nat. Chem., 2011, 3, 546–550 CrossRef CAS PubMed.
- H. L. Wang, Y. Y. Liang, Y. G. Li and H. J. Dai, Angew. Chem., Int. Ed., 2011, 50, 10969–10972 CrossRef CAS PubMed.
- J. B. Xu, P. Gao and T. S. Zhao, Energy Environ. Sci., 2012, 5, 5333–5339 RSC.
- A. Sarapuu, E. Kibena-Põldsepp, M. Borghei and K. Tammeveski, J. Mater. Chem. A, 2018, 6, 776–804 RSC.
- Z. H. Sheng, H. L. Gao, W. J. Bao, F. B. Wang and X. H. Xia, J. Mater. Chem., 2012, 22, 390–395 RSC.
- S. A. Wohlgemuth, R. J. White, M. G. Willinger, M. M. Titirici and M. Antonietti, Green Chem., 2012, 14, 1515–1523 RSC.
- S. Y. Wang, D. S. Yu and L. M. Dai, J. Am. Chem. Soc., 2011, 133, 5182–5185 CrossRef CAS PubMed.
- I. T. Kim, M. J. Song, S. Shin and M. W. Shin, Appl. Surf. Sci., 2018, 435, 1159–1167 CrossRef CAS.
- G. Panomsuwan, S. Chiba, Y. Kaneko, N. Saito and T. Ishizaki, J. Mater. Chem. A, 2014, 2, 18677–18686 RSC.
- X. J. Bo and L. P. Guo, Phys. Chem. Chem. Phys., 2013, 15, 2459–2465 RSC.
- G. Jürmann and K. Tammeveski, J. Electroanal. Chem., 2006, 597, 119–126 CrossRef.
- I. Kruusenberg, J. Leis, M. Arulepp and K. Tammeveski, J. Solid State Electrochem., 2010, 14, 1269–1277 CrossRef CAS.
- J. Lilloja, E. Kibena-Põldsepp, M. Merisalu, P. Rauwel, L. Matisen, A. Niilisk, E. S. F. Cardoso, G. Maia, V. Sammelselg and K. Tammeveski, Catalysts, 2016, 6, 108 CrossRef.
- Y. Zhao, R. Nakamura, K. Kamiya, S. Nakanishi and K. Hashimoto, Nat. Commun., 2013, 4, 2390 CrossRef PubMed.
- Y. Zhao, K. Kamiya, K. Hashimoto and S. Nakanishi, Angew. Chem., Int. Ed., 2013, 52, 13638–13641 CrossRef CAS PubMed.
- Y. Zhao, K. Kamiya, K. Hashimoto and S. Nakanishi, J. Phys. Chem. C, 2015, 119, 2583–2588 CrossRef CAS.
- Y. Zhao, K. Kamiya, K. Hashimoto and S. Nakanishi, J. Am. Chem. Soc., 2015, 137, 110–113 CrossRef CAS PubMed.
- J. H. Shim and S. Lee, J. Power Sources, 2016, 324, 475–483 CrossRef CAS.
- Z. Y. Zhang, J. Y. Xi, H. P. Zhou and X. P. Qiu, Electrochim. Acta, 2016, 218, 15–23 CrossRef CAS.
- Q. Cheng, R. Yuge, K. Nakahara, N. Tamura and S. Miyamoto, J. Power Sources, 2015, 284, 258–263 CrossRef CAS.
- K. D. Xia, Z. X. Wu, C. J. Xuan, W. P. Xiao, J. Wang and D. L. Wang, Electrochim. Acta, 2017, 245, 287–295 CrossRef CAS.
- N. Zhou, P. X. Qiu, H. Chen and F. Jiang, J. Taiwan Inst. Chem. Eng., 2017, 000, 1–8 CrossRef.
- M. A. Lillo-Ródenas, J. Juan-Juan, D. Cazorla-Amorós and A. Linares-Solano, Carbon, 2004, 42, 1371–1375 CrossRef.
- J. Wang and S. Kaskel, J. Mater. Chem., 2012, 22, 23710–23725 RSC.
- S. H. Yoon, S. Lim, Y. Song, Y. Ota, W. Qiao, A. Tanaka and I. Mochida, Carbon, 2004, 42, 1723–1729 CrossRef CAS.
- C. Z. Zhang, N. Mahmood, H. Yin, F. Liu and Y. L. Hou, Adv. Mater., 2013, 25, 4932–4937 CrossRef CAS PubMed.
- W. Qian, R. Hao, Y. L. Hou, Y. Tian, C. M. Shen, H. J. Gao and X. L. Liang, Nano Res., 2009, 2, 706–712 CrossRef CAS.
- Y. Y. Shao, S. Zhang, M. H. Engelhard, G. S. Li, G. C. Shao, Y. Wang, J. Liu, I. A. Aksay and Y. H. Lin, J. Mater. Chem., 2010, 20, 7491–7496 RSC.
- D. W. Wang, F. Li, Z. G. Chen, G. Q. Lu and H. M. Cheng, Chem. Mater., 2008, 20, 7195–7200 CrossRef CAS.
- G. J. Ehlert, Y. R. Lin and H. A. Sodano, Carbon, 2011, 49, 4246–4255 CrossRef CAS.
- X. Y. Zhang, W. H. He, R. F. Zhang, Q. Y. Wang, P. Liang, X. Huang, B. E. Logan and T. P. Fellinger, ChemSusChem, 2016, 9, 2788–2795 CrossRef CAS PubMed.
- K. P. Gong, F. Du, Z. H. Xia, M. Durstock and L. M. Dai, Science, 2009, 323, 760–763 CrossRef CAS PubMed.
- A. J. Bard and L. R. Faulkner, Electrochemical Methods: Fundamentals and Applications, Wiley, New York, 2nd edn, 2001 Search PubMed.
- X. M. Zhou, Z. Yang, H. G. Nie, Z. Yao, L. J. Zhang and S. M. Huang, J. Power Sources, 2011, 196, 9970–9974 CrossRef CAS.
- S. M. Zhu, Z. Chen, B. Li, D. Higgins, H. J. Wang, H. Li and Z. W. Chen, Electrochim. Acta, 2011, 56, 5080–5084 CrossRef CAS.
- Y. Y. Liang, Y. G. Li, H. L. Wang, J. G. Zhou, J. Wang, T. Regier and H. J. Dai, Nat. Mater., 2011, 10, 780–786 CrossRef CAS PubMed.
| This journal is © The Royal Society of Chemistry 2019 |

