 Open Access Article
Dual-response CuS@MnO2 nanoparticles with activatable CT/MR-enhanced in vivo imaging guided photothermal therapy
Hongbo Huang a,
Ke Lia,
Qingzhu Liua,
Yunlei Zhaoc,
Huiting Xub,
Wenjuan Wub,
Kairong Sunb,
Jianming Ni*b and
Jianguo Lin
 *a
*a
aKey Laboratory of Nuclear Medicine, Ministry of Health, Jiangsu Key Laboratory of Molecular Nuclear Medicine, Jiangsu Institute of Nuclear Medicine, Wuxi 214063, China. E-mail: linjianguo@jsinm.org
bDepartment of Radiology, Wuxi Second Hospital Affiliated to Nanjing Medical University, Wuxi, 214002, China. E-mail: jianming_ni@163.com
cCollaborative Innovation Center of Chemistry for Life Sciences, College of Engineering and Applied Sciences, Nanjing University, Nanjing, Jiangsu 210093, China
First published on 21st January 2019
Abstract
Although photothermal therapy (PTT) has been extensively applied in the treatment of cancer using various types of nanomaterials, low penetration of excitation light, low nanoparticle concentration enrichment and abominable nanoparticle permeation still remain huge obstacles in cancer therapy. Herein, we synthesized stable cupric sulfide nanoparticles (CuS NPs) with small size, which after functionalization with a MnO2 coating, were employed for diagnosing and treating tumors. After reacting with an RGD peptide, the nanoparticles were able to target and focus on tumor sites. Once the nanoparticles were enriched in tumors by RGD targeting, the MnO2 coating decomposed to Mn2+ ions in the tumor microenvironment. Meanwhile, the decomposition of MnO2 allowed the dispersion of aggregated CuS NPs to enter deep tumors, and a 1064 nm laser with powerful penetration was utilized to activate CuS NPs in deep tumors for PTT. More importantly, the generated Mn2+ ions were used for stimuli-enhanced T1-weighted magnetic resonance imaging (T1-MRI) and agminated CuS NPs in tumors were accepted for computed tomography (CT) imaging. It was found that these nanocomposites can accurately indicate tumor sites after being intravenously injected, and in vitro and in vivo experiments illustrated the tremendous potential of these nanoplatforms for use in imaging-guided PTT against HepG2 tumors.
Introduction
Cancer has become a major threat and challenge to human health,1–3 and various treatments have emerged.4–8 Photothermal therapy (PTT), a novel technique in tumor therapy research, has presented an excellent therapeutic effect and attracted increasing interest in recent years.9–14 Benefiting from effective fixed point therapy, shorter treatment time and low toxicity, the development of various new-style photothermal agents including metal or nonmetal nanoparticles and their compounds as well as many organic compounds, has become a hot topic in the area of PTT.15–19 In PTT, non-toxic nanoparticles are irradiated with a laser and constantly produce heat to increase the tumor temperature for ablating cancer cells, and once the temperature exceeds the critical endurance temperature, the apoptosis and death of cancer cells occurs.20–23 Moreover, nanoparticles with a high optical absorbance in the near-infrared (NIR) region show a huge advantage for PTT, attributed to the stronger penetration of NIR,24 and the nanoparticles can still be activated in deep tumors. Therefore, nanoparticles with a high thermal conversion efficiency and long wavelength absorption are popular choices.Theoretically, nanoparticles with superior biocompatibility when injected into the body can circulate in the blood and enrich tumors via an enhanced permeability and retention (EPR) effect.25 However, the majority of small nanoparticles with excellent penetration cannot aggregate in tumors via the EPR effect, thus, polymerizing small scale nanoparticles to form new nanoparticles with a suitable size distribution for passive targeting into tumors as a simple and convenient method has been attracting an increased amount of attention. Even so, most of the nanoparticles circulating in the blood are ingested by other organs, which has a serious impact on the normal running of these organs. Therefore, developing a nanoparticle with outstanding tumor targeting ability can improve the curative effect and effectively reduce damage to other tissues.
It is well known that mild acidic conditions, extreme hypoxia and an excess of H2O2 constitute essential elements of the tumor microenvironment,26 requirements different from those of a normal tissue microenvironment. And, it is because of these factors that cancer cells have a malignant proliferation capacity and powerful viability. Through in-depth research, more and more studies have confirmed that the improvement in the microenvironment of tumors to some extent contributes to oncotherapy.27 On the other hand, designing a nanoplatform that responds to the tumor microenvironment is also a critical factor, one that can function in tumors and avoid unnecessary physical harm to normal tissue. MnO2 as a traditional catalyst has the ability to decompose H2O2 to generate O2 in the presence of H+.28 And, the remission of tumor hypoxia can improve the tumor microenvironment for an improvement in tumor progression to a certain degree.27 More importantly, MnO2 can be converted to Mn2+ under acidic conditions for stimuli-enhanced T1-weighted magnetic resonance imaging (T1-MRI),29 from which tumor sites can be accurately tracked and precisely treated.
In this work, a multifunctional nanoplatform with tumor microenvironment response and improvement was synthesized for use in PTT. Copper sulfide nanoparticles (CuS NPs) with a small diameter and diameter distribution were covered with a MnO2 coating to form an agglomerate, and a RGD peptide, which has proven to be excellent in the targeting of tumor sites,30,31 was connected to the surface of MnO2 for the targeting of tumor sites. When the nanoplatform was intravenously injected into mice, the nanoplatform quickly enriched tumors under the action of RGD, and was swallowed up by cancer cells. Subsequently, the external MnO2 coating reacted with H2O2 under acidic conditions in the tumors, and O2 generated by H2O2 was propitious in the remission of the hypoxia of tumors, which was conducive to improving the tumor microenvironment for tumor therapy. At the same time, CuS NPs were dispersed and ingested by deep tumor cancer cells, and a 1064 nm laser with superior penetration was used to activate the CuS NPs in the deep tumors, resulting in superior PTT. Moreover, the scattered CuS NPs were utilized to mark tumors by computed tomography (CT) imaging, and the Mn2+ ions newly generated from MnO2 were used for T1-MRI to indicate the sites of the tumors. Our work demonstrates that this nanoplatform, with tumor targeting ability that improves the tumor microenvironment, exhibits enormous potential in the diagnosis and treatment of tumors.
Experimental section
Materials and methods
Mercaptoacetic acid (AR), potassium permanganate (KMnO4, AR), cupric chloride (CuCl2·2H2O, AR), anhydrous ethanol (AR), monometallic sodium orthophosphate and sodium hydroxide (NaOH, AR) were obtained from Shanghai Lingfeng Chemical Reagent Co. Ltd. (Shanghai, China). Thioacetamide, poly(allylamine hydrochloride) (PAH, MW = 15![[thin space (1/6-em)]](https://www.rsc.org/images/entities/char_2009.gif) 000–20
000–20![[thin space (1/6-em)]](https://www.rsc.org/images/entities/char_2009.gif) 000), thiol-fluorescein polyethylene glycol isothiocyanate (SH-PEG-FITC) and polyethylene glycol (PEG, MW = 2000) were supplied from J&K Science (Beijing, China). SH-RGDGGGC was purchased from Bankpeptide (Hefei, China). Fetal bovine serum (FBS), 4′,6-diamidino-2-phenylindole (DAPI), Annexin V-FITC apoptosis staining/detection kit, LysoTracker Red DND-99 Kit, 3-(4,5-dimethylthiazol-2-yl)-2,5-diphenyltetrazolium bromide (MTT), H2O2 assay kit, trypsin and Dulbecco's modified Eagle medium (DMEM) were purchased from KeyGEN BioTECH (Nanjing, China). Both the human liver hepatocellular carcinoma cells (HepG2) and human normal liver cells (L02) were obtained from the Shanghai Institute of Cell Biology (Shanghai, China). The nude mice (male, 4–6 weeks) were obtained from the Comparative Medicine Centre of Yangzhou University. Animal experiments were allowed by the Care Committee of Nanjing University (including guidelines for animal care & use, and guidelines for the euthanasia of mice, protocol #: 20170411-015).
000), thiol-fluorescein polyethylene glycol isothiocyanate (SH-PEG-FITC) and polyethylene glycol (PEG, MW = 2000) were supplied from J&K Science (Beijing, China). SH-RGDGGGC was purchased from Bankpeptide (Hefei, China). Fetal bovine serum (FBS), 4′,6-diamidino-2-phenylindole (DAPI), Annexin V-FITC apoptosis staining/detection kit, LysoTracker Red DND-99 Kit, 3-(4,5-dimethylthiazol-2-yl)-2,5-diphenyltetrazolium bromide (MTT), H2O2 assay kit, trypsin and Dulbecco's modified Eagle medium (DMEM) were purchased from KeyGEN BioTECH (Nanjing, China). Both the human liver hepatocellular carcinoma cells (HepG2) and human normal liver cells (L02) were obtained from the Shanghai Institute of Cell Biology (Shanghai, China). The nude mice (male, 4–6 weeks) were obtained from the Comparative Medicine Centre of Yangzhou University. Animal experiments were allowed by the Care Committee of Nanjing University (including guidelines for animal care & use, and guidelines for the euthanasia of mice, protocol #: 20170411-015).
Synthesis of CuS nanoparticles
The synthesis process of CuS NPs was the same as that detailed in previous reports.32 17 mg of CuCl2·2H2O was dissolved in 100 mL of deionized water at 50 °C for 30 min. Then, 14.2 μL of mercaptoacetic acid was added and the mixture was kept at 50 °C under stirring for another 10 min. Subsequently, the solution was adjusted with NaOH (0.1 mM) to maintain a pH of 8 to 9, and 10 mL of deionized water containing 8 mg of thioacetamide was added. The mixture was reacted at 50 °C overnight. Finally, the samples were collected by adding an appropriate amount of monometallic sodium orthophosphate and centrifuging at 16![[thin space (1/6-em)]](https://www.rsc.org/images/entities/char_2009.gif) 000 rpm for 10 min. The obtained solid products were washed with anhydrous ethanol and deionized water several times.
000 rpm for 10 min. The obtained solid products were washed with anhydrous ethanol and deionized water several times.
Synthesis of CuS@MnO2 nanoparticles
10 mg of CuS NPs was dispersed in 50 mL of deionized water with stirring for 30 min at room temperature. Then, 0.1 mg of KMnO4 was dissolved in 1 mL of deionized water, and transferred into the CuS mixture. After 30 min of stirring, 1 mg of PAH and 1 mg of PEG were added into the solution. The mixture was stirred until the solution color turned from purple red to brown. Finally, the product was collected and washed.Synthesis of CuS@MnO2–RGD nanoparticles
The as-obtained CuS@MnO2 NPs were dispersed in 50 mL of deionized water at room temperature, 5 mg of SH-RGDGGGC was added, the mixture was stirred for 24 h at 25 °C. Then, the CuS@MnO2–RGD NPs were separated by centrifugation and washed and dried.Analogously, FITC was linked to CuS@MnO2 or the CuS@MnO2–RGD NPs by adding 5 mg of SH-PEG-FITC. The reaction was conducted in deionized water for 24 h and the final products (CuS@MnO2–FITC and CuS@MnO2–RGD/FITC) were collected, washed and dried.
Characterization
The morphologies of the samples were measured by transmission electron microscopy (TEM, JEOL, TEM-2100), and the mean size and size distribution were measured by dynamic light scattering (DLS, BI-90Plus, Brookhaven). Powder X-ray diffraction (XRD, Bruker, λCu,Kα = 1.5418 Å) was used to verify the crystalline phases of the samples. UV-vis spectrophotometry was used to determine the UV-vis absorbance spectra (UV3100, Shimadzu, Japan). The thermal stabilities of the dry samples were detected by thermogravimetric analysis (TGA, Model TA2100, TA Instruments, USA) under the protection of N2 at a heating rate of 10 °C min−1 over the range of 50–700 °C. The dissolved oxygen assay was performed by a JPB-607A dissolved oxygen meter (Rex Electric Chemical, China).In vitro cytotoxicity assay (MTT assay)
HepG2 and L02 cells were purchased from the Shanghai Institute of Cell Biology and incubated under the recommended conditions. To determine the biocompatibility of the nanoparticles, the HepG2 and L02 cells preseeded into 96-well plates (8 × 10³ cells per well) were cultured with different concentrations of CuS@MnO2–RGD for 24 or 48 h. Then, 20 μL of MTT (5 mg mL−1) was added, and the relative cell viabilities were measured using an enzyme-linked immunosorbent assay instrument, with the characteristic absorption of MTT at 490 nm.Intracellular internalization analysis
To determine the cellular uptake efficiencies, CuS@MnO2–RGD was modified with SH-PEG-FITC and HepG2 cells preseeded into glass bottomed dishes were incubated with 100 μL of CuS@MnO2–RGD/FITC (5 mg mL−1) for 2 h. After washing with PBS twice, the HepG2 cells were incubated with 5 μL of DAPI and 5 μL of LysoTracker Red DND-99 Kit. Notably, the HepG2 cells were exposed to a laser with an excitation wavelength of 405 nm and an emission wavelength of 425 nm to indicate the nucleus, and exposed to a laser with an excitation wavelength of 488 nm and an emission wavelength of 625 nm to indicate the lysosome.In vitro PTT study
For in vitro treatment effect, HepG2 cells were incubated with 200 μL of CuS@MnO2–RGD (5 mg mL−1) and irradiated with a 1064 nm laser (500 mW cm−2) for 10 min. The treated cells were digested by trypsin and stained with an Annexin V-FITC apoptosis staining/detection kit, and the suspended cells were detected by flow cytometry (DxFLEX, Beckman Coulter).In vivo PTT study
The nude mice (male, 4–6 weeks) were obtained from the Comparative Medicine Centre of Yangzhou University, and inoculated in the subcutaneous right forelimb armpit with HepG2 cells (1 × 10⁷ per mice). In order to investigate the therapeutic effects of this nanoplatform, 200 μL of CuS@MnO2 and the CuS@MnO2–RGD NPs were separately injected into the nude mice via tail vein injection. 12 h post-injection, the HepG2-tumor-bearing nude mice were anaesthetized and placed on the workbench. The use of a 1064 nm laser (500 mW cm−2) was to activate the CuS@MnO2 and CuS@MnO2–RGD NPs and the real-time temperature was recorded. Moreover, the thermal cycling performance was investigated by repeating the heating and cooling processes.Fluorescence/MR/CT imaging in vivo
For the diagnosis of the tumor, fluorescence imaging, computed tomography (CT) imaging and magnetic resonance imaging (MRI) were used to indicate the tumor sites. Briefly, HepG2-xenograft-bearing mice were injected with 200 μL of the samples. 24 h later, the fluorescence signals were detected by an imaging system (Xtreme II, BRUKER), the HU (Hounsfield unit) values in the tumor sites were detected by a micro-CT (LCT-200, Hitachi-Aloka), and the T1-weighted MRI was conducted with an animal MR scanner (Biospec 7T/20 USR, BRUKER).Biodistribution analysis
As a metallic material, the in vivo distribution conditions were necessary to detect, therefore, the mice were sacrificed at different periods of time (1, 2, 4, 8 and 24 h) and the tumor, heart, liver, spleen, lung and kidney were harvested and weighed. The tumors and primary organs were subsequently dissolved in fresh aqua regia. The concentration of Cu was quantified by inductively coupled plasma mass spectrometry (ICP-MS, ELEMENT 2HR, Thermo).Micro-PET imaging
In order to verify the hypoxic condition in tumors after injecting with CuS@MnO2–RGD NPs, the mice model were intravenously injected with 100 μL of saline containing 18F fluoromisonidazole (18F-MISO) (75 μCi per mouse). 1 h later, the mice were anaesthetized and detected by micro PET-CT (Inveon). All of the data were analyzed on the workstation.In vivo antitumor effects
After inoculating with HepG2 cells, the tumors grew rapidly and once the volume of the tumors reached 100 mm3, the mice were divided into 6 groups (10 per group) for various treatments: saline group, NIR group, mice intravenously injected with 200 μL of CuS@MnO2 with or without laser irradiation (500 mW cm−2, 10 min) and mice intravenously injected with 200 μL of CuS@MnO2–RGD with or without laser irradiation (500 mW cm−2, 10 min). After 24 h post injection, the tumor sites of the mice treated with CuS@MnO2 or CuS@MnO2–RGD were irradiated with a 1064 nm laser for 15 min (500 mW cm−2), the body weights and tumor volumes were recorded every day. The mice treated with CuS@MnO2–RGD and irradiated by a 1064 nm laser were sacrificed at different periods of time (1, 7, 15 and 30 days) during therapy, and on 14th day, the mice treated with different methods were sacrificed, and the tumors were collected for Hematoxylin and Eosin (H&E), TUNEL, ki67 and Hif-1α staining. Besides this, research into survival prospects was launched using half of the mice.Hematology and biochemical assay
In order to study the harm from the treatment in terms of long-term cytotoxicity, blood analysis and histology examinations were conducted. The HepG2-xenograft-bearing mice were sacrificed and their major organs (heart, liver, spleen, lung and kidney) were harvested and stored in 4% formalin for H&E staining. Meanwhile, the blood was also collected for blood biochemistry examination. Specifically, all of the sections were prepared by the Nanjing Pharmaceutical Company and observed with a fluorescence microscope (IX71, Olympus).Statistical analysis
All of the data (repeated three times) in this work were calculated by Student's t-test using the GraphPad Prism (version 7.5) software, with a significance level of p < 0.05. Asterisks are used to indicate the significant differences.Results and discussion
Synthesis and characterization of the nanoparticles
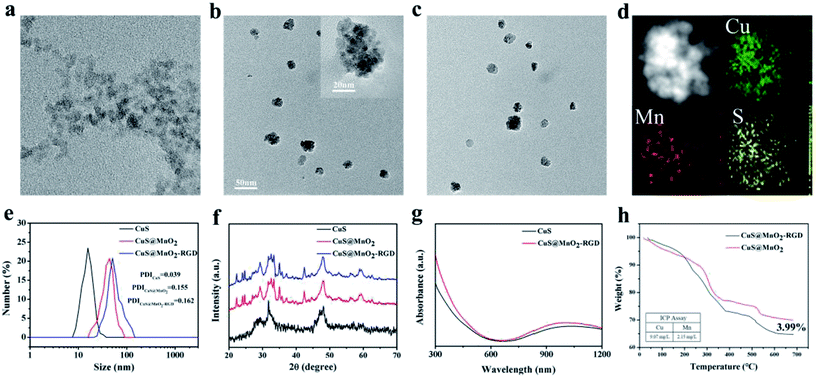
The morphologies and sizes of the nanoparticles were characterized by TEM. As presented in Fig. 1a, the CuS NPs have a near-spherical shape, with a mean size of 10 nm. After encapsulating with MnO2, some of CuS NPs aggregated into a big sphere, and quite a lot of the CuS NPs were observed in the CuS@MnO2 NPs by high-resolution transmission electron microscopy (inset in Fig. 1b). The nanoparticles with a size of 40–50 nm (Fig. 1b) exhibited excellent dispersion and met the requirements of EPR. Similarly, the CuS@MnO2–RGD NPs had superior dispersion and no significant differences were observed in Fig. 1c, after RGD was connected to CuS@MnO2. Sectional energy-dispersive spectroscopy (EDS) was used to determine the major elements, Mn, Cu and S, in the CuS@MnO2-RDG NPs (Fig. 1d). Moreover, as illustrated in Fig. 1e, the corresponding size distribution of CuS@MnO2–RGD in PBS (pH = 7.4) was obviously larger than that of CuS@MnO2, from which we could confirm that RGD was linked to the surface of MnO2 via a coordinate bond. XRD was used to check the crystal structure of the products (Fig. 1f), and compared with the CuS NPs, all of the characteristic peaks of MnO2 were observed in CuS@MnO2 and the CuS@MnO2–RGD NPs, indicating the existence of the MnO2 coating, and that the modification of RGD had almost no effect on the crystal structure of the CuS@MnO2 NPs. Furthermore, as a photothermal material for PTT, the UV-vis absorption spectra were recorded to determine the maximum absorption intensity of the CuS@MnO2–RGD NPs. As depicted in Fig. 1g, an upward curve was observed for the CuS@MnO2–RGD NPs and the culmination could be determined at 1064 nm, which had a stronger tissue penetration to activate CuS NPs in deep tissue. Finally, the CuS@MnO2–RGD NPs were analyzed by ICP and TG assay (Fig. 1h). About 3.99% of RGD in these nanoparticles was found to be linked to the surface of the CuS@MnO2 NPs, and the content ratio of Cu to Mn was about 4.22 in these nanoparticles. All of the above results illustrate that the nanoplatform with a suitable size distribution was successfully synthesized, with a formidable light absorbing capacity at 1064 nm.In vitro biocompatibility and cytotoxicity profiles
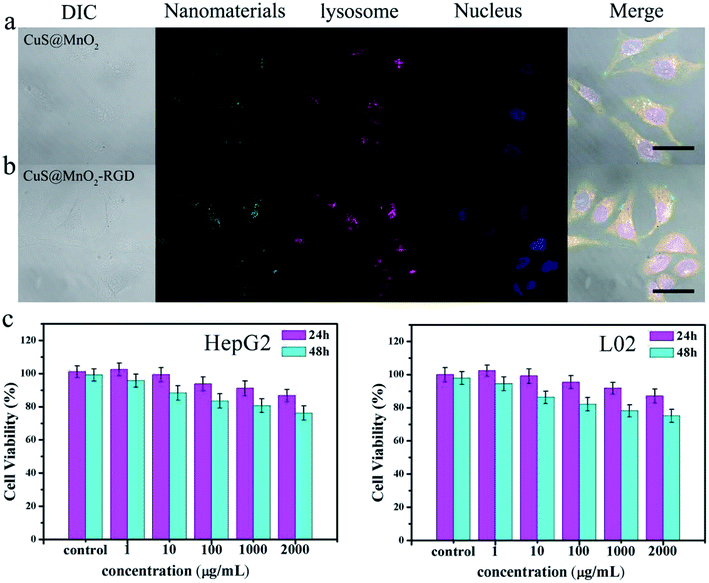
A nanoplatform with eximious biocompatibility and low toxicity are essential preconditions for application in the body. So, an intracellular internalization experiment and MTT analysis were used to verify the biocompatibility of the CuS@MnO2–RGD NPs. Firstly, the nanoparticles were modified with SH-PEG-FITC and then cultured with HepG2 cells. After incubating for 2 h, the cells were stained and observed. As seen in Fig. 2a and b, the blue-marked nucleus, green-marked nanoparticles and red-marked lysosome were observed in the HepG2 cells. Quite evidently, the green fluorescence was overlapped with the red fluorescence inside the cytoplasm and there was no overlap between the green fluorescence and blue fluorescence, suggesting that the nanoparticles with their great biocompatibility were swallowed via endocytosis and could not enter into the nucleus. Additionally, compared with the CuS@MnO2 NPs, more CuS@MnO2–RGD NPs were swallowed up by the HepG2 cells, owing to the recognition of RGD. Moreover, the HepG2 cells were incubated with the nanoparticles in order to examine their cytotoxicity by MTT. The nanoparticles exhibited obviously lower toxicity against the HepG2 and L02 cells (Fig. 2c), and even when the cells were incubated with 2000 μg mL−1 of CuS@MnO2–RGD NPs for 48 h, the cell viability was still over 80%. These results illustrate that the nanoplatform with its superior biocompatibility and low toxicity has great potential for biological application.In vitro curative effect of PTT
The in vitro curative effect of PTT was measured by flow cytometry. As shown in Fig. 3, the HepG2 cells were treated under different experimental conditions, and a small number of cells were observed to die without NIR irradiation, illustrating that the nanoparticles or NIR irradiation cause relatively minor injuries to HepG2 cells. However, a large number of cells were observed to undergo apoptosis or die when treated with CuS@MnO2 or CuS@MnO2–RGD NPs and exposed to 1064 nm irradiation, suggesting that the nanoparticles show great toxicity against HepG2 cells when irradiated by a 1064 nm laser. Moreover, no obvious differences in the treatment effect were observed in the CuS@MnO2 with 1064 nm laser group and CuS@MnO2–RGD with 1064 nm laser group, probably due to the slight influence of RGD in the cell experiments. The results of the MTT test and flow cytometric analysis demonstrate that the nanoplatform has excellent therapeutic effect under NIR irradiation, which could be used as a switch for fixed-point therapy.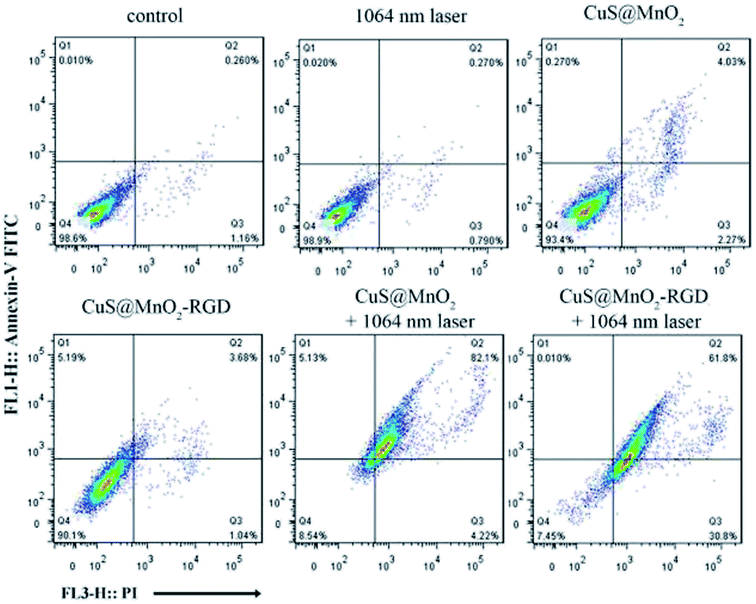 | ||
| Fig. 3 The HepG2 cells were treated with different processing methods as displayed and detected by flow cytometry using an Annexin V-FITC apoptosis staining/detection kit. | ||
In vivo PTT efficacy
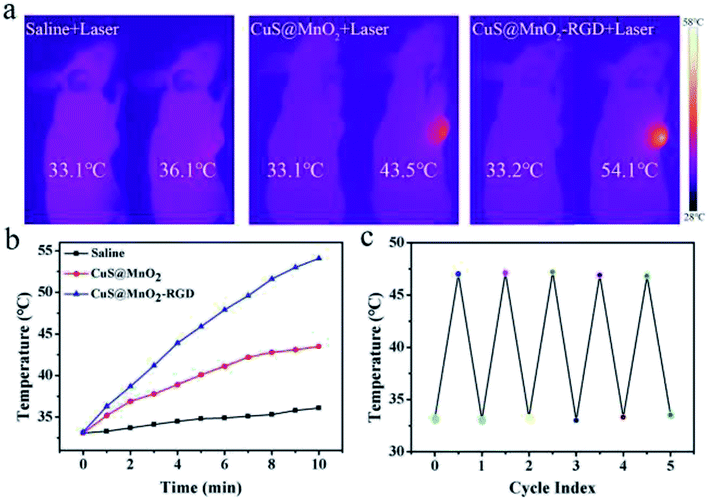
CuS NPs with outstanding light-thermal conversion efficiency were tested for PTT in this nanoplatform. Hence, we adopted a 1064 nm laser as a light source to activate the CuS NPs, which absorbed NIR light and converted it to heat for PTT. As seen in Fig. 4a, HepG2-xenograft-bearing mice were treated with different approaches and irradiated with 1064 nm irradiation for 10 min (500 mW cm−2). Compared with the saline group, the temperature at the tumor sites rose far more steeply in the CuS@MnO2 and CuS@MnO2–RGD NPs groups under NIR irradiation, and benefiting from the RGD around the nanoparticles, a larger amount of CuS@MnO2 was able to concentrate in the tumors, meaning that more CuS NPs could be enriched in the tumors and that the temperature of the tumors increased for superior PTT. All of the data was recorded and is shown in Fig. 4b. The thermal cycling performance was also conducted, and as shown in Fig. 4c, the nanoparticles could be used repeatedly. Taken together, the nanoplatform in this work exhibited excellent light-thermal conversion efficiency and thermal cycling performance for PTT.Fluorescence imaging analysis
In order to determine whether the nanoparticles had been enriched in the tumors, fluorescence imaging was used to mark the nanoplatform in mice. As illustrated in Fig. 5, the CuS@MnO2 and CuS@MnO2–RGD NPs were modified with SH-PEG-FITC, and the HepG2-xenograft-bearing mice were intravenously injected with 200 μL of the nanoparticles, respectively. After injection for 24 h, fluorescence signals were detected in the tumors and livers, and compared with the CuS@MnO2 NPs, more CuS@MnO2–RGD NPs were found in the tumors owing to the targeting capacity of RGD. Therefore, the CuS@MnO2–RGD NPs showed an excellent accumulation effect for use in further tumor therapy.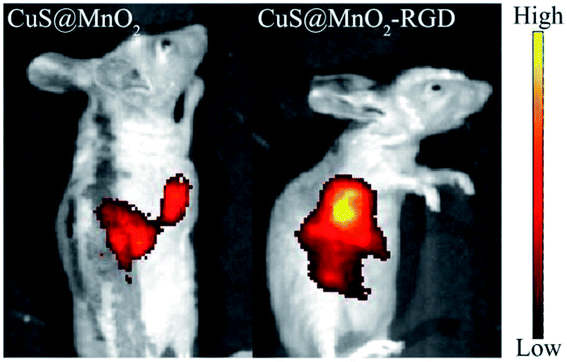 | ||
| Fig. 5 In vivo fluorescence imaging of CuS@MnO2 and CuS@MnO2–RGD after injection for 8 h, the nanoparticles were both modified with SH-PEG-FITC. | ||
CT imaging detection
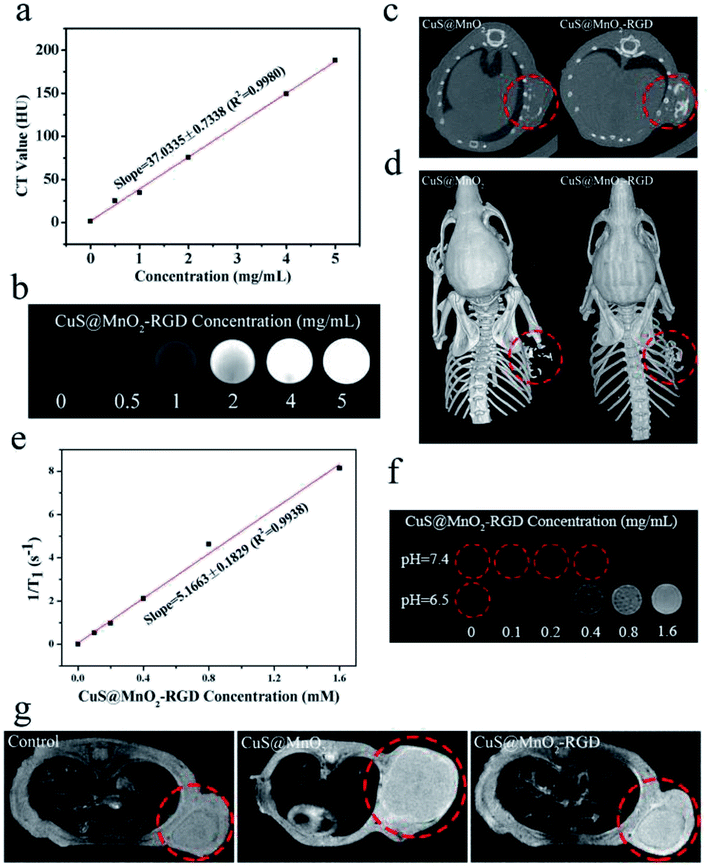
CT imaging, an important diagnostic tool used in clinical diagnosis, was carried out to detected tumors in this work. As seen in Fig. 6a, the contrast ratio gradually increased upon an increase in the nanoparticle concentration, and the linear relationship is presented in Fig. 6b. For in vivo CT detection, the same as in the fluorescence imaging, the mice were treated with the CuS@MnO2 or CuS@MnO2–RGD NPs, and then the CT signals were measured by a CT machine. As depicted in Fig. 6c, both CT signals were clearly observed in tumors, while no CT signals were detected in the control group. Moreover, benefiting from a three dimensional reconstruction technique, the 3D imaging was carried out and the results are presented in Fig. 6d. More nanoparticles were seen to obviously converged in the tumors when modified with RGD, suggesting that the CuS@MnO2–RGD NPs had better diagnostic ability than that of the CuS@MnO2 NPs.MRI detection
Compared with CT imaging, MRI is a more sensitive means of detection, and under acidic conditions, the external MnO2 coating could decompose to Mn2+ ions, to be used for T1-weighted MRI. The experimental procedure was similar to that used for the CT imaging, and T1-weighted MRI was conducted using an animal MR scanner. From Fig. 6e, it can be seen that the CuS@MnO2–RGD NPs were treated with H2O2 under acidic conditions for 4 h, resulting in a significant linear relationship being observed between 1/T1 and the CuS@MnO2–RGD concentration. Moreover, a T1 signal was observed when the nanoparticles were treated with H2O2 and H+, and the signal intensity was strongly dependent on the concentration (Fig. 6f). In Fig. 6g, it can be observed that the brightness of the tumor sites in treated mice is higher than that of other parts, indicating that the T1 signal from Mn2+ was detected in tumors, while no comparable signals were detected in the control group, and the signals in mice treated with the CuS@MnO2–RGD NPs were greater than those of mice treated with the CuS@MnO2 NPs. Therefore, the results of the fluorescence imaging, CT imaging and MRI were similar, indicating that the CuS@MnO2–RGD NPs have superior diagnostic ability for marking tumors, and that under their guidance, we were able to accurately locate the sites of tumors and use a NIR laser for fixed-point PTT.Biodistribution analysis
After injection with the CuS@MnO2–RGD NPs, mice bearing HepG2 tumors were sacrificed at different time points, and the major organs (heart, liver, spleen, lung and kidney) and tumors were collected and weighed for ICP-MS. As shown in Fig. 7, the nanoparticles were enriched in the liver at the beginning, and as time went by the nanoparticles gradually shifted to the tumors. Around 8 hours later, the amount of nanoparticles in the tumors reached a maximum, then a spot of nanoparticles was excluded from tumors. Similarly, the nanoparticles were gradually eliminated in the other organs. Moreover, more CuS NPs gathered in tumors as a result of the presence of RGD, and the therapeutic effect of the CuS NPs was greatly improved and the impact on the other organs was reduced to a minimum. These results were coincident with those of the fluorescence imaging, CT imaging and MRI, illustrating the great ability of the nanoparticles to accumulate in tumors.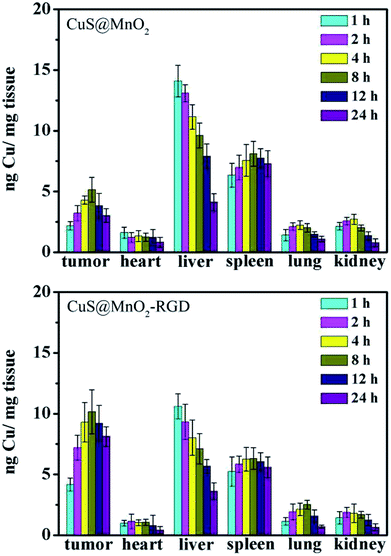 | ||
| Fig. 7 In vivo distribution profiles of CuS@MnO2 and CuS@MnO2–RGD in the tissues of HepG2-tumor-bearing mice at different time points post i.v. injection. | ||
In vivo antitumor effect
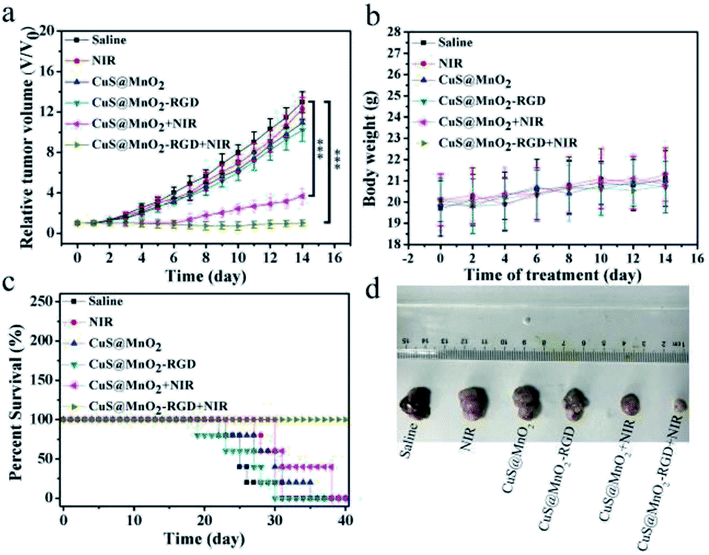
To investigate the treatment effect of the nanoplatform, the mice were inoculated with HepG2 cells and injected with saline, CuS@MnO2 NPs or CuS@MnO2–RGD NPs, and the tumor volume, body weight and survival condition were recorded every two days (Fig. 8a–c). The tumor volume of the mice treated with the CuS@MnO2 NPs or CuS@MnO2–RGD NPs under 1064 nm laser irradiation were obviously suppressed and appeared to show a decreasing trend, and the curative effect of the CuS@MnO2–RGD NPs was slightly better than that of the CuS@MnO2 NPs owing to the great enrichment of the CuS NPs in the tumors. However, the tumors rapidly grew in other groups until they brought about death. Typical pictures of the tumors are presented in Fig. 8d. In addition, the body weight showed a slight decrease at the beginning, and eventually settled around the range of initial values, illustrating the low acute toxicity of the treatment process. Furthermore, the mice treated with the CuS@MnO2–RGD NPs under NIR laser irradiation were predicted to survive, but a large number of deaths had occurred in the group of the mice treated with the CuS@MnO2 NPs under NIR laser irradiation by the end of the experiment. More seriously, the mice in the other groups all died due to a deterioration in their health brought about by the presence of the tumors. All of the results demonstrated that the CuS@MnO2–RGD NPs had an excellent antitumor effect when exposed to NIR irradiation.The mice were treated with different approaches, sacrificed on the 14th day, and the tumors were harvested and treated with different kits. As shown in Fig. 9, tunel staining was used to research the tissue apoptosis, and a high degree of apoptosis (green) was observed in the treatment group, particularly for the CuS@MnO2–RGD NPs group, while the pure nanoparticles and irradiation alone did not cause any damage to the tumors. H&E staining was adopted to study the tissue morphology. The treatment tumors were significantly different from those of the control groups, with high degrees of necrosis and apoptosis observed in the treatment groups and the nuclei in the tumors showed signs of atrophy or cracking into small fragments. This indicated that tumor tissue was destroyed by PTT, and that the change in the tissue was more pronounced for the CuS@MnO2–RGD NP group. Ki67 staining was used to investigate the proliferation of the tumors. The ki67 factor (gray) was markedly reduced in the mice treated with nanoparticles, and the inhibition from the CuS@MnO2–RGD NPs was more obvious, resulting in a decrease in the size of the tumors. HIF-1α staining was utilized to test the hypoxic environment, and after treating with the nanoplatforms, the microenvironment was obviously improved, the hypoxic environment had been alleviated. These results all indicate that the CuS@MnO2–RGD NPs have great potential for PTT application in cancer therapy and in improving the tumor microenvironment.
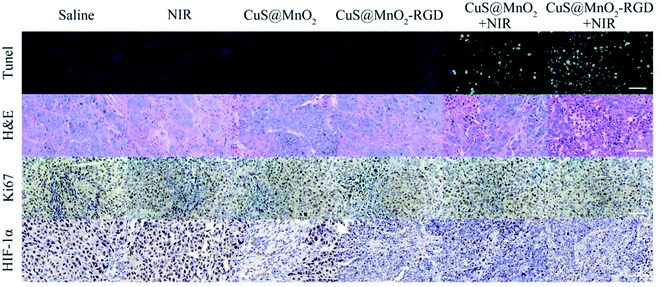 | ||
| Fig. 9 Tunel, H&E, ki67 and HIF-1α staining of HepG2 tumors after different treatments. The scale bars are all 50 μm. | ||
PET Imaging
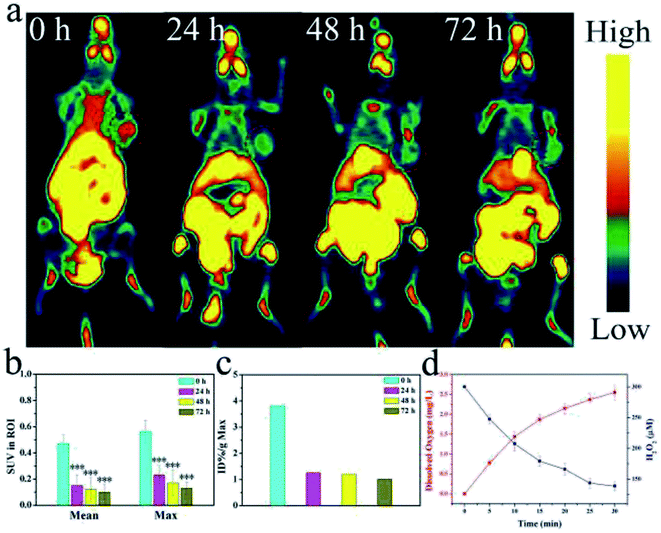
To verify the oxygen generating capacity from MnO2, PET-CT testing was used to test the hypoxic conditions in mice treated with CuS@MnO2–RGD NPs. As shown in Fig. 10a, the mice were injected with CuS@MnO2–RGD NPs and monitored using a PET-CT scanner at 24, 48 and 72 h. Positive changes were observed, and the degree of hypoxia significantly improved. Therefore, the nanoplatforms could be adopted to decompose H2O2 to generate O2, which could be used for improving the microenvironment of tumors. This improvement was propitious to the treatment to some extent. Besides this, the amount of 18F-MISO was quantified and the results are shown in Fig. 10b and c. These measurements were used to accurately determine the tumor hypoxia conditions, and the results was observed to be obviously consistent with the above data. Moreover, the dissolved oxygen assay is presented in Fig. 10d, and the H2O2 content was observed to reduce, while the O2 content rapidly increased, illustrating that H2O2 decomposed into O2 for hypoxia remission.Long-term cytotoxicity
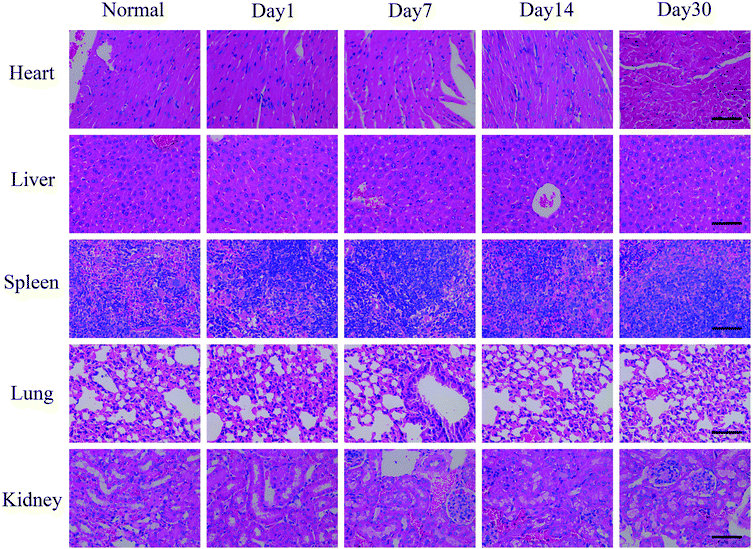
For test the long-term toxicity, mice treated with the CuS@MnO2–RGD NPs under NIR irradiation were sacrificed, and the blood and tumors were collected for hematology and histological analysis. As illustrated in Fig. 11, the liver function was evaluated by the total bilirubin level (TBIL), the alanine aminotransferase (ALT) and total protein (TP) level, the kidney function was accessed by the blood urea nitrogen (BUN) and creatinine (CRE) levels, and the spleen function was detected by the production of platelets (PLT). In addition, neutrophils (NEU), lymphocytes (LYM) and monocytes (MON) were used to measure the immune response, and the cytotoxicity of the treatment process was verified by looking at the eosinophils (EOS), red blood cell (RBC) levels and behavioral approach system (BAS). Although these indicators expressed some degree of volatility, they were all around the standard values. This provides evidence that the treatment did little damage to the body. Furthermore, the H&E staining of the major organs (heart, liver, spleen, lung and kidney) at different time periods during the treatment process was undertaken and the results are shown in Fig. 12. Compared with the control group, in the treatment group nothing had changed in these organs, which was consistent with the results of the hematology analysis. These results therefore sufficiently indicated the low toxicity of the treatment in this work.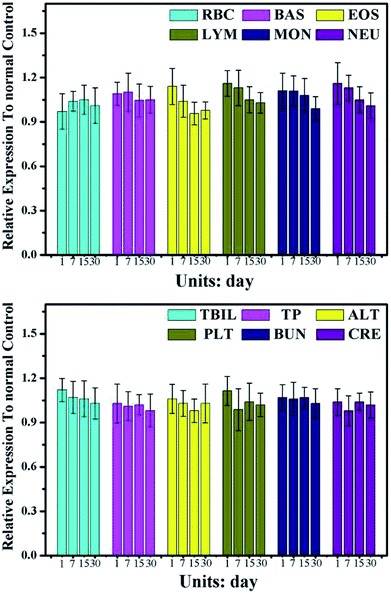 | ||
| Fig. 11 Serum biochemical study 1, 7, 15, and 30 days after PTT treatment rendered by CuS@MnO2–RGD with a 1064 nm laser (n = 3 at each time point). | ||
Conclusions
In conclusion, a multifunctional nanoplatform with tumor targeting ability that improves the microenvironment for tumor diagnosis and treatment was synthesized. Circulating in the blood, the nanoplatform was transported to tumors via the EPR effect and an RGD peptide. Benefiting from the microenvironment, with its mild acidic conditions and excess H2O2, an external MnO2 coating was used to decompose H2O2 to generate O2 in order to improve hypoxia in the tumors. The dispersed CuS NPs were then ingested by the deep tumor cells and irradiated for PTT by a 1064 nm laser, which had high penetrability for deep tumor treatment. Meanwhile, the CuS NPs could also be used as a contrast agent for CT imaging and Mn2+ produced from MnO2 was utilized for T1-MRI, from which we could accurately diagnose tumor sites for targeted therapy. All of the in vitro and in vivo results demonstrated the wonderful curative effect of PTT using these nanoparticles, and that they should have huge potential for clinical tumor therapies.Conflicts of interest
There are no conflicts to declare.Acknowledgements
This work was supported by the National Natural Science Foundation of China (grant number: 21701062), the China Postdoctoral Science Foundation (grant number: 2018M632262), the Science Foundation of Health Department of Jiangsu Province (grant number: Q201607), the Key Youth Medical Talent Project of Jiangsu Province (No. QNRC2016629), the Jiangsu Provincial Key Medical Discipline (No. ZDXKA2016017), and the Innovation Capacity Development Plan of Jiangsu Province (No. BM2018023)Notes and references
- D. Peer, J. M. Karp and S. Hong, Nat. Nanotechnol., 2007, 2, 751–761 CrossRef PubMed.
- G. L. Semenza, Nat. Rev. Cancer, 2003, 3, 721–732 CrossRef CAS PubMed.
- S. Parveen and S. K. Sahoo, J. Drug Targeting, 2018, 16, 108–123 CrossRef.
- S. Guo, L. Miao and Y. Wang, J. Controlled Release, 2014, 174, 137–142 CrossRef CAS PubMed.
- E. Panzarini and L. Dini, Mol. Pharmaceutics, 2014, 11, 2527–2538 CrossRef CAS PubMed.
- J. Downward, Nat. Rev. Cancer, 2003, 3, 11–22 CrossRef CAS PubMed.
- I. Melero, S. Hervas-Stubbs and M. Glennie, Nat. Rev. Cancer, 2007, 7, 95–106 CrossRef CAS PubMed.
- K. Vimala, K. Shanthi and S. Sundarraj, J. Colloid Interface Sci., 2017, 488, 92–108 CrossRef CAS PubMed.
- X. h. Huang and E. S. Qian, J. Am. Chem. Soc., 2006, 128, 2115–2120 CrossRef CAS PubMed.
- C. Loo, A. Lowery and N. Halas, Nano Lett., 2005, 5, 709–711 CrossRef CAS PubMed.
- K. Yang, S. Zhang and G. Zhang, Nano Lett., 2010, 10, 3318–3323 CrossRef CAS PubMed.
- A. M. Gobin, M. H. Lee and N. J. Halas, Nano Lett., 2007, 7, 1929–1934 CrossRef CAS PubMed.
- P. K. Jain, I. H. El-Sayed and M. A. El-Sayed, Nano Today, 2007, 2, 18–29 CrossRef.
- J. T. Robinson, S. M. Tabakman and Y. Liang, J. Am. Chem. Soc., 2011, 133, 6825–6831 CrossRef CAS PubMed.
- L. Cheng, K. Yang and Y. Li, Angew. Chem., Int. Ed., 2011, 50, 7385–7390 CrossRef CAS PubMed.
- T. B. Huff, L. Tong and Y. Zhao, Nanomedicine, 2007, 2, 125–132 CrossRef CAS PubMed.
- Z. Nie, D. Fava and E. Kumacheva, Nat. Mater., 2007, 6, 609–614 CrossRef CAS PubMed.
- H. K. Moon, S. H. Lee and H. C. Choi, ACS Nano, 2009, 3, 3707–3713 CrossRef CAS PubMed.
- C. M. Hessel, V. P. Pattani and M. Rasch, Nano Lett., 2011, 11, 2560–2566 CrossRef CAS PubMed.
- D. R. Ciocca, S. A. Fuqua and S. Locklim, Cancer Res., 1992, 52, 3648–3654 CAS.
- B. Mondovì, A. A. Finazzi and G. Rotilio, Eur. J. Cancer, 1969, 5, 137–146 CrossRef.
- X. Huang, P. K. Jain and I. H. El-Sayed, Lasers Med. Sci., 2008, 23, 217–228 CrossRef PubMed.
- R. L. Anderson, K. I. Van and P. E. Kraft, Mol. Cell. Biol., 1989, 9, 3509–3516 CrossRef CAS.
- L. Shang, S. Dong and G. U. Nienhaus, Nano Today, 2011, 6, 401–418 CrossRef CAS.
- H. Maeda, Adv. Enzyme Regul., 2001, 41, 189–207 CrossRef CAS PubMed.
- P. Vaupel, F. Kallinowski and P. Okunieff, Cancer Res., 1989, 49, 6449–6465 CAS.
- B. Thienpont, J. Steinbacher and H. Zhao, Nature, 2016, 537, 63–68 CrossRef CAS PubMed.
- Q. Chen, L. Feng and J. Liu, Adv. Mater., 2016, 28, 7129–7136 CrossRef CAS PubMed.
- C. Zhang, W. H. Chen and L. H. Liu, Adv. Funct. Mater., 2017, 27, 1700626–1700640 CrossRef.
- Y. Chen, X. Xu and S. Hong, et al., Cancer Res., 2001, 61, 2434–2438 CAS.
- E. Ruoslahti and M. D. Pierschbacher, Science, 1987, 238, 491–497 CrossRef CAS.
- X. Yi, K. Yang and C. Liang, Adv. Funct. Mater., 2015, 25, 4689–4699 CrossRef CAS.
| This journal is © The Royal Society of Chemistry 2019 |

