 Open Access Article
An electrochemical technique for controlled dissolution of zirconium based components of light water reactors†
Sayandev Chatterjee *a,
Meghan S. Fujimoto
 a,
Nathan L. Canfielda,
Monte R. Elmorea,
Devin W. Olsona,
Edgar C. Buck
 a,
Michele A. Conroya,
Tamas Vargab and
David J. Senora
aEnergy and Environment Directorate, Pacific Northwest National Laboratory, Richland, Washington 99352, USA. E-mail: Sayandev.Chatterjee@pnnl.gov
bEnvironmental Molecular Sciences Laboratory, Pacific Northwest National Laboratory, Richland, Washington 99352, USA
First published on 14th January 2019
Abstract
Zircaloy-4 (Zr-4) based liners and getters are the principle functional components of Tritium-Producing Burnable Absorber Rods (TPBARs) in light water nuclear reactors where they reduce tritiated water into tritium gas. Upon tritium exposure, zirconium tritide is formed, which changes the chemical composition, structure and morphology of these materials. Their thermodynamic properties are affected by (i) the hydride phase identity, (ii) radial and spatial tritide/hydride (T/H) distribution, and (iii) the changes in structure and morphology of the material upon T/H-migration, and their comprehensive knowledge is needed to predict performance of these materials. This work demonstrates that controlled potential electrochemistry techniques to be highly efficient for controlled oxidative radial dissolution of Zr-4 based liners (both unloaded and loaded with hydride/deuteride as chemical surrogates for tritium). The electrodissolution is further combined with microscopic techniques to accurately determine the distribution of hydride phases. This work demonstrates a reliable technique for radially etching the liners after irradiation to provide insight into the radial and spatial distribution of tritium within the TPBAR, improving the fundamental understanding of tritium transport and providing a basis for validating predictive models.
Introduction
Controlled and uniform dissolution of metallic surfaces is relevant in numerous applications ranging from metal digestion, electropolishing, anisotropic etching and batteries.1 However, despite decades of research in this chemistry, the knowledge on the controlled dissolution of zirconium is limited. Gaining this understanding is particularly relevant for the zircaloy-4 based functional components of Tritium-Producing Burnable Absorber Rods (TPBARs) in light water nuclear reactors (LWRs). To put it in context, tritium gas is a key component of nuclear weapons in the United States and across the globe, where it is contained in limited-life reservoirs. The half-life of tritium gas is 12.3 years, and therefore it needs to be refreshed periodically. One of the missions of United States' National Nuclear Security Administration is to provide freshly filled reservoirs for the stockpile to replace reservoirs whose tritium has decayed below specified levels.2 The gas is generated in commercial LWRs upon irradiation of the TPBARs. The TPBARs hold ∼132 inches of LiAlO2 pellets, and the reaction of 6Li with thermal neutron flux generates tritium under eqn (1).3–7| 6Li + 1n → 4He + 3H (or T) | (1) |
The generated tritium is released from the LiAlO2 pellets as both T2 and T2O. The migration of T2 and T2O is controlled by two key functional components of the TPBAR, namely liners and getters (the components are shown in Fig. 1), both of which are made of zircaloy-4 (Zr-4). The getters are coated with nickel electroplated on top of the Zr-4 layer; this nickel layer prevents the penetration of T2O into the getter and directs it towards the liners, which reduce the tritiated water to tritium gas. The tritium gas can now penetrate into the getters, and is captured by the zirconium which changes the chemical composition, structure and morphology of the zirconium phases in both the liners and getters through formation of zirconium tritide (or hydride).8–10 The thermodynamic properties of the zirconium phase are affected by (i) the tritide/hydride phase identity, (ii) radial and spatial tritide/hydride (T/H) distribution as well as the size of the tritide/hydride, and (iii) the changes in structure and morphology of the material upon T/H-migration, and their comprehensive knowledge is needed to predict performance of the liner or getter.11 Furthermore, evaluation of the properties also depends on knowledge of the identity of hydride/tritide phase (delta, gamma or epsilon). It has been demonstrated that the phase distribution and particle size of hydrides may vary depending on the method of generation. Development of a reliable method for radially etching the liners and getters after irradiation will provide insight into the spatial distribution of tritium within the TPBAR, improving the fundamental understanding of tritium transport and providing a basis for validating predictive models.
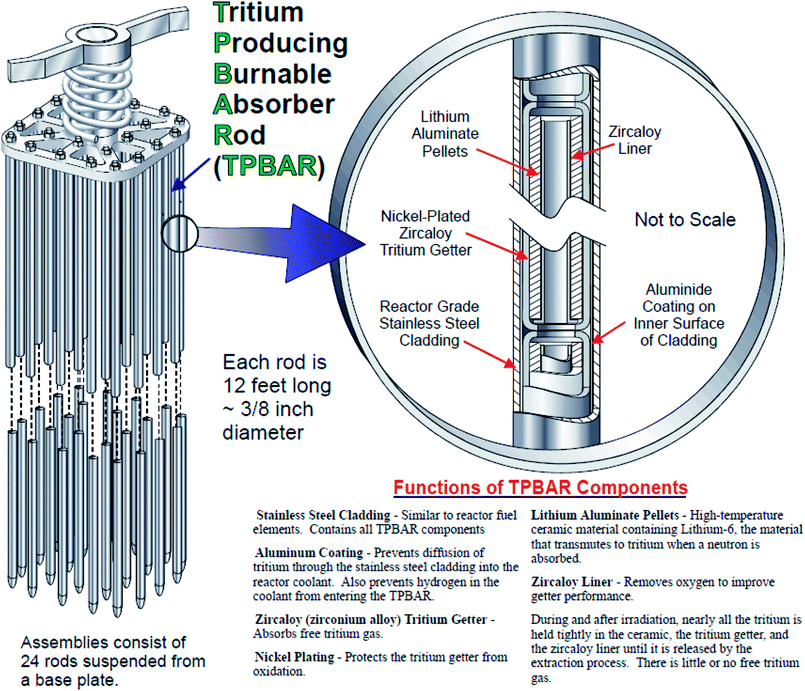 | ||
| Fig. 1 A schematic representation of the TPBAR with its various components. Adapted from Tritium Readiness Subprogram Project Execution Plan 2006.2 | ||
A convenient way to determine the spatial and radial T/H-distribution within the Zr-4 materials can be through the controlled and uniform dissolution of the hydride-loaded getter surface, followed by analysis of the newly exposed surfaces. Previous work done by other researchers to evaluate circumferential or radial zirconium hydride distribution involved etching cross-sections by chemical dissolution techniques using harsh corrosives (representative examples being mixtures of nitric acid (HNO3) and hydrofluoric acid (HF) or that of nitric acid (HNO3), hydrofluoric acid (HF) and oxalic acid under elevated temperatures12). However, the drastic nature of these chemical conditions have proven to be ineffective and not very desirable for uniform radial Zr-4 dissolution due to (a) the inability to control the dissolution rate, (b) presence of the harsh corrosives further contributing to the nonuniformity, and (c) their tendency to be affected by surface cracks/chemical heterogeneities/passivation.
To overcome the challenging prospect of uniform and controlled radial dissolution, non-destructive evaluation (NDE) and testing methods like ultrasound, eddy current, magnetic Barkhausen emission, and the likes had been proposed.13–18 These are promising techniques for probing macroscopic properties and have been used for an accurate and reproducible real-time detection of macrostructural flaws such as weld corrosion, fatigue cracks, thermal creep damage, and so on.19,20 These NDE techniques have also been demonstrated to be sensitive to changes in microstructural environment of materials. Recently, nonlinear ultrasound based NDE measurements have showed promising results to characterize microstructural changes in a material.21 Literature studies reveal that the nonlinear parameter is sensitive to both changes in dislocation density, and amount of precipitate formation during solution annealing of M250 grade maraging steels.22 Attempts have also been made in using these techniques to study hydrogen loading into zircaloy, and there is an existing body of literature that attempted to assess the hydrogen levels in zircaloy (up to 100 mg kg−1 or ppm) using combinations of ultrasound and eddy current based NDE techniques.23 However, the large scale practical applicability of ultrasonic or analogous NDE for Zr–H characterizations has been fairly limited due to the lack of a reference library to interpret an obtained ultrasound signal.
Electrochemical dissolution techniques can address the larger deficiencies of chemical dissolution through
(a) The intrinsic ability to control and/or moderate the dissolution rate through modulating the applied voltage, applied current and/or through changes in electrode material, its area of contact with the active surface and the electrode configuration;
(b) The drawbacks due to electrode passivation and surface heterogeneities can be addressed by more effective electrical contact or by slightly altering the electrochemical conditions to give the reaction enough “thrust” to override these resistances; and
(c) The ability to use less harsh, non-corrosive reactants significantly adds to the level of control, which can significantly enhance uniformity of the resulting process.
This provides enough motivation to pursue electrochemical dissolution of the Zr-4 surfaces, and follow up with microscopic and spectroscopic analyses of exposed surfaces to assess the uniformity of the technique. There have been limited previous studies on the electrochemical dissolution studies of Zr-4, though these studies have been mainly sporadic and limited to highly corrosive acidic solutions24 or highly drastic molten salt conditions involving elevated temperatures (>400 °C).25 Over the years, several reports have also been published on the electrochemical behavior of Zr mostly in aqueous solutions of sulphuric, nitric and phosphoric acids and potassium carbonates.26 Yet, a method for controlled dissolution of Zr-4 has not been reported. This may primarily be due to the tendency of Zr to get passivated under strong acidic conditions due to the formation of a layer of zirconium oxide. The standard reduction potential of zirconium is highly negative in aqueous solutions, and therefore the bare metallic surface can hardly exist under ambient conditions and is highly prone to oxidation under acidic environments.27 This necessitates either using drastic conditions to overcome the “overpotential” due to the oxide layer. Gill and coworkers conducted electrodissolution of Zr in NH4BF4 solution in liquid NH3 at a temperature of −77 °C.28 Martin and coworkers summarized the various efforts at dissolution of zircaloy-2 alloys loaded with U fuel in various harsh media comprising of HNO3/fluoride media, H2SO4/Fe3+/O2 media and N2O4/TBP media.29 More recent works have focused on dissolution of Zr-4 in high temperature (400 °C), LiCl–KCl–ZrCl4 molten salt matrices.25 These conditions still involve drastic conditions, and therefore pose similar issues as chemical dissolution, albeit at a lesser extent.
Our objective is to utilize significantly less corrosive solutions such as common salts (NaCl, NaBr), to be able to adequately control the dissolution rates. Our initial proof-of-concept for controlled and uniform electrochemical dissolution is demonstrated on the “liner tubes”. Both pristine liners as well as liners loaded with specified amounts of hydride were chosen to demonstrate the validity of the technique. Further, select liners were also loaded with specified amounts of deuterium gas to compare the behavior of the hydride loaded liners, with the motivation that a comparison of the properties of the hydride and the deuteride loaded liners will allow us to give a predictive insight into the behavior of tritiated liners. Liners with different levels of hydride and deuteride are also studied to get an understanding on the effects of their different on the rate and control of dissolution. Taking advantage of the level of maturity reached by microscopic techniques to accurately determine the distribution of hydride phases, we combine electrodissolution processes with these techniques to accurately determine the H-distribution in hydride exposed phases.
Materials
The liners used for the electrolytic experiments were made of zircaloy-4 (Zr-4). They were inserted into quartz tube in the tube furnace as shown in Fig. S1,† which were subsequently vacuum leak-checked to <0.001 torr min−1. The furnace heated to 500 °C. Hydrogen/deuterium standard leak flow was started under vacuum. Liner sections slid into heated zone by magnets. Once liners reached temperature, the valve to the vacuum pump was shut. Loading at 500 °C continued until desired loading level was achieved by calculating time required for certain number of moles of gas to flow from the calibrated leaks. Approximate loading was confirmed by change in liner weights. The target loadings were (a) Zr![[thin space (1/6-em)]](https://www.rsc.org/images/entities/char_2009.gif) :
:![[thin space (1/6-em)]](https://www.rsc.org/images/entities/char_2009.gif) H in the molar ratios of 1
H in the molar ratios of 1![[thin space (1/6-em)]](https://www.rsc.org/images/entities/char_2009.gif) :
:![[thin space (1/6-em)]](https://www.rsc.org/images/entities/char_2009.gif) 0.2, 1
0.2, 1![[thin space (1/6-em)]](https://www.rsc.org/images/entities/char_2009.gif) :
:![[thin space (1/6-em)]](https://www.rsc.org/images/entities/char_2009.gif) 05 and 1
05 and 1![[thin space (1/6-em)]](https://www.rsc.org/images/entities/char_2009.gif) :
:![[thin space (1/6-em)]](https://www.rsc.org/images/entities/char_2009.gif) 1 (to be referred to as 1
1 (to be referred to as 1![[thin space (1/6-em)]](https://www.rsc.org/images/entities/char_2009.gif) :
:![[thin space (1/6-em)]](https://www.rsc.org/images/entities/char_2009.gif) 02 mol Zr
02 mol Zr![[thin space (1/6-em)]](https://www.rsc.org/images/entities/char_2009.gif) :
:![[thin space (1/6-em)]](https://www.rsc.org/images/entities/char_2009.gif) H, 1
H, 1![[thin space (1/6-em)]](https://www.rsc.org/images/entities/char_2009.gif) :
:![[thin space (1/6-em)]](https://www.rsc.org/images/entities/char_2009.gif) 05 mol Zr
05 mol Zr![[thin space (1/6-em)]](https://www.rsc.org/images/entities/char_2009.gif) :
:![[thin space (1/6-em)]](https://www.rsc.org/images/entities/char_2009.gif) H and 1
H and 1![[thin space (1/6-em)]](https://www.rsc.org/images/entities/char_2009.gif) :
:![[thin space (1/6-em)]](https://www.rsc.org/images/entities/char_2009.gif) 1 mol Zr
1 mol Zr![[thin space (1/6-em)]](https://www.rsc.org/images/entities/char_2009.gif) :
:![[thin space (1/6-em)]](https://www.rsc.org/images/entities/char_2009.gif) H), and (b) Zr
H), and (b) Zr![[thin space (1/6-em)]](https://www.rsc.org/images/entities/char_2009.gif) :
:![[thin space (1/6-em)]](https://www.rsc.org/images/entities/char_2009.gif) D in the molar ratios of 1
D in the molar ratios of 1![[thin space (1/6-em)]](https://www.rsc.org/images/entities/char_2009.gif) :
:![[thin space (1/6-em)]](https://www.rsc.org/images/entities/char_2009.gif) 0.2, 1
0.2, 1![[thin space (1/6-em)]](https://www.rsc.org/images/entities/char_2009.gif) :
:![[thin space (1/6-em)]](https://www.rsc.org/images/entities/char_2009.gif) 05 and 1
05 and 1![[thin space (1/6-em)]](https://www.rsc.org/images/entities/char_2009.gif) :
:![[thin space (1/6-em)]](https://www.rsc.org/images/entities/char_2009.gif) 1 (to be referred to as 1
1 (to be referred to as 1![[thin space (1/6-em)]](https://www.rsc.org/images/entities/char_2009.gif) :
:![[thin space (1/6-em)]](https://www.rsc.org/images/entities/char_2009.gif) 02 mol Zr
02 mol Zr![[thin space (1/6-em)]](https://www.rsc.org/images/entities/char_2009.gif) :
:![[thin space (1/6-em)]](https://www.rsc.org/images/entities/char_2009.gif) D, 1
D, 1![[thin space (1/6-em)]](https://www.rsc.org/images/entities/char_2009.gif) :
:![[thin space (1/6-em)]](https://www.rsc.org/images/entities/char_2009.gif) 05 mol Zr
05 mol Zr![[thin space (1/6-em)]](https://www.rsc.org/images/entities/char_2009.gif) :
:![[thin space (1/6-em)]](https://www.rsc.org/images/entities/char_2009.gif) D and 1
D and 1![[thin space (1/6-em)]](https://www.rsc.org/images/entities/char_2009.gif) :
:![[thin space (1/6-em)]](https://www.rsc.org/images/entities/char_2009.gif) 1 mol Zr
1 mol Zr![[thin space (1/6-em)]](https://www.rsc.org/images/entities/char_2009.gif) :
:![[thin space (1/6-em)]](https://www.rsc.org/images/entities/char_2009.gif) D).
D).
Potassium chloride (KCl), potassium bromide (KBr), potassium iodide (KI), potassium hydroxide (KOH) pellets and sodium acetate (NaOAc) were obtained from Sigma-Aldrich and used without further purification. Hydrochloric acid (HCl, 95%), nitric acid (HNO3, 70%) and ethanol (EtOH) were purchased from Fischer Scientific, and used as obtained.
Instrumentation
Results and discussions
Electrochemistry
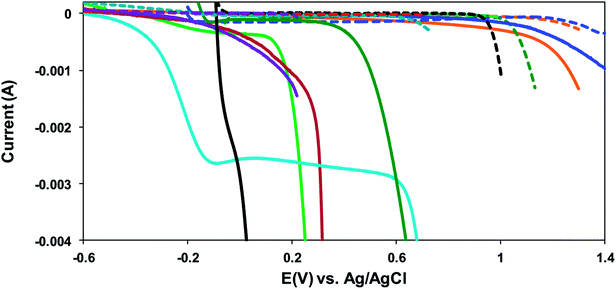
Amongst the range of electrolytes chosen, it is observed that at electrochemical potentials below 0.4 V (vs. Pt), Zr-4 shows significantly more pronounced electroactivity in presence of the halide solutions and in the presence of base. The voltammogram of Zr-4 in 1.0 M KCl in water shows that a gradual change of the potential to values more positive than −0.6 V results in an associated drop in the current. This trend continues up to −0.10 V, after which the drop in current with the increase in potential partially levels off up to 0.10 V. On further increasing the potential, the current undergoes a sharp drop almost parallel to the ordinate axis. Such big changes in the current that accompany small changes in potential are indicative of big changes on the surface of the working electrode usually related to electrodissolution. The current for the dissolution process is negative which is expected for an oxidative dissolution process due to the zirconium metal in Zr-4 getting converted to a zirconium compound, resulting in its dissolution from the electrode surface. The absence of this huge drop in the blank is suggestive that this is due to big changes in the surface of the Zr-4 tube, and the redox potential and the value of the current indicate the process to be an oxidative electrodissolution, resulting in the formation of zirconium chloride.
A comparison of the voltammograms of Zr-4 in chloride environment to that in presence of the other two halides (i.e. 1.0 M KBr in water, 1.0 M KI in water) show that the currents are comparable at potentials lower than or ≈ −0.45 V; however, as the potentials are gradually increased, the magnitude of the currents for the electrochemical processes in presence of bromide or iodide drops less prominently than those in presence of 1.0 M KCl. Furthermore, unlike the process in presence of the chloride, where the voltammogram levels off between −0.10 V and 0.10 V, before proceeding on to a sharp drop in current, the voltammograms in presence of bromide or iodide take a gentle curve down before dropping sharply. In presence of bromide, the gradual curving down with the application of more positive potentials continues up to ∼0.30 V, beyond which it drops sharply. (The electrochemical window for I2/I− prevented us from scanning potentials at higher than that 0.23 V in presence of iodide.)
The voltammograms of the sample measured in 10% HCl/90% EtOH are stable with respect to increase in potential, and the currents remain invariant up to 0.45 V before curving into a steep drop. On the other hand, the voltammogram of the sample in 1.0 M HNO3 is even more stable, with the currents starting a gradual drop at 1.10 V. The behavior of Zr-4 in 1.0 M NaOAc/water is also similar, with big drops in current with changes in potential occurring at potentials >1.0 V. On the other hand, the voltammogram of Zr-4 shows the most pronounced effect in HCl with the current undergoing a steep drop at ∼0.00 V even as the potential is slightly shifted to more positive values.
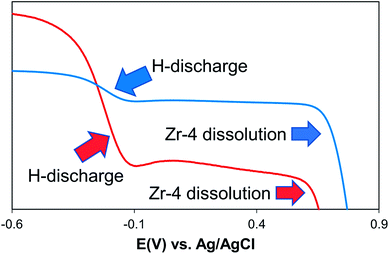
The voltammograms of Zr-4 in 1.0 M KOH/water show a distinctive behavior compared to that observed in other electrolytes. Here the voltammogram is represented by a two step-drop. The voltammograms start showing an immediate drop in the currents along a curvature as potentials are scanned to positive directions, starting at −0.60 V. The curvature becomes much steeper beyond −0.40 V and continues down the steep slope upto −0.15 V, beyond which the current levels off up to 0.65 V. Scanning to more positive potential results in a steep drop in the current. Based on literature reports on metal hydride alloys, the first drop is attributed to the discharging of hydrides that are formed on the surface of Zr-4 due to its contact with water in hydroxylated media.30,31 To support this hypothesis, the linear sweep voltammogram of an experimentally generated sample loaded with small quantities of H (1![[thin space (1/6-em)]](https://www.rsc.org/images/entities/char_2009.gif) :
:![[thin space (1/6-em)]](https://www.rsc.org/images/entities/char_2009.gif) 0.2 mol Z
0.2 mol Z![[thin space (1/6-em)]](https://www.rsc.org/images/entities/char_2009.gif) :
:![[thin space (1/6-em)]](https://www.rsc.org/images/entities/char_2009.gif) H) was carried out under identical conditions. It is observed that the sample which was intentionally loaded with hydride, shows a redox process at the same regions as shown by the unloaded Zr-4 liner. However, the current intensities for the H-discharge step for the 1
H) was carried out under identical conditions. It is observed that the sample which was intentionally loaded with hydride, shows a redox process at the same regions as shown by the unloaded Zr-4 liner. However, the current intensities for the H-discharge step for the 1![[thin space (1/6-em)]](https://www.rsc.org/images/entities/char_2009.gif) :
:![[thin space (1/6-em)]](https://www.rsc.org/images/entities/char_2009.gif) 0.2 mol Z
0.2 mol Z![[thin space (1/6-em)]](https://www.rsc.org/images/entities/char_2009.gif) :
:![[thin space (1/6-em)]](https://www.rsc.org/images/entities/char_2009.gif) H is significantly higher as expected for a material that is expected to have significantly higher H-content. (The comparison of the LSVs are shown in Fig. 3.) The second drop corresponds to the oxidative electrodissolution of Zr-4. The reaction for the H-discharge and the reverse charging process is given by eqn (2):31
H is significantly higher as expected for a material that is expected to have significantly higher H-content. (The comparison of the LSVs are shown in Fig. 3.) The second drop corresponds to the oxidative electrodissolution of Zr-4. The reaction for the H-discharge and the reverse charging process is given by eqn (2):31
 | (2) |
To summarize, the studied Zr-4 voltammograms are characterized by an initial flat region at lower potentials, followed by a sharp drop in current at more positive potential (with the exception in 1 M HCl which shows a constant sharp drop). Comparison with the respective solvent blanks demonstrate that the sharp current decrease observed for the Zr-4 samples occur at much lower voltages and is indicative of Zr-4 electrodissolution. Importantly, electrochemical behavior monitored under variety of electrolytes suggests dissolution to be possible in non-harsh chemical conditions. While electrodissolution is observed in a variety of electrolytic media ranging from acids to bases to salts, alkyl halides are particularly attractive as they offer a benign media, and allow electrodissolution at a voltage low enough that does not result in any interfering electrochemical reactions/processes. The dissolution in 1 M KCl is particularly attractive as it not only allows for a highly benign reaction condition, but also due to sharper and more pronounced current drop at the onset of dissolution voltage compared to other electrolytes (as observed in the LSV in Fig. 3). Therefore, 1 M KCl was adapted as the chosen electrolyte medium for subsequent electrodissolution studies.
Subsequent studies involved exploring the electrochemical behavior and oxidative dissolution potential of Zr-4 liners loaded with three different amounts of H (1![[thin space (1/6-em)]](https://www.rsc.org/images/entities/char_2009.gif) :
:![[thin space (1/6-em)]](https://www.rsc.org/images/entities/char_2009.gif) 0.2 mol Zr
0.2 mol Zr![[thin space (1/6-em)]](https://www.rsc.org/images/entities/char_2009.gif) :
:![[thin space (1/6-em)]](https://www.rsc.org/images/entities/char_2009.gif) H; 1
H; 1![[thin space (1/6-em)]](https://www.rsc.org/images/entities/char_2009.gif) :
:![[thin space (1/6-em)]](https://www.rsc.org/images/entities/char_2009.gif) 0.5 mol Zr
0.5 mol Zr![[thin space (1/6-em)]](https://www.rsc.org/images/entities/char_2009.gif) :
:![[thin space (1/6-em)]](https://www.rsc.org/images/entities/char_2009.gif) H and 1
H and 1![[thin space (1/6-em)]](https://www.rsc.org/images/entities/char_2009.gif) :
:![[thin space (1/6-em)]](https://www.rsc.org/images/entities/char_2009.gif) 1 mol Zr
1 mol Zr![[thin space (1/6-em)]](https://www.rsc.org/images/entities/char_2009.gif) :
:![[thin space (1/6-em)]](https://www.rsc.org/images/entities/char_2009.gif) H). The linear sweep voltammograms were studied in 1 M aqueous KCl based on previous results. It is observed that in the LSVs for the same scan rate the dissolution potentials, which are a measured by the sharp drop in current as a function of applied voltage, progressively shift to more positive voltages as the H loading is increased, as seen in Fig. 5, left panel. This is a consequence of the zirconium metal center being more electron deficient in the hydrides and requiring a higher voltage kick to get oxidized. A set of similar studies were done for Zr-4 liners loaded with three different amounts of D (1
H). The linear sweep voltammograms were studied in 1 M aqueous KCl based on previous results. It is observed that in the LSVs for the same scan rate the dissolution potentials, which are a measured by the sharp drop in current as a function of applied voltage, progressively shift to more positive voltages as the H loading is increased, as seen in Fig. 5, left panel. This is a consequence of the zirconium metal center being more electron deficient in the hydrides and requiring a higher voltage kick to get oxidized. A set of similar studies were done for Zr-4 liners loaded with three different amounts of D (1![[thin space (1/6-em)]](https://www.rsc.org/images/entities/char_2009.gif) :
:![[thin space (1/6-em)]](https://www.rsc.org/images/entities/char_2009.gif) 0.2 mol Zr
0.2 mol Zr![[thin space (1/6-em)]](https://www.rsc.org/images/entities/char_2009.gif) :
:![[thin space (1/6-em)]](https://www.rsc.org/images/entities/char_2009.gif) D; 1
D; 1![[thin space (1/6-em)]](https://www.rsc.org/images/entities/char_2009.gif) :
:![[thin space (1/6-em)]](https://www.rsc.org/images/entities/char_2009.gif) 0.5 mol Zr
0.5 mol Zr![[thin space (1/6-em)]](https://www.rsc.org/images/entities/char_2009.gif) :
:![[thin space (1/6-em)]](https://www.rsc.org/images/entities/char_2009.gif) D and 1
D and 1![[thin space (1/6-em)]](https://www.rsc.org/images/entities/char_2009.gif) :
:![[thin space (1/6-em)]](https://www.rsc.org/images/entities/char_2009.gif) 1 mol Zr
1 mol Zr![[thin space (1/6-em)]](https://www.rsc.org/images/entities/char_2009.gif) :
:![[thin space (1/6-em)]](https://www.rsc.org/images/entities/char_2009.gif) D), with the goal that a comparison between the electrochemical behaviors of unloaded liners with those loaded with H or D, will allow for extrapolation to those loaded with T, and allow us to get predictive insight into T behavior. It is observed that the behavior of D loaded materials is similar to that of H loaded materials, progressively shifting to more positive voltages as the D loading in increased as seen in Fig. 4, right panel, due to similar requirement of higher voltage by a more electron deficient Zr center in the deuterides. The values for the D loaded materials are slightly higher than those for the analogous H loaded materials, presumably due to a kinetic isotopic effect.
D), with the goal that a comparison between the electrochemical behaviors of unloaded liners with those loaded with H or D, will allow for extrapolation to those loaded with T, and allow us to get predictive insight into T behavior. It is observed that the behavior of D loaded materials is similar to that of H loaded materials, progressively shifting to more positive voltages as the D loading in increased as seen in Fig. 4, right panel, due to similar requirement of higher voltage by a more electron deficient Zr center in the deuterides. The values for the D loaded materials are slightly higher than those for the analogous H loaded materials, presumably due to a kinetic isotopic effect.
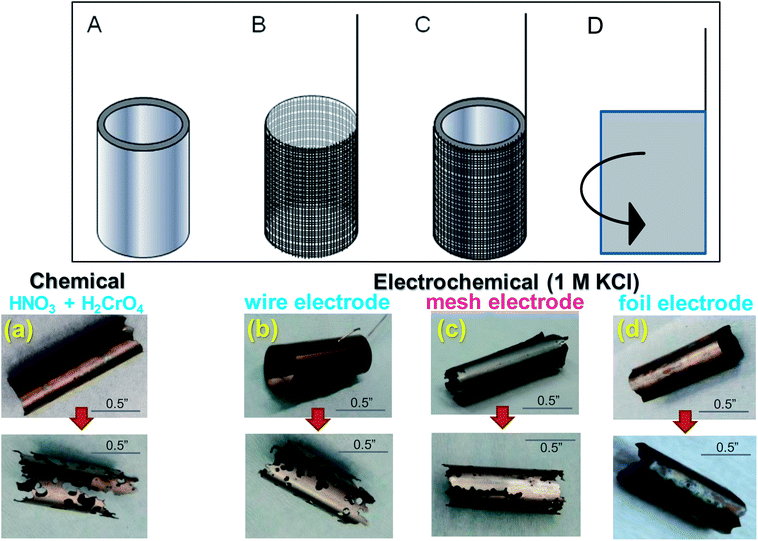
Different working electrode geometry and configurations were used in contact with the Zr-4 liner to optimize electrochemical contact. Platinum wire, mesh and foil were used as multi-electrode system to maximize contact with Zr-4 surface. (The foil and mesh configurations are shown in Fig. 6 (top panel).) Dissolution was conducted for upto 50% liner dissolution by weight in 1 M KCl at a stationary oxidative potential of 225 mV versus Ag/AgCl. The oxidative potential was based on the LSV values observed in Fig. 2. The uniformity of dissolution process was qualitatively assessed through visual changes in the liner and quantitatively measured either by the change in mass or the change in thickness of the liner. A comparative chemical dissolution was also attempted on the Zr-4 liner using a 1![[thin space (1/6-em)]](https://www.rsc.org/images/entities/char_2009.gif) :
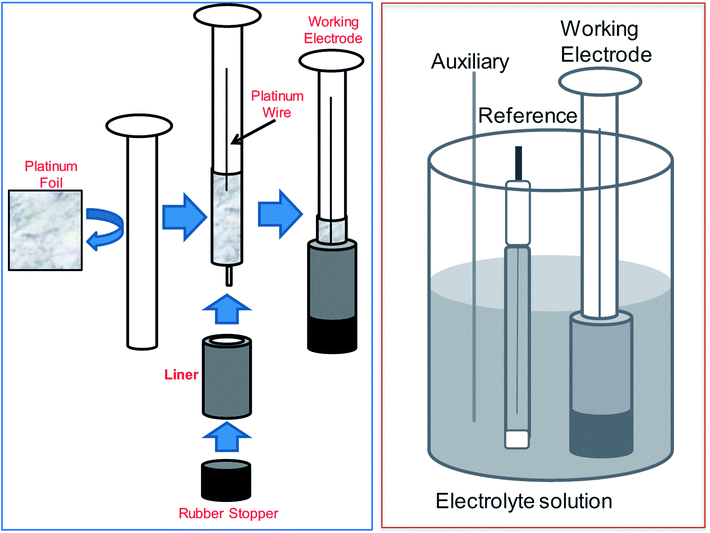
:![[thin space (1/6-em)]](https://www.rsc.org/images/entities/char_2009.gif) 1 mixture of conc. HNO3 and conc. H2CrO4 as has been used in previous chemical dissolution studies of Zr-4 based materials. A qualitative representation of the control in dissolution under various conditions for 50% dissolution of the respective materials by weight is shown in Fig. 5 (bottom panel). Compared with chemical conditions, it was observed that electrochemical dissolution affords significantly greater control compared to chemical methods. Further, among electrochemical methods, the order of control based on visual uniformity of dissolution was observed to follow the trend: wire electrode < mesh electrode < foil electrode. Based on this, foil electrode was selected for further electrochemical studies. The electrode design and the schematics of the electrode set-up are shown in Fig. 6. In this set-up, a platinum foil was taken with length equal to or greater than the length of the getter to ensure that any part in the inside of the getter is not devoid of electrical contact. The foil was wrapped around a cylindrical support whose diameter matched the internal diameter of the getter. A platinum wire was also kept in contact with the foil for effective electrical contact. The getter was slipped around the foil and secured using a rubber stopper at the end.
1 mixture of conc. HNO3 and conc. H2CrO4 as has been used in previous chemical dissolution studies of Zr-4 based materials. A qualitative representation of the control in dissolution under various conditions for 50% dissolution of the respective materials by weight is shown in Fig. 5 (bottom panel). Compared with chemical conditions, it was observed that electrochemical dissolution affords significantly greater control compared to chemical methods. Further, among electrochemical methods, the order of control based on visual uniformity of dissolution was observed to follow the trend: wire electrode < mesh electrode < foil electrode. Based on this, foil electrode was selected for further electrochemical studies. The electrode design and the schematics of the electrode set-up are shown in Fig. 6. In this set-up, a platinum foil was taken with length equal to or greater than the length of the getter to ensure that any part in the inside of the getter is not devoid of electrical contact. The foil was wrapped around a cylindrical support whose diameter matched the internal diameter of the getter. A platinum wire was also kept in contact with the foil for effective electrical contact. The getter was slipped around the foil and secured using a rubber stopper at the end.
Dissolution kinetics of unloaded and H/D-loaded liners
To measure the dissolution kinetics, CPE was conducted on the liners (unloaded, H-loaded and D-loaded) with comparable dimensions at a stationary voltage of 225 mV vs. Ag/AgCl using platinum foil as working electrode supports, and the rate of dissolution was measured by intermittently recording (a) either the weight fraction dissolved, or (b) the reduction in the wall thickness.For the first method, the plot of weight fraction dissolved versus time for the unloaded liner showed an initial dormancy period, followed by a steady near-linear dissolution kinetics. The initial dormancy period is presumably attributed to a resisting oxide layer formed on the surface. The dissolution studies for each of these H and D-loaded liner materials also showed a steady near-linear dissolution kinetics when measured as a function of weight fraction dissolved with time, as shown in Fig. 7. Testing the dissolution kinetics of select liners at a slightly higher applied potential of 275 mV vs. Ag/AgCl showed that the dissolution was still linear with time, though the rate of dissolution was significantly enhanced. The cumulative results indicate that by carefully choosing the dissolution potential and by ensuring adequate electrical contact between the working electrode and the liner, it is possible to control the rate of electrodissolution, as demonstrated by the near linear dissolution kinetics as measured by the dissolution as a function of weight dissolved.
The second method involved measuring the thicknesses of the liners subjected to progressive dissolution via microscopy. A representative set of thickness measurements on a H-loaded liner (1![[thin space (1/6-em)]](https://www.rsc.org/images/entities/char_2009.gif) :
:![[thin space (1/6-em)]](https://www.rsc.org/images/entities/char_2009.gif) 0.5 mol Zr
0.5 mol Zr![[thin space (1/6-em)]](https://www.rsc.org/images/entities/char_2009.gif) :
:![[thin space (1/6-em)]](https://www.rsc.org/images/entities/char_2009.gif) H) prior to dissolution as well after ∼20%, ∼40% and ∼60% dissolution by weight in 1 M KCl under an applied dissolution potential of 225 mV vs. Ag/AgCl are shown in Fig. S2.† The liner thicknesses, plotted as a function of electrolysis time, show a linear drop, suggesting uniform control. However, an important consideration that has to be taken in account is that an identical region for measuring the cross section of the liner may not possible which reduces the reliability for this method. Furthermore, in instances, the actual liners were observed to have non-uniform cross sections, which further add to the unreliability component. Irrespective of these considerations, the set of measurements shown below does reflect the ability to control the dissolution rate under proper modulation of electrochemical conditions, irrespective of the analytical method applied to quantify the dissolution rates.
H) prior to dissolution as well after ∼20%, ∼40% and ∼60% dissolution by weight in 1 M KCl under an applied dissolution potential of 225 mV vs. Ag/AgCl are shown in Fig. S2.† The liner thicknesses, plotted as a function of electrolysis time, show a linear drop, suggesting uniform control. However, an important consideration that has to be taken in account is that an identical region for measuring the cross section of the liner may not possible which reduces the reliability for this method. Furthermore, in instances, the actual liners were observed to have non-uniform cross sections, which further add to the unreliability component. Irrespective of these considerations, the set of measurements shown below does reflect the ability to control the dissolution rate under proper modulation of electrochemical conditions, irrespective of the analytical method applied to quantify the dissolution rates.
In summary, the combined CPE results indicate that uniform and controlled dissolution is possible by electrochemical methods through carefully selecting the potentials, irrespective of amount of dissolution, or the isotope or the Zr![[thin space (1/6-em)]](https://www.rsc.org/images/entities/char_2009.gif) :
:![[thin space (1/6-em)]](https://www.rsc.org/images/entities/char_2009.gif) H/D molar ratio.
H/D molar ratio.
X-ray diffraction (XRD) on the dissolved phases
In order to analyze the crystallinity and phases generated during the electrodissolution process, XRD studies were conducted on the generated products. During the electrodissolution studies, the materials etched from the surface of the liners precipitated out of the solution. To identify the phases associated with the precipitate, they were collected, washed repeatedly with water to dissolve off any residual supporting electrolyte salt that might have been left with the solid residue, and dried. The diffractograms of the residues generated from the pristine unloaded liner show highly amorphous phases shown in Fig. S3.† Diffractogram of the dissolved phases of H loaded liner (1![[thin space (1/6-em)]](https://www.rsc.org/images/entities/char_2009.gif) :
:![[thin space (1/6-em)]](https://www.rsc.org/images/entities/char_2009.gif) 1 mol Zr
1 mol Zr![[thin space (1/6-em)]](https://www.rsc.org/images/entities/char_2009.gif) :
:![[thin space (1/6-em)]](https://www.rsc.org/images/entities/char_2009.gif) H) shows similar patterns with further loss in crystallinity, and that of the dissolved phases of D loaded liner (1
H) shows similar patterns with further loss in crystallinity, and that of the dissolved phases of D loaded liner (1![[thin space (1/6-em)]](https://www.rsc.org/images/entities/char_2009.gif) :
:![[thin space (1/6-em)]](https://www.rsc.org/images/entities/char_2009.gif) 1 mol Zr
1 mol Zr![[thin space (1/6-em)]](https://www.rsc.org/images/entities/char_2009.gif) :
:![[thin space (1/6-em)]](https://www.rsc.org/images/entities/char_2009.gif) D) is near identical to the H-loaded one. The samples were observed to be mostly amorphous; however the humps may indicate some long-range order that resembles one or more ZrO2 phases.35–40 It is worth mentioning that the list is by no means exhaustive and represents a select set of zirconia phases that can be used to fit the data.
D) is near identical to the H-loaded one. The samples were observed to be mostly amorphous; however the humps may indicate some long-range order that resembles one or more ZrO2 phases.35–40 It is worth mentioning that the list is by no means exhaustive and represents a select set of zirconia phases that can be used to fit the data.
SEM studies
A representative set of SEM images taken in the secondary electron mode show notable differences between the grains for the unloaded materials versus the H-loaded or D-loaded materials (representative images of the unloaded Zr-4 materials, 1![[thin space (1/6-em)]](https://www.rsc.org/images/entities/char_2009.gif) :
:![[thin space (1/6-em)]](https://www.rsc.org/images/entities/char_2009.gif) 1 mol Zr
1 mol Zr![[thin space (1/6-em)]](https://www.rsc.org/images/entities/char_2009.gif) :
:![[thin space (1/6-em)]](https://www.rsc.org/images/entities/char_2009.gif) H and 1
H and 1![[thin space (1/6-em)]](https://www.rsc.org/images/entities/char_2009.gif) :
:![[thin space (1/6-em)]](https://www.rsc.org/images/entities/char_2009.gif) 0.5 mol Zr
0.5 mol Zr![[thin space (1/6-em)]](https://www.rsc.org/images/entities/char_2009.gif) :
:![[thin space (1/6-em)]](https://www.rsc.org/images/entities/char_2009.gif) D shown in Fig. S4†). These images show prominent morphological as well as phase changes in the materials upon H/D loading.
D shown in Fig. S4†). These images show prominent morphological as well as phase changes in the materials upon H/D loading.
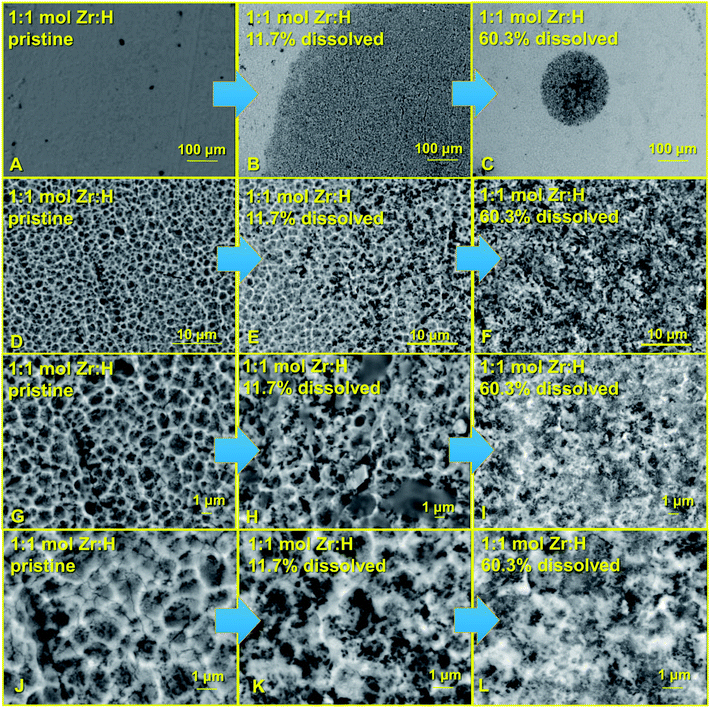
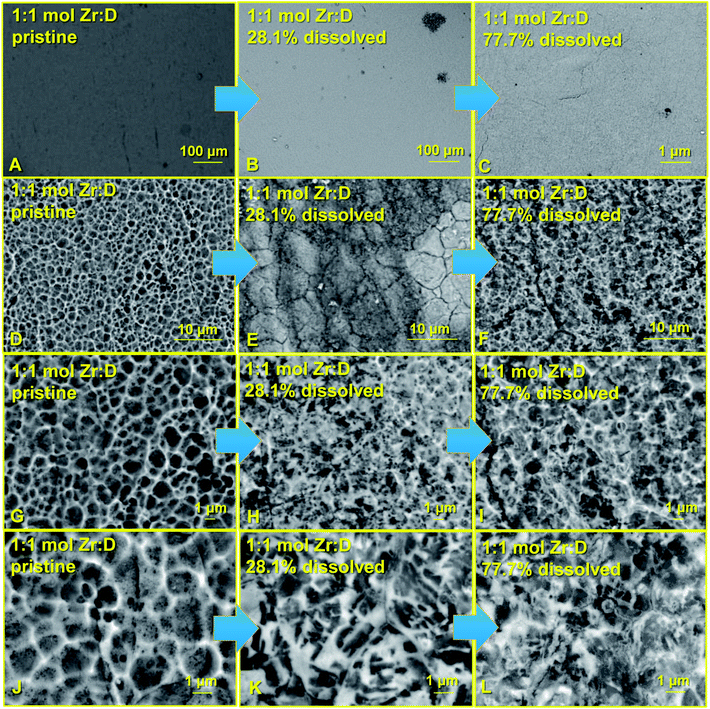
SEM images in secondary electron mode were also collected on the surfaces after varying stages of electrodissolution to see effects of the dissolution process on the uniformity of the surface, as illustrated in the set of images shown in Fig. 8 and 9. The general features on the surfaces exposed after dissolution were observed to be similar to those on undissolved surfaces.
An interesting feature emerged on comparing the surface images of the H/D loaded liners (1![[thin space (1/6-em)]](https://www.rsc.org/images/entities/char_2009.gif) :
:![[thin space (1/6-em)]](https://www.rsc.org/images/entities/char_2009.gif) 1 mol Zr
1 mol Zr![[thin space (1/6-em)]](https://www.rsc.org/images/entities/char_2009.gif) :
:![[thin space (1/6-em)]](https://www.rsc.org/images/entities/char_2009.gif) H or 1
H or 1![[thin space (1/6-em)]](https://www.rsc.org/images/entities/char_2009.gif) :
:![[thin space (1/6-em)]](https://www.rsc.org/images/entities/char_2009.gif) 1 mol Zr
1 mol Zr![[thin space (1/6-em)]](https://www.rsc.org/images/entities/char_2009.gif) :
:![[thin space (1/6-em)]](https://www.rsc.org/images/entities/char_2009.gif) D) before dissolution to the images of the exposed surfaces after dissolution. The surfaces of the undissolved liners showed general uniformity for both the H and D loaded materials at varying stages of magnification. The low magnification secondary electron images of the surfaces prior to dissolution showed uniformity in phase distribution (Fig. 8A–C and 9A–C), while the high magnification images showed uniformity in grain sizes and distinctive grain boundaries (Fig. 8G–L and 9G–L). The darker regions in the figures represent hydrides/deuteride loaded materials while the lighter spots represent the Zr metallic phases as confirmed by EBSD measurements. Post various stages of dissolution, the low magnification secondary electron images showed distinct patches revealing islets of hydride or deuteride formation (particularly noteworthy are the dark patches in Fig. 8(B and C) and 9(B and E) represent the hydrides and deuterides respectively as confirmed by EBSD). The higher magnification images revealed that the grain sizes became more non-uniform and the grain boundaries became less distinct showing dispersed patches of hydride or deuteride. This lowering of uniformity in grain sizes and loss of distinctive grain boundaries progressively increased with higher and higher amounts of dissolution, suggesting that the hydride and deuteride formation is less uniform in the core of the liners at micron levels. Based on the combination of images, and in particular, images in Fig. 8A–C, a really simplified scheme for the penetration of hydrogen/deuterium into the material may be in a conical manner as shown in the schematic representation in Fig. 10. A similar trend can be observed when Fig. 9A–C are compared. However, it should be pointed out that the regions chosen for the microscopic images in the case of Fig. 8A–C or in the case of Fig. 9A–C are different.
D) before dissolution to the images of the exposed surfaces after dissolution. The surfaces of the undissolved liners showed general uniformity for both the H and D loaded materials at varying stages of magnification. The low magnification secondary electron images of the surfaces prior to dissolution showed uniformity in phase distribution (Fig. 8A–C and 9A–C), while the high magnification images showed uniformity in grain sizes and distinctive grain boundaries (Fig. 8G–L and 9G–L). The darker regions in the figures represent hydrides/deuteride loaded materials while the lighter spots represent the Zr metallic phases as confirmed by EBSD measurements. Post various stages of dissolution, the low magnification secondary electron images showed distinct patches revealing islets of hydride or deuteride formation (particularly noteworthy are the dark patches in Fig. 8(B and C) and 9(B and E) represent the hydrides and deuterides respectively as confirmed by EBSD). The higher magnification images revealed that the grain sizes became more non-uniform and the grain boundaries became less distinct showing dispersed patches of hydride or deuteride. This lowering of uniformity in grain sizes and loss of distinctive grain boundaries progressively increased with higher and higher amounts of dissolution, suggesting that the hydride and deuteride formation is less uniform in the core of the liners at micron levels. Based on the combination of images, and in particular, images in Fig. 8A–C, a really simplified scheme for the penetration of hydrogen/deuterium into the material may be in a conical manner as shown in the schematic representation in Fig. 10. A similar trend can be observed when Fig. 9A–C are compared. However, it should be pointed out that the regions chosen for the microscopic images in the case of Fig. 8A–C or in the case of Fig. 9A–C are different.
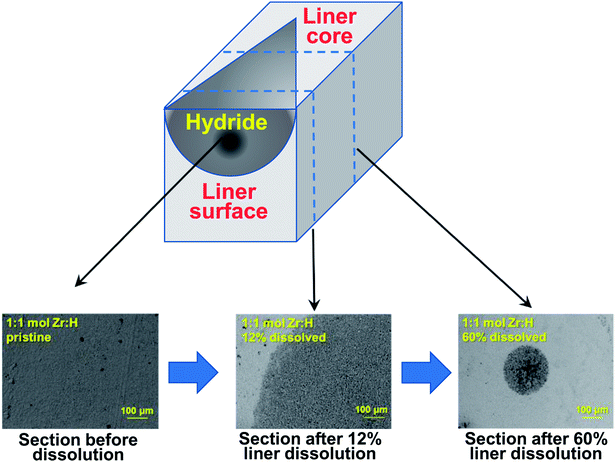 | ||
| Fig. 10 Schematic representation of H/D migration into the liner material. The three sections represent Fig. 8A, B and C respectively. | ||
We have to keep in mind that interpreting the migration of H2/D2 from microscopic images is not trivial due to (a) possibility of the gases migrating in both from the outer and the inner surfaces of the liner, and (b) the region looked at under the microscope is different every time. This warrants examination of a library of images and more careful analyses. Looking at multiple sets of images actually support this trend. More notably, the fact that electrochemical dissolution under controlled potential affords us the luxury of carefully exposing the surfaces with such uniformity which makes these subsequent microscopic studies possible, and demonstrates the power of these technique in probing the microstructure of these materials. It is noteworthy that we are able to clearly expose and observe the fragile H/D loaded pockets through controlled electrochemical dissolution, and control the uniformity of dissolution without being noticeably affected by the porosities and cracks on the hydride phases. This level of control would presumably have been challenging under any other techniques, and our ability to use highly benign salt solutions at moderate to low concentrations allows us to control this uniformity appreciably.
Conclusions
Our adapted controlled potential electrochemical technique demonstrated controlled and uniform radial stripping of both unloaded and H/D loaded Zr-4 liners. Particularly noteworthy is the ability to control the dissolution rate in every single liner unit studied, irrespective of the liner material and amount of H/D loading. It is also significant that we were able to carefully expose and observe the fragile H/D loaded pockets through controlled electrochemical dissolution, and control the uniformity of dissolution without being noticeably affected by the porosities and cracks on the hydride phases. The fact that we were able to conduct this process in highly benign salt solution at moderate concentrations and get away from even mildly corrosive reagents, allowed us to effectively keep the dissolution uniformity and rate under control, without having to particularly worry about the solutions sneaking in through the cracks and causing non-uniform damage. Further, the use of a highly conductive but malleable enough foil electrodes in the CPE experiments made it possible to maintain an effective electrical contact with the entire surface of the liner. This allowed us to control the uniformity of dissolution and also allowed for the applied voltages to be maintained at values not high enough to get out of control. Our studies proved that this technique can be powerful in the radial T-distribution tritiated liners generated under irradiated environments, as well as for exploring H-distribution of Zr-4 hydrides and other alloys as well. The uniformity of dissolution demonstrated by the linearity of the liner dissolution rates illustrate that it is possible control the exact dissolution amount by accurately setting the dissolution potential and the electrolysis time. Our studies also demonstrated that complementing microscopy with electrochemical dissolution techniques can be a powerful technique in understanding and evaluating material microstructure at the core, providing rich information that has not been gained thus far. The work also provides a methodology for radially etching the various TPBAR components (liners and getters) post irradiation to get insight into (i) the hydride phase identity, (ii) radial and spatial tritide/hydride (T/H) distribution, and (iii) the changes in structure and morphology of the material upon T/H-migration, improving the fundamental understanding of tritium transport and providing a basis for validating predictive models. The understanding gained through these studies combined with the demonstration of the proof-of-concept also provides the strategy for exploring H-distribution of other alloys as well.Conflicts of interest
The authors declare no conflicts of interest.Acknowledgements
This work was completed as part of the Tritium Applied Science Program. Support for this project came from the NNSA's Tritium Technology Project. We would like to especially acknowledge Ms. Ingrid Burgeson and Mr Gary Sevigny for helpful discussions. Part of this research was performed using EMSL, a DOE Office of Science User Facility sponsored by the Office of Biological and Environmental Research.References
- A. P. Abbott, G. Frisch, J. Hartley, W. O. Karim and K. S. Ryder, Anodic dissolution of metals in ionic liquids, Prog. Nat. Sci.: Mater. Int., 2015, 25(6), 595–602 CrossRef CAS.
- NNSA, NA-123 Office of Stockpile Technology, in Tritium Readiness Subprogram Project Execution Plan, 2006 Search PubMed.
- W. Pincus, TVA Plant to Supply Nuclear Bomb Material Tritium, Washington Post, December 23, 1998 Search PubMed.
- TVA Approves Plan to Make Weapons Material, Washington Post, December 9, 1999.
- Y. Y. Liu and S. W. Tam, Thermal Conductivities for Sintered and Sphere-Pac Li2O and γ-LiAlO2 Solid Breeders with and Without Irradiation Effects, Fusion Technol., 1985,(3), 399–410 CrossRef CAS.
- S. Wyrick, J. Cordaro, N. Founds and C. Chambellan, INMM Annual Meeting Conference, in NNSA Tritium Supply Chain, U.S. Department of Energy, 2013 Search PubMed.
- M. L. Salit, R. D. Vocke and W. R. Kelly, An ICP-OES method with 0.2% expanded uncertainties for the characterization of LiAlO2, Anal. Chem., 2000, 72(15), 3504–3511 CrossRef CAS PubMed.
- J. B. Bai, C. Prioul and D. Francois, Hydride Embrittlement in Zircaloy-4 Plate. 1. Influence of Microstructure on the Hydride Embrittlement in Zircaloy-4 at 20-Degrees-C and 350-Degrees-C, Metall. Mater. Trans. A, 1994, 25(6), 1185–1197 CrossRef.
- J. B. Bai, N. Ji, D. Gilbon, C. Prioul and D. Francois, Hydride Embrittlement in Zircaloy-4 Plate. 2. Interaction between the Tensile-Stress and the Hydride Morphology, Metall. Mater. Trans. A, 1994, 25(6), 1199–1208 CrossRef.
- J. B. Bai and D. Francois, Influence of Hydrides on the Strengths of Zircaloy-4 Plate, Advances in Fracture Resistance and Structural Integrity, 1994, pp. 693–700 Search PubMed.
- Y. Z. Liu, Q. Peng, W. J. Zhao and H. M. Jiang, Hydride precipitation by cathodic hydrogen charging method in zirconium alloys, Mater. Chem. Phys., 2008, 110(1), 56–60 CrossRef CAS.
- E. M. Vander Wall, E. M. Whitener and D. L. Bauer, Dissolution of Zirconium and Zircaloy-2 in Nitric-Hydrofluoric Acid Mixtures at Reflux Temperatures Ido-14497, Phillips Petroleum Co. Atomic Energy Division: Idaho Falls, Idaho, 1959 Search PubMed.
- I. Y. Solodov, Ultrasonics of non-linear contacts: propagation, reflection and NDE-applications, Ultrasonics, 1998, 36(1–5), 383–390 CrossRef.
- R. Z. Yang and Y. Z. He, Eddy current pulsed phase thermography considering volumetric induction heating for delamination evaluation in carbon fiber reinforced polymers, Appl. Phys. Lett., 2015, 106(23) CrossRef.
- R. Z. Yang, Y. Z. He, B. Gao, G. Y. Tian and J. P. Peng, Lateral heat conduction based eddy current thermography for detection of parallel cracks and rail tread oblique cracks, Measurement, 2015, 66, 54–61 CrossRef.
- S. P. Sagar, N. Parida, S. Das, G. Dobmann and D. K. Bhattacharya, Magnetic Barkhausen emission to evaluate fatigue damage in a low carbon structural steel, Int. J. Fatigue, 2005, 27(3), 317–322 CrossRef CAS.
- V. Moorthy, B. K. Choudhary, S. Vaidyanathan, T. Jayakumar, K. B. S. Rao and B. Raj, An assessment of low cycle fatigue damage using magnetic Barkhausen emission in 9Cr-1Mo ferritic steel, Int. J. Fatigue, 1999, 21(3), 263–269 CrossRef CAS.
- V. Moorthy, S. Vaidyanathan, T. Jayakumar and B. Raj, On the influence of tempered microstructures on magnetic Barkhausen emission in ferritic steels, Philos. Mag. A, 1998, 77(6), 1499–1514 CAS.
- E. Z. Kordatos, D. G. Aggelis and T. E. Matikas, Monitoring mechanical damage in structural materials using complimentary NDE techniques based on thermography and acoustic emission, Composites, Part B, 2012, 43(6), 2676–2686 CrossRef CAS.
- P. A. Vanniamparambil, U. Guclu and A. Kontsos, Identification of Crack Initiation in Aluminum Alloys using Acoustic Emission, Exp. Mech., 2015, 55(5), 837–850 CrossRef.
- I. Solodov, M. Rahammer, N. Gulnizkij and M. Kreutzbruck, Noncontact Sonic NDE and Defect Imaging via Local Defect Resonance, J. Nondestr. Eval., 2016, 35(3), 48 CrossRef.
- A. Viswanath, B. P. C. Rao, S. Mahadevan, T. Jayakumar and B. Raj, Microstructural characterization of M250 grade maraging steel using nonlinear ultrasonic technique, J. Mater. Sci., 2010, 45(24), 6719–6726 CrossRef CAS.
- P. K. De, J. T. John, S. Banerjee, T. Jayakumar, M. Thavasimuthu and B. Raj, Assessment of hydrogen levels in zircaloy-2 by non-destructive testing, J. Nucl. Mater., 1998, 252(1–2), 43–54 CrossRef CAS.
- S. P. Shavkunov and A. B. Tolkachev, Electrochemical hydrogen evolution at a single-crystal zirconium face in sulfuric acid solutions, Russ. J. Electrochem., 2002, 38(7), 714–719 CrossRef CAS.
- C. H. Lee, M. K. Jeon, C. M. Heo, Y. L. Lee, K. H. Kang and G. I. Park, Effect of Zr Oxide on the Electrochemical Dissolution of Zircaloy-4 Cladding Tubes, J. Electrochem. Soc., 2012, 159(11), E171–E176 CrossRef CAS.
- I. Gardiazabal, R. Schrebler and R. Cordova, The Potentiodynamic Behavior of Zirconium and Zircalloy-4 in Chloride Acid-Media, J. Electroanal. Chem., 1981, 119(2), 389–394 CrossRef CAS.
- M. Chatelut, E. Gobert and O. Vittori, Electrochemical behaviour of zirconium electrodes in acidic medium and their applications to electrowinning of copper from dilute solutions, Hydrometallurgy, 1996, 43(1–3), 287–298 CrossRef CAS.
- J. B. Gill, M. Hall and D. Macintosh, Electrolyte-Solutions in Liquid-Ammonia. 9. Electrodeposition and Electrodissolution of Metals from Their Salts, Electrochim. Acta, 1987, 32(4), 589–595 CrossRef CAS.
- F. S. Martin and B. O. Field, The reactions of zirconium and zirconium based alloys with nitric and nitric-hydrofluoric acids, United Kingdom Atomic Energy Authority, Harwell, Berkshire, UK, 1958 Search PubMed.
- B. S. Haran, B. N. Popov and R. E. White, Theoretical analysis of metal hydride electrodes – Studies on equilibrium potential and exchange current density, J. Electrochem. Soc., 1998, 145(12), 4082–4090 CrossRef CAS.
- B. S. Haran, B. N. Popov and R. E. White, Determination of the hydrogen diffusion coefficient in metal hydrides by impedance spectroscopy, J. Power Sources, 1998, 75(1), 56–63 CrossRef CAS.
- S. Chatterjee, J. A. Krause, A. G. Oliver and W. B. Connick, Intramolecular NH center dot center dot center dot Pt Interactions of Platinum(II) Diimine Complexes with Phenyl Ligands, Inorg. Chem., 2010, 49(21), 9798–9808 CrossRef CAS PubMed.
- S. Chatterjee, G. B. Hall, I. E. Johnson, Y. G. Du, E. D. Walter, N. M. Washton and T. G. Levitskaia, Surprising formation of quasi-stable Tc(VI) in high ionic strength alkaline media, Inorg. Chem. Front., 2018, 5(9), 2081–2091 RSC.
- S. Chatterjee, S. A. Bryan, A. J. Casella, J. M. Peterson and T. G. Levitskaia, Mechanisms of neptunium redox reactions in nitric acid solutions, Inorg. Chem. Front., 2017, 4(4), 581–594 RSC.
- S. Kabekkodu, Powder Diffraction File Inorganic and Organic Data Book, International Center for Diffraction Data, Newtown Square, PA, USA, 2015, vol. 60 Search PubMed.
- C. J. Howard, R. J. Hill and B. E. Reichert, Structures of the Zro2 Polymorphs at Room-Temperature by High-Resolution Neutron Powder Diffraction, Acta Crystallogr., Sect. B: Struct. Sci., 1988, 44, 116–120 CrossRef.
- G. Teufer, Crystal Structure of Tetragonal Zro2, Acta Crystallogr., 1962, 15(Nov), 1187 CrossRef CAS.
- H. Hasegawa, Rhombohedral Phase Produced in Abraded Surfaces of Partially Stabilized Zirconia (Psz), J. Mater. Sci. Lett., 1983, 2(3), 91–93 CrossRef CAS.
- L. M. Lityagina, S. S. Kabalkina, T. A. Pashkina and A. I. Khozyainov, Polymorphism of Zro2 at High-Pressure, Fiz. Tverd. Tela, 1978, 20(11), 3475–3477 CAS.
- R. C. Garvie, Phase Analysis in Zirconia Systems, J. Am. Ceram. Soc., 1972, 55(6), 303–305 CrossRef CAS.
Footnote |
| † Electronic supplementary information (ESI) available: The raw/processed data required to reproduce these findings cannot be shared at this time as the data also forms part of an ongoing study. See DOI: 10.1039/c8ra08693a |
| This journal is © The Royal Society of Chemistry 2019 |

