 Open Access Article
Synthesis and properties of zeolite/N-doped porous carbon for the efficient removal of chemical oxygen demand and ammonia-nitrogen from aqueous solution
Guangzhi Xin a,
Min Wangb,
Lin Chena,
Yuzhou Zhanga,
Meicheng Wanga,
Wenju Jianga and
Yao Chen*a
aCollege of Architecture and Environment, Sichuan University, Chengdu 610065, China. E-mail: chenyao@scu.edu.cn; Fax: +86-28-8540-5613; Tel: +86-28-8540-3016
bSouthwest Oil and Gas Branch Co., SINOPEC, Chengdu 610065, China
First published on 22nd February 2019
Abstract
A novel adsorbent zeolite/N-doped porous activated carbon (ZAC) was prepared by the synthesis of zeolite and mesoporous carbon to remove ammonia nitrogen (NH4+–N) and chemical oxygen demand (COD) from aqueous solution. The impacts of adhesives, molding pressure, synthetic temperature and ratio on ZAC preparation were investigated. The prepared adsorbent was characterized by BET surface area measurement, scanning electron microscopy and X-ray diffraction. The adsorption kinetics was better depicted by the pseudo-second-order model than the pseudo-first-order model and the isotherm fitted well with the Langmuir model. The adsorption process was endothermic, spontaneous and favorable according to thermodynamic data. The adsorbent has much potential in the simultaneous removal of COD and NH4+–N from wastewater.
Introduction
Pollutants from wastewater such as organics, dyes,1,2 heavy metals,3 nitrogen and phosphorus4 have made a serious impact on human beings with the surge of industrialization, urbanization, and scientific and technological innovation.5 According to the China Environmental Statistics Annual Report (2015), 2.24 × 10⁷ tons of chemical oxygen demand (COD) and 2.30 × 10⁶ tons of ammonia nitrogen (NH4+–N) were produced and discharged into wastewaters. As is widely known, large amount of nitrogen is one of the major factors for eutrophication in water bodies, and causes hypoxia or death to hydrophytes and aquatic animals due to its inhibition of oxygen transportation with the surge of algae. In addition, it is also very harmful to water plumbing systems and devices during sewage reuse.6–8Traditionally, techniques and methods such as biodegradation, advanced oxidation, catalytic oxidation, and photocatalysis are employed in COD and NH4+–N removal,9–13 which are usually time-consuming and high-cost. Adsorption is a conventional and widely used method in low-concentration pollution treatment due to its simple operation, low-cost and high adsorption capacity. Each adsorbent has its own advantages and disadvantages; however, it would negate their effects in some extensive application. For example, chitosan shows high adsorption capacities to reactive and basic dyes due to its high content of amino and hydroxy functional groups, but it will be limited by formation of gels under low pH values. Thus, it is important to develop a composite absorbent to integrate precursors' predominance and compensate for their deficiencies. M. Hasan, et al.14 used epichlorohydrin (ECH) as a cross-linking agent to obtain crosslinked chitosan/oil palm composite beads (CC/OPA) for Reactive Blue 19 removal, which improved better stability and mechanical strength of the prepared adsorbent in acid medium. It was also reported that chitosan-g-poly(acrylic acid)/rice husk ash hydrogel composite showed good removal efficiency in high initial methylene blue (MB) concentration.15
Natural materials such as zeolites show considerable adsorption capacities on NH4+–N from aqueous solutions mainly by ion-exchange.16,17 Activated carbon (AC), an effective adsorption material in the removal of pollutants such as dyes and heavy metals from wastewater, gained significant interests because of its high specific surface area and stability of chemical properties. Abundant investigations on AC were focused on the cheap and easy-get precursors such as fly ash,18 activated sludge,19 pine-fruit shell,20 saw dust,21 hevea seed coat,22 palm kernel shell,1,23 oil palm,24 waste tire rubber,25 bamboo.26 Zeolite/activated carbon composite was aimed to acquire the cooperative and bi-functional properties on simultaneous removal of COD and NH4+–N. W. A. Khanday et al. attempted to convert oil palm ash and unburnt carbon into a new composite for removing MB from solutions, of which the MB adsorption capacity value was 138.15 mg g−1 (C0 = 400 mg L−1) at 30 °C and was superior to previous studies.24 It was investigated that an activated carbon–zeolite composite for removing MB and NH4+–N was prepared with AC and kaolin by hydrothermal synthetic method.27 However, in situ synthetic method of composite absorbent is limited in environmental application due to its complicated preparation and operation. A. A. Halim et al. produced one carbon-mineral composite adsorbent with ordinary portland cement (OPC) to degrade COD and NH4+–N from landfill leachate.28 The COD and NH4+–N adsorption capacity were 22.99 mg g−1 (C0 = 2338.29 mg L−1) and 24.39 mg g−1 (C0 = 1890.95 mg L−1), respectively. A certain amount of adhesive can be applied to improve mechanical strength of powdery absorbents in favor of engineering application and transportation.29 A small mass of adhesives was added in raw materials to acquire a cheap and easy-prepared composite absorbent, which had little impact on original adsorption capacity.
The main objective of this investigation was to explore the synthetic method of zeolite/N-doped porous activated carbon (ZAC) and to optimize operation of this novel composite absorbent in simultaneous removal of COD and NH4+–N from aqueous solutions. It is worthy retaining properties of both matrixes in preparation of a new composite absorbent. The composite ZAC was prepared by cementation, extrusion and calcination, successively. The effects of operational parameters, i.e., adhesive, molding pressure, and synthetic temperature were examined. Kinetics, isotherm and thermodynamics models were studied to further understand the adsorption process of ZAC.
Materials and methods
Raw materials
Wood-derived activated carbon NAC (N-doped activated carbon) was obtained from our previous work,27 which derived from wood sawdust (43.1% C, 5.3% H, 0.1% N, 0.1% S and 51.4% O). Commercial zeolite (Z) was purchased from Sinopharm Chemical Reagent Company (CP, Na2O·Al2O3·xSiO2·yH2O), and rinsed several times with distilled water to remove impurity for further application. NAC and Z were grinded and sieved to 200 mesh and dried in an oven (105 °C) for further utilization.MB and ammonium chloride (NH4Cl) were dissolved in distilled water to prepare COD and NH4+–N stock solutions. Working solutions of certain concentration were prepared by consecutive dilution of the standard stock solution. All reagents and chemicals used were of analytical grade quality and obtained from Chron Chemicals.
Preparation of the composite material
NAC and Z were mixed with a mass ratio of 5![[thin space (1/6-em)]](https://www.rsc.org/images/entities/char_2009.gif) :
:![[thin space (1/6-em)]](https://www.rsc.org/images/entities/char_2009.gif) 5 and a certain amount of adhesive was added and fully mixed to improve the compound's intensity and molding cohesiveness. After mixing, the composite was dried in an oven at a temperature of 105 °C to ensure moisture content kept in the range of 30–50%, and then extruded into cylinders with a diameter of 13 mm (powder compressing machine, SYP-15A). The extrudate was loaded in a quartzose reactor placed in a tube furnace (OTF-1200×). The synthesis was carried out by ramping the temperature from room temperature to 200 °C with a heating rate of 10 °C min−1 and hold for 1 h. After calcination and cooling down to room temperature, zeolite/N-doped porous activated carbon (ZAC) composite was obtained.
5 and a certain amount of adhesive was added and fully mixed to improve the compound's intensity and molding cohesiveness. After mixing, the composite was dried in an oven at a temperature of 105 °C to ensure moisture content kept in the range of 30–50%, and then extruded into cylinders with a diameter of 13 mm (powder compressing machine, SYP-15A). The extrudate was loaded in a quartzose reactor placed in a tube furnace (OTF-1200×). The synthesis was carried out by ramping the temperature from room temperature to 200 °C with a heating rate of 10 °C min−1 and hold for 1 h. After calcination and cooling down to room temperature, zeolite/N-doped porous activated carbon (ZAC) composite was obtained.
Adsorption tests
0.05 g ZAC composite and 100 mL simulation wastewater with varying initial COD and NH4+–N concentrations were mixed in a series of Erlenmeyer flasks (250 mL) to carry out batch adsorption experiments. The adsorption isotherms were obtained by batch experiments at different temperatures (15 °C, 25 °C and 35 °C). The mixture was continuously shaken (150 rpm) in a temperature-controlled shaker for 3 h until equilibrium was reached. Then the adsorbent was filtered out to analyze COD and NH4+–N concentration of the residual. Adsorption kinetics was carried out at 25 °C and the initial COD concentrations were 100–1600 mg L−1, respectively. After predetermined time intervals, the adsorbent was filtered out to analyze the final concentration of the supernatant. The effects of adhesives, molding pressure and synthetic temperature on ZAC preparation were justified by adsorption experiments using 0.5 g L−1 ZAC in a series of 100 mL solutions with a COD concentration of 500 mg L−1 and a series of 50 mL solutions with an NH4+–N concentration of 100 mg L−1, respectively.The equilibrium adsorption amount, qe (mg g−1), is calculated by the following equation:
 | (1) |
COD was analyzed by the potassium dichromate method and NH4+–N was analyzed by Nessler's reagent colorimetry method,30 using UV/visible double-beam spectrophotometer (5B-3C Lianhua Corporation, China).
The loss rate was utilized to describe the solidity and stability of the materials. The lower the loss rate, the more water-resistant and stable of the material (eqn (2)). In order to calculate the loss rate, a certain mass of absorbent was put in 50 mL deionized water and agitated in a flask at 150 rpm in a temperature-controlled shaker for 0.5 h. Then the absorbent was filtered and dried under 105 °C to constant weight.
 | (2) |
All experiments were carried out in duplicate, and the average values were reported.
Characterization
The scanning electron microscope (SEM) of the composite were obtained to study the morphology and textural structure of the composite by JSM-7500F (JEOL, Japan), X-ray photoelectron spectroscopy (XPS) was performed on an AXIS Ultra DLD (KRATOS) spectrometer using Al Kα radiation (1486.6 eV) operated at an accelerating power of 150 W.N2 adsorption–desorption method at 77 K was performed to evaluate the surface physical properties of the composite, which were analyzed by ASAP 2460 (Micromeritics Corporation, USA)
The powder X-ray diffraction (XRD) pattern of the composite was recorded in the 2θ ranging between 10° and 80° and using X-Pert PRO MPD (PANalytical B. V. Holland) equipped with Cu Kα radiation (λ = 1.54056 A)° at 30 mA and 30 kV.
Result and discussion
Synthesis
![[thin space (1/6-em)]](https://www.rsc.org/images/entities/char_2009.gif) :
:![[thin space (1/6-em)]](https://www.rsc.org/images/entities/char_2009.gif) 9 to 9
9 to 9![[thin space (1/6-em)]](https://www.rsc.org/images/entities/char_2009.gif) :
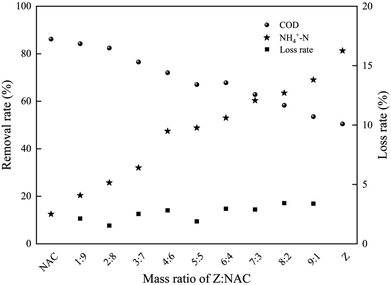
:![[thin space (1/6-em)]](https://www.rsc.org/images/entities/char_2009.gif) 1) of two raw materials. As shown in Fig. 4, pure NAC showed perfect COD removal rate, which was related to its high surface area and mesopore. With larger amount of NAC, the produced ZAC was more favorable on COD removal. However, poor NH4+–N adsorption capacity was also observed in pure NAC due to its non-polar surface. It was reported that NH4+ has better ion-exchange capacity than Na+, aqueous ammonium can be exchanged by Na+ from Na-zeolites such as clinoptilolite31 and mordenite.32 The adsorption capacity of NH4+–N on ZAC with larger content of zeolite was enhanced. Having more zeolite, the ZAC production was much better for NH4+–N adsorption. The efficient and simultaneous removal of both COD and NH4+–N could be achieved by properly adjusting the proportion of two raw materials in ZAC. At a zeolite/NAC mass ratio of 5
1) of two raw materials. As shown in Fig. 4, pure NAC showed perfect COD removal rate, which was related to its high surface area and mesopore. With larger amount of NAC, the produced ZAC was more favorable on COD removal. However, poor NH4+–N adsorption capacity was also observed in pure NAC due to its non-polar surface. It was reported that NH4+ has better ion-exchange capacity than Na+, aqueous ammonium can be exchanged by Na+ from Na-zeolites such as clinoptilolite31 and mordenite.32 The adsorption capacity of NH4+–N on ZAC with larger content of zeolite was enhanced. Having more zeolite, the ZAC production was much better for NH4+–N adsorption. The efficient and simultaneous removal of both COD and NH4+–N could be achieved by properly adjusting the proportion of two raw materials in ZAC. At a zeolite/NAC mass ratio of 5![[thin space (1/6-em)]](https://www.rsc.org/images/entities/char_2009.gif) :
:![[thin space (1/6-em)]](https://www.rsc.org/images/entities/char_2009.gif) 5, a relatively high removal efficiency for both COD and NH4+–N was obtained.
5, a relatively high removal efficiency for both COD and NH4+–N was obtained.
Adsorbent characterization
N2 adsorption–desorption isotherm at 77 K and textural parameters of the composite ZAC (5![[thin space (1/6-em)]](https://www.rsc.org/images/entities/char_2009.gif) :
:![[thin space (1/6-em)]](https://www.rsc.org/images/entities/char_2009.gif) 5) are listed in Table 1. As it is shown in Table 1, there is barely microporous or mesoporous structure in zeolite and its BET surface area is a little low. The high removal efficiency of NH4+–N by zeolite is attributed to ion-exchange. Higher SBET and micropore volume were observed in NAC, which gave rise to good COD adsorption capacity. However, NAC showed unsatisfactory adsorption to NH4+–N due to its nonpolar surface. The existence of mesopore was found in composite ZAC after material synthesis on the basis of isotherm calculation. The composite ZAC acquired simultaneous removal of COD and NH4+–N by combining the advantages of two raw materials, while it had lower surface area in comparison with NAC.
5) are listed in Table 1. As it is shown in Table 1, there is barely microporous or mesoporous structure in zeolite and its BET surface area is a little low. The high removal efficiency of NH4+–N by zeolite is attributed to ion-exchange. Higher SBET and micropore volume were observed in NAC, which gave rise to good COD adsorption capacity. However, NAC showed unsatisfactory adsorption to NH4+–N due to its nonpolar surface. The existence of mesopore was found in composite ZAC after material synthesis on the basis of isotherm calculation. The composite ZAC acquired simultaneous removal of COD and NH4+–N by combining the advantages of two raw materials, while it had lower surface area in comparison with NAC.
| Adsorbents | SBET (m2 g−1) | Vtot (cm3 g−1) | Vmes (cm3 g−1) | Vmic (cm3 g−1) | Dp (nm) |
|---|---|---|---|---|---|
| Zeolite (Z) | 77.21 | 0.6269 | 0.6254 | 0.0014 | 39.4 |
ZAC (5![[thin space (1/6-em)]](https://www.rsc.org/images/entities/char_2009.gif) : :![[thin space (1/6-em)]](https://www.rsc.org/images/entities/char_2009.gif) 5) 5) |
563.61 | 0.5959 | 0.5545 | 0.0414 | 7.70 |
| NAC | 1214.98 | 0.7950 | 0.7040 | 0.0910 | 3.30 |
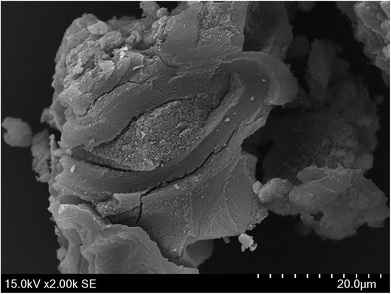
SEM picture of the composite ZAC (1000× magnification) is shown in Fig. 5. It can be observed that the ZAC surface represents clear granular morphology and the powder zeolite and NAC are cohesive by adhesive effect with the help of CMC. Moreover, there was 0.2% N in composite ZAC as shown by XPS results, which was stemmed from nitrogenous NAC; the content of other elements including Al, Si and Na introduced by zeolite were also detected in ZAC.
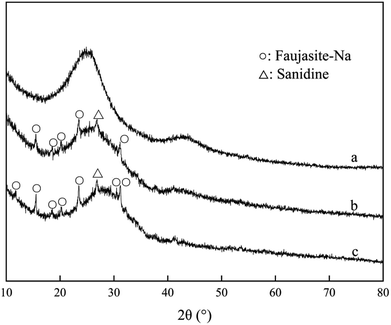
As shown in Fig. 6, diffraction peaks of Na-faujasite and sanidine were displayed on the zeolite. There was no obvious diffraction peak on NAC in small-angle range (2θ = 1–10°), the main peaks detected at 2θ of 26° was characteristic to amorphous carbon. The characteristic peaks of zeolite were appeared on the XRD pattern of ZAC, which showed the effectiveness of material synthesis.
Adsorption
The PFO model is given as a linear equation:33
ln(qe − qt) = ln![[thin space (1/6-em)]](https://www.rsc.org/images/entities/char_2009.gif) qe − k1t qe − k1t
| (3) |
The PSO model is written as:34
 | (4) |
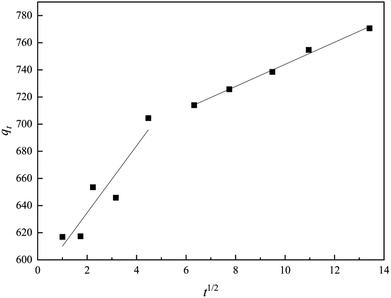
The kinetic parameters and the correlation coefficients (R2) are presented in Table 2. R2 value of PSO model (0.9993) was higher than the one of PFO model (0.9243), and the calculated adsorption capacity (769.23 mg g−1) was in good agreement with the experimental qe (770.64 mg g−1). PSO model was well fitted to the ZAC adsorption process. The PSO kinetic behavior suggested that the adsorption mechanism was the rate controlling step rather than the mass transfer from the solution to the adsorbent's surface, and the adsorption rate of COD on the composite ZAC did not depend on the initial COD concentration but the availability of the adsorption sites.24
| Kinetic model | Parameters | Values |
|---|---|---|
| qe, exp/mg g−1 | 770.64 | |
| Pseudo-first-order | k1 × 10−3/min−1 | 9.92 |
| qe, cal/mg g−1 | 153.33 | |
| R2 | 0.9243 | |
| Pseudo-second-order | k2/g mg−1 min−1 | 0.0007 |
| qe, cal/mg g−1 | 769.23 | |
| R2 | 0.9993 | |
| Intra-particle diffusion | Kid1/(mg (g min1/2)−1) | 24.68 |
| C1 | 585.36 | |
| R12 | 0.8138 | |
| Kid2/(mg (g min1/2)−1) | 8.14 | |
| C2 | 662.69 | |
| R22 | 0.9921 |
The intra-particle diffusion model is also applied to explore the adsorption progress, which is represented by the following equation:35
| qt = kidt1/2 + C | (5) |
As illustration by the intra-particle diffusion model: if the fitting plot gives a straight line, the adsorption process is impacted by an intra-particle diffusion; if this line passes through the origin, intra-particle diffusion is a rate determining step.24,36 As displayed in Fig. 7, the plots could be divided into two parts. Lines were straight but did not cross the origin, indicating that intra-particle diffusion was not the single rate-determining step. The much larger slope of the first line proved that the COD removal rate by ZAC was high in the beginning, because of the instantaneous availability of large surface area and active sites. The gradual slope of the second line showed a slow adsorption rate due to concentration gradient decreasing and slower adsorbate diffusion.37
| T/°C | qe, exp/mg g−1 | Langmuir | Freundlich | Temkin | ||||||
|---|---|---|---|---|---|---|---|---|---|---|
| KL/L mg−1 | qmax/mg g−1 | R2 | n | KF | R2 | A | B | R2 | ||
| 15 | 1086.54 | 0.025 | 1119.04 | 0.9923 | 4.37 | 227.85 | 0.9879 | 5.16 | 117.33 | 0.9478 |
| 25 | 1109.75 | 0.027 | 1139.81 | 0.9918 | 4.22 | 225.25 | 0.9528 | 4.10 | 125.25 | 0.9621 |
| 35 | 1109.52 | 0.032 | 1137.69 | 0.9941 | 4.54 | 254.71 | 0.9606 | 8.08 | 116.41 | 0.9685 |
The Langmuir isotherm model is usually used to depict monomolecular layer adsorption on the active sites of the absorbent surface. It is expressed by the following equation:38
 | (6) |
 | (7) |
The Freundlich isotherm assumes non-ideal adsorption taking place on a heterogeneous surface and adsorption energy decreasing logarithmically with adsorption capacity decreasing. It is given by the following empirical equation:40
| qe = KFCe1/n | (8) |
The Temkin isotherm suggests a linear decrease of adsorption energy with adsorption capacity decreasing, which is similar to Freundlich model.41 It is usually applied as the following form:
qe = B![[thin space (1/6-em)]](https://www.rsc.org/images/entities/char_2009.gif) ln ln![[thin space (1/6-em)]](https://www.rsc.org/images/entities/char_2009.gif) A + B A + B![[thin space (1/6-em)]](https://www.rsc.org/images/entities/char_2009.gif) ln ln![[thin space (1/6-em)]](https://www.rsc.org/images/entities/char_2009.gif) Ce Ce
| (9) |
As listed in Table 3, the adsorption capacity qe progressively increased with the equilibrium concentration of COD (Ce) in aqueous solution, showing that the equilibrium adsorption capacity was positively affected by the temperature. The highest qe value (1109.75 mg g−1) was observed in 25 °C for the initial COD concentration of 1633.33 mg L−1, which is well consistent with calculated value qmax 1139.81 mg g−1.
As listed in Table 3, R2 of the Langmuir isotherm is evidently higher than others, which means the Langmuir model is more applicable for the experimental data and the COD adsorption process onto composite ZAC is mono-layer adsorption. The value of RL for adsorption of COD onto ZAC was 0.024, 0.022, 0.019 at 15 °C, 25 °C, 35 °C, respectively. It indicated that the adsorption n was favorable in most situations. Moreover, the Freundlich constant n is a deviation measure. The value n = 4.54 was greater than unity and showed that COD adsorption process by the composite ZAC was favorable.42
ΔG0 = −RT![[thin space (1/6-em)]](https://www.rsc.org/images/entities/char_2009.gif) ln ln![[thin space (1/6-em)]](https://www.rsc.org/images/entities/char_2009.gif) KD KD
| (10) |
 | (11) |
The relationship among ΔG0, ΔH0 and ΔS0 is expressed by:
| ΔG0 = ΔH0 − TΔS0 | (12) |
Based on (10) and (11), eqn (12) can be rearranged by following:
 | (13) |
![[thin space (1/6-em)]](https://www.rsc.org/images/entities/char_2009.gif) KD versus 1/T (Table 4).
KD versus 1/T (Table 4).
| T/°C | COD adsorption | ||
|---|---|---|---|
| ΔG0/(kJ mol−1) | ΔS0/(J mol−1 K−1) | ΔH0/(kJ mol−1) | |
| 15 | −3.50 | 27.88 | 4.56 |
| 25 | −3.67 | ||
| 35 | −4.07 | ||
The negative values of ΔG0 revealed that the COD adsorption onto the composite ZAC was favorable and spontaneous. Moreover, the positive value 4.56 kJ mol−1 of ΔH0 demonstrated that the adsorption process was endothermic and physisorption,43 which was in good agreement with the adsorption isotherm. The ΔS0 value was also positive (27.88 J mol−1 K−1), which represented the randomness increasing at the solid/solution interface during the adsorption process.
Conclusions
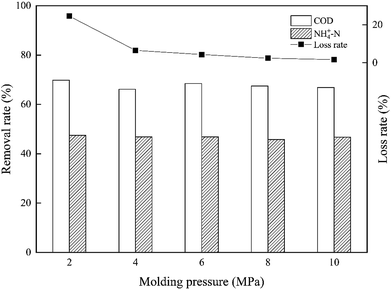
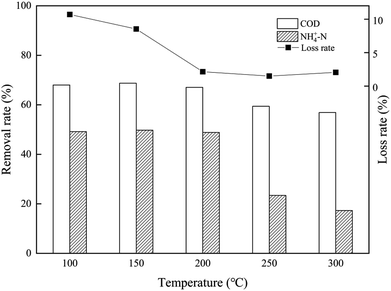
The synthetic composite ZAC showed good adsorption capacity in simultaneous removal of COD and NH4+–N. The effects of adhesives (CMC, PVA, and sodium silicate), molding pressure (2–10 MPa), and synthetic temperature (100–300 °C) on ZAC production were studied and optimized. With addition of 15% CMC, mixed in a synthetic ratio of 5![[thin space (1/6-em)]](https://www.rsc.org/images/entities/char_2009.gif) :
:![[thin space (1/6-em)]](https://www.rsc.org/images/entities/char_2009.gif) 5 (zeolite/NAC) by mass, extruded under 8 MPa and heated at 200 °C for 1 h, the produced composite ZAC had a maximum removal rate of 68% COD and 49% NH4+–N. The kinetics, equilibrium, and thermodynamics parameters for the adsorption process were investigated. The adsorption kinetics was well fitted the PSO kinetic model. In contrast to Freundlich and Temkin isotherm models, the equilibrium adsorption data were better depicted by Langmuir isotherm according to a higher R2 value. The adsorption process of COD onto ZAC was endothermic, spontaneous and favorable on the thermodynamics analysis.
5 (zeolite/NAC) by mass, extruded under 8 MPa and heated at 200 °C for 1 h, the produced composite ZAC had a maximum removal rate of 68% COD and 49% NH4+–N. The kinetics, equilibrium, and thermodynamics parameters for the adsorption process were investigated. The adsorption kinetics was well fitted the PSO kinetic model. In contrast to Freundlich and Temkin isotherm models, the equilibrium adsorption data were better depicted by Langmuir isotherm according to a higher R2 value. The adsorption process of COD onto ZAC was endothermic, spontaneous and favorable on the thermodynamics analysis.
Conflicts of interest
There are no conflicts to declare.Acknowledgements
We would like to acknowledge the funding support by National Science and Technology Major Project of the Ministry of Science and Technology of China (grant no. 2016ZX05017-005-008).References
- A. Jumasiah, T. G. Chuah, J. Gimbon, T. S. Y. Choong and I. Azni, Desalination, 2005, 186, 57–64 CrossRef CAS.
- A. A. Ahmad, B. H. Hameed and N. Aziz, J. Hazard. Mater., 2007, 141, 70–76 CrossRef CAS PubMed.
- K. A. Krishnan and T. S. Anirudhan, Ind. Eng. Chem. Res., 2002, 41, 5085–5093 CrossRef CAS.
- A. Oehmen, P. C. Lemos, G. Carvalho, Z. Yuan, J. Keller, L. L. Blackall and M. A. M. Reis, Water Res., 2007, 41, 2271–2300 CrossRef CAS PubMed.
- P. Hadi, M. Xu, C. Ning, C. S. K. Lin and G. Mckay, Chem. Eng. J., 2015, 260, 895–906 CrossRef CAS.
- Y. Zhang, F. Yu, W. Cheng, J. Wang and J. Ma, Journal of Chemistry, 2017, 2017, 9 Search PubMed.
- Z. Hong, L. Han, H. Ma, Z. Yan, H. Zhang, D. Liu and S. Liang, J. Hazard. Mater., 2008, 158, 577–584 CrossRef PubMed.
- D. J. Randall and T. K. Tsui, Mar. Pollut. Bull., 2002, 45, 17–23 CrossRef CAS PubMed.
- Y. Q. Liu, Y. P. Moy and J. H. Tay, Enzyme Microb. Technol., 2007, 42, 23–28 CrossRef.
- M. S. Lucas and J. A. Peres, J. Hazard. Mater., 2009, 168, 1253–1259 CrossRef CAS PubMed.
- P. C. C. Faria, J. J. M. Órfão and M. F. R. Pereira, Appl. Catal., B, 2009, 88, 341–350 CrossRef CAS.
- S. He, J. Li, J. Xu and L. Mo, BioResources, 2016, 11, 8396–8408 CAS.
- M. Altomare, G. L. Chiarello, A. Costa, M. Guarino and E. Selli, Chem. Eng. J., 2012, 191, 394–401 CrossRef CAS.
- M. Hasan, A. L. Ahmad and B. H. Hameed, Chem. Eng. J., 2008, 136, 164–172 CrossRef CAS.
- M. G. Vaz, A. G. B. Pereira, A. R. Fajardo, A. C. N. Azevedo and F. H. A. Rodrigues, Water, Air, Soil Pollut., 2017, 228, 14 CrossRef.
- H. Huang, X. Xiao, Y. Bo and L. Yang, J. Hazard. Mater., 2010, 175, 247–252 CrossRef CAS PubMed.
- D. Karadag, Y. Koc, M. Turan and B. Armagan, J. Hazard. Mater., 2006, 136, 604–609 CrossRef CAS PubMed.
- D. Mohan, K. P. Singh, A. Gurdeep Singh and K. Kumar, Ind. Eng. Chem. Res., 2002, 41, 3688–3695 CrossRef CAS.
- S. Rio, C. Faur-Brasquet, L. L. Coq and P. L. Cloirec, Environ. Sci. Technol., 2005, 39, 4249–4257 CrossRef CAS PubMed.
- B. Royer, N. F. Cardoso, E. C. Lima, J. C. Vaghetti, N. M. Simon, T. Calvete and R. C. Veses, J. Hazard. Mater., 2009, 164, 1213–1222 CrossRef CAS PubMed.
- P. K. Malik, J. Hazard. Mater., 2004, 113, 81–88 CrossRef CAS PubMed.
- B. H. Hameed and F. B. M. Daud, Chem. Eng. J., 2008, 139, 48–55 CrossRef CAS.
- E. S. Abechi, C. E. Gimba, A. Uzairu and J. A. Kagbu, Arch. Appl. Sci. Res., 2011, 46, 154–164 Search PubMed.
- W. A. Khanday, F. Marrakchi, M. Asif and B. H. Hameed, J. Taiwan Inst. Chem. Eng., 2017, 70, 32–41 CrossRef CAS.
- E. L. K. Mui, W. H. Cheung, M. Valix and G. Mckay, Microporous Mesoporous Mater., 2010, 130, 287–294 CrossRef CAS.
- B. H. Hameed, A. T. Din and A. L. Ahmad, J. Hazard. Mater., 2007, 141, 819–825 CrossRef CAS PubMed.
- M. Wang, R. Xie, Y. Chen, X. Pu, W. Jiang and L. Yao, Bioresour. Technol., 2018, 268, 726–732 CrossRef CAS PubMed.
- H. Azhar Abdul, A. Hamidi Abdul, J. Megat Azmi Megat and A. Kamar Shah, Desalination, 2010, 262, 31–35 CrossRef.
- D. Nguyen-Thanh and T. J. Bandosz, Carbon, 2005, 43, 359–367 CrossRef CAS.
- A. A. Halim, H. A. Aziz, M. A. M. Johari, K. S. Ariffin and M. N. Adlan, J. Hazard. Mater., 2010, 175, 960–964 CrossRef PubMed.
- R. Leyva-Ramos, G. Aguilar-Armenta, L. V. Gonzalez-Gutierrez, R. M. Guerrero-Coronado and J. Mendoza-Barron, J. Chem. Technol. Biotechnol., 2010, 79, 651–657 CrossRef.
- Y. Wang, Y. Kmiya and T. Okuhara, Water Res., 2007, 41, 269–276 CrossRef CAS PubMed.
- S. K. Lagergren, K. Sven. Vetenskapsakad. Handl., 1898, 24, 1–39 Search PubMed.
- Y. S. Ho, Water Res., 2006, 40, 119–125 CrossRef CAS PubMed.
- W. J. Weber and J. C. Morris, J. Sanit. Eng. Div., Am. Soc. Civ. Eng., 1963, 89, 31–60 Search PubMed.
- H. Y. Zhu, Y. Q. Fu, R. Jiang, J. H. Jiang, L. Xiao, G. M. Zeng, S. L. Zhao and Y. Wang, Chem. Eng. J., 2011, 173, 494–502 CrossRef CAS.
- Y. Li, Q. Du, T. Liu, J. Sun, Y. Wang, S. Wu, Z. Wang, Y. Xia and L. Xia, Carbohydr. Polym., 2013, 95, 501–507 CrossRef CAS PubMed.
- I. Langmuir, J. Chem. Phys., 1918, 40, 1361–1403 CAS.
- G. Mckay, H. S. Blair and J. R. Gardner, J. Appl. Polym. Sci., 2010, 29, 1499–1514 CrossRef.
- H. F. M. Freundlich, Z. Phys. Chem., 1906, 57, 385–470 CAS.
- R. D. Johnson and F. H. Arnold, Biochim. Biophys. Acta, 1995, 1247, 293–297 CrossRef.
- A. S. Özcan, B. Erdem and A. Özcan, Colloids Surf., A, 2005, 266, 73–81 CrossRef.
- W. P. Cheng, W. Gao, X. Cui, J. H. Ma and R. F. Li, J. Taiwan Inst. Chem. Eng., 2016, 62, 192–198 CrossRef CAS.
| This journal is © The Royal Society of Chemistry 2019 |


