 Open Access Article
LSA: a local-weighted structural alignment tool for pharmaceutical virtual screening†
Xiuming Li‡
a,
Xin Yan‡*a,
Yuedong Yangc,
Qiong Gu a,
Huihao Zhoua,
Yunfei Duc,
Yutong Luc,
Jielou Liaod and
Jun Xu
 *ab
*ab
aResearch Center for Drug Discovery, School of Pharmaceutical Sciences, Sun Yat-Sen University, 132 East Circle at University City, Guangzhou 510006, China. E-mail: junxu@biochemomes.com
bSchool of Computer Science & Technology, Wuyi University, 99 Yingbin Road, Jiangmen 529020, China
cNational Supercomputer Center in Guangzhou, School of Data and Computer Science, Sun Yat-Sen University, 132 East Circle at University City, Guangzhou 510006, China
dDepartment of Chemical Physics, University of Science and Technology of China, Jinzhai Road 96, Hefei 230026, China
First published on 29th January 2019
Abstract
Similar structures having similar activities is a dogma for identifying new functional molecules. However, it is not rare that a minor structural change can cause a significant activity change. Methods to measure the molecular similarity can be classified into two categories of overall three-dimensional shape based methods and local substructure based methods. The former states the relation between overall similarity and activity, and is represented by conventional similarity algorithms. The latter states the relation between local substructure and activity, and is represented by conventional substructure match algorithms. Practically, the similarity of two molecules with similar activity depends on the contributions from both overall similarity and local substructure match. We report a new tool termed as a local-weighted structural alignment (LSA) tool for pharmaceutical virtual screening, which computes the similarity of two molecular structures by considering the contributions of both overall similarity and local substructure match. LSA consists of three steps: (1) mapping a common substructure between two molecular topological structures; (2) superimposing two three-dimensional molecular structures with substructure focus; (3) computing the similarity score based on superimposing. LSA has been validated with 102 testing compound libraries from DUD-E collection with the average AUC (the area under a receiver-operating characteristic curve) value of 0.82 and an average EF1% (the enrichment factor at top 1%) of 27.0, which had consistently better performance than conventional approaches. LSA is implemented in C++ and run on Linux and Windows systems.
Introduction
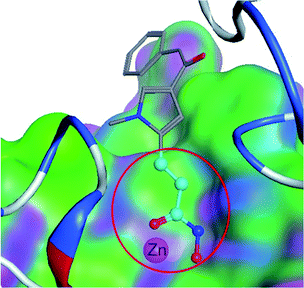
Ligand-based virtual drug lead screening1 is based on the principle of “similar structures having similar activities”.2 There are many methods to measure the similarity of two molecular structures. These methods can be classified into two categories: (1) overall three-dimensional shape based methods, such as ROCS3 and WEGA,4 and (2) local substructure based methods,5 such as atom-pairs,6 ECFP,7 or substructure search methods.8 The former uses the relation between overall steric similarity and activity regardless of covalent connectivity. The latter uses the relation between substructure (local covalent connectivity) and activity regardless of global shape.9 Practically, the similarity of two molecules with similar activity depends on both overall and local similarity factors,10 but also global shape and local substructures. There is not yet a similarity method that can combine both overall and local similarity factors. Therefore, the similarity measured by shape based methods cannot result in consistent similarity activity relations;11 and the substructure or atom-pair search algorithms cannot satisfy scientists in discovering novel lead compounds or elucidating activity–substructure relations.12In medicinal chemistry, functional groups (substructures) at a molecule do not contribute to the activity equally. One substructure13 can be significantly more important than the other substructures, and is termed as a privileged substructure (or fragment).14 Fig. 1 shows an HDAC (histone deacetylase)15 inhibitor and its privileged substructure (highlighted in red circle). This substructure is the core substructure because a pan HDAC inhibitor must have a chelator “warhead” binding Zn2+ ion. Without this core substructure, the agent will not be active regardless of how the rest of the molecule is similar to an HDAC inhibitor. A substructure match algorithm (such as GMA8) can be employed to determine if a molecule is qualified for a potential HDAC inhibitor by checking the chelator16 “warhead” existence in the molecule.
However, the rest of an HDAC inhibitor is still important and responsible for selectively binding to HDAC target (molecular recognition). The molecular recognition part of the HDAC inhibitor is associated with the overall molecular structure similarity,17 which can be calculated through global shape comparison (three-dimensional structure superimposing). A molecular shape comparison algorithm can be used to predict the potency of a molecular being an HDAC inhibitor by calculating the overall similarity to a known HDAC inhibitor.
Therefore, LSA is reported to compute the similarity of two molecular structures by considering the contributions of both overall similarity and local substructure match.
LSA consists of the following main steps:
(1) Mapping a common substructure between two molecular topological structures.
(2) Superimposing two three-dimensional molecular structures with substructure focused. LSA will assign weights to atoms in the substructure mappings acquired from step (1) when superimposing.
(3) Computing the similarity score based on the superimposing using Tanimoto protocol.
Methods
Specifying core query substructure
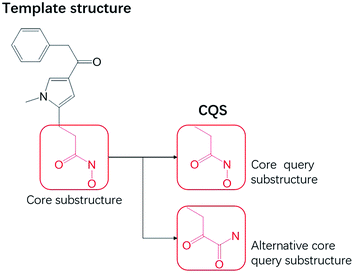
A core query substructure (CQS) is a common substructure between two molecular topological structures, and can be derived from a template molecule (a compound with known activity).18 A CQS represents topological features a hit candidate must possess. From a template structure, a user can specify more than one substructure (Fig. 2) for a CQS.Mapping common substructure
By reference to GMA,8 CQS are mapped from a template molecule (A) to a potential hit structure (B). If mapping M (CQS, A → B) ≠ ∅, then M can have multiple mappings. Each mapped atom is marked as the more important atom than non-mapped atoms in molecules A and B.Superimposing two steric structures with the substructure mappings
Restricted WEGA (rWEGA), a modified WEGA, was developed to conduct the conditional structural superimposing with the restrictions of the substructure mappings.With such restriction, rWEGA will no longer treat every overlaid atom-pair equally while calculating steric structure similarity. The atoms in the atom-pairs of the mappings will be assigned with a weight wa (if the atom in molecule A) or wb (if the atom in molecule B) to address that these atoms are more important than other atoms regarding the contributions to the activity. The weights are computed with eqn (1) and (2).
 | (1) |
 | (2) |
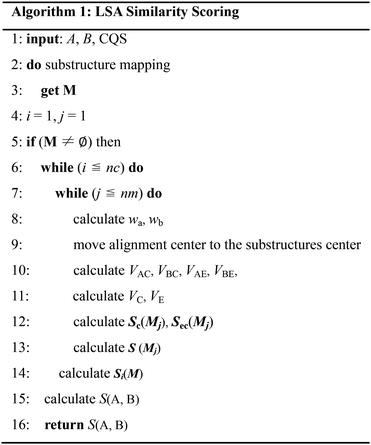
The LSA similarity scoring calculation in rWEGA is described in Algorithm 1.
Let vij be the intersection weighted-Gaussian volume4 of atom i and atom j. VAC, VBC, VAE, VBE, VC, VE are computed in eqn (3)–(8):
 | (3) |
 | (4) |
 | (5) |
 | (6) |
 | (7) |
 | (8) |
Sc(Mj) is the core substructure similarity of A and B based on the jth mapping. Sec(Mj) is the structural similarity of A and B based on the jth mapping excluding the core substructures. S(Mj) is the similarity of A and B based on the jth mapping. If M have multiple substructure mappings, take the maximum S(M) as the similarity of A and B. Sc(Mj), Sec(Mj), S(Mj) and S(M) are computed in eqn (9)–(12):
 | (9) |
 | (10) |
 | (11) |
| S(M) = Max(S(Mj)), j ∈ 1…nm | (12) |
If molecule B have multiple conformations, take the maximum as the final similarity of A and B. Let Si(M) be the similarity of A and B for the ith conformation of B, S(A, B) is the final similarity score of molecule A and B calculated from the values of Si(M) as shown in eqn (13).
| S(A, B) = Max(Si(M)), i ∈ 1…nc | (13) |
Method for validating LSA
The validation data were taken from the Directory of Useful Decoys collection19 (DUD-E) which consists of 102 compound libraries, which are associated with 102 protein targets. Each targeted library has one template active compound, active and “decoy” compounds, and their chemical structures.§In order to validate LSA, three-dimensional conformations of the compound structures in the libraries were generated by CAESAR20 module in Discovery Studio (version 3.5) with the energy interval of 20 kcal mol−1. The CQS were specified by reference to the common structure of “active” molecules derived from DUD-E.¶
AUC (the area under a receiver-operating characteristic curve) values and enrichment factors (EF) at the top x% (x = 1, 5, 10) are used to measure the performance of LSA when it is used in virtual pharmaceutical screening experiments. EFx% is calculated:
| EFx% = (TPx%/N%selected)/(Nactives/Ntotal) | (14) |
Results
The results of virtual screening 102 targeted libraries
102 targeted libraries were virtually screened using template structures with specified core substructures. It costs about 20 minutes to screen every 10![[thin space (1/6-em)]](https://www.rsc.org/images/entities/char_2009.gif) 000 molecules (each with 50 conformations). The virtual screening performances comparison measured with AUC and EF values are depicted as Table 1.
000 molecules (each with 50 conformations). The virtual screening performances comparison measured with AUC and EF values are depicted as Table 1.
| Method | AUC | EF1% | EF5% | EF10% |
|---|---|---|---|---|
| WEGA | 0.74 | 20.7 | 7.5 | 4.4 |
| Rigid-LS-align | — | 20.1 | 6.9 | 4.3 |
| Flexi-LS-align | 0.75 | 22.0 | 7.2 | 4.5 |
| SPOT-ligand2 | — | 24.1 | 8.6 | 5.2 |
| LSA | 0.82 | 27.0 | 10.3 | 6.1 |
Compared to WEGA, the screening performance of LSA were significantly improved. The mean AUC of DUD-E collection by LSA is 0.82, while WEGA gives a mean AUC of 0.74. LSA can achieve an average EF1% of 27.0, which is about 30.4% higher than that of WEGA. We also calculated the median AUC. The median AUC of DUD-E collection by LSA is 0.84, while WEGA gives a median AUC of 0.72. All results of LSA and WEGA were treated with Wilcoxon signed rank test, p < 0.001. The virtual screening performances of 89.2% (91/102) libraries were improved with LSA, indicating that LSA had consistently better performance than WEGA. The detailed AUC results are provided in ESI (Table S1†). The ROC (receiver-operating characteristic) curves of the top-12 most performance improved targeted libraries (targeting UROK, CAH2, HDAC2, ADRB1, PYGM, ADRB2, MK10, PLK1, HIVINT, ACE, ROCK1 and THRB) virtual screenings using LSA and WEGA are depicted in Fig. 3, in which the curves in red are for LSA and the curves in black are for WEGA. The turning points of the curves are usually at the earlier stages of ROC curves, indicating that screening less than 20% of the compounds in a library can capture more than 80% intrinsic hits with LSA.
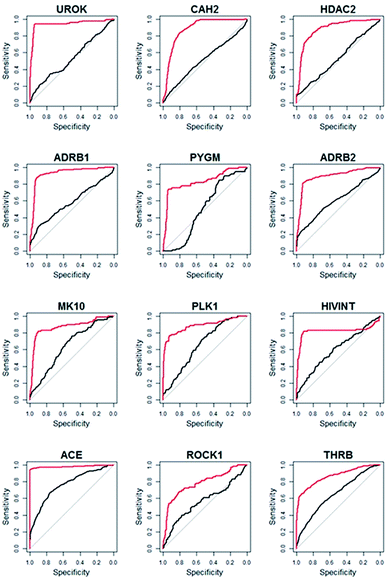 | ||
| Fig. 3 The ROC curves of top-12 most performance improved targeted libraries virtual screenings using LSA and WEGA. The curves in red are for LSA and the curves in black are for WEGA. | ||
We further compared LSA with LS-align21 and SPOT-ligand2 (ref. 22) which had been reported recently. It can be seen that LSA consistently had better performance as well. The EF1% values by LSA are 22.7% and 12.0% higher than that by Flexi-LS-align and SPOT-ligand2 respectively. To further investigated the performance within DUD-E, we split DUD-E collection into four categories,21 including kinases, proteases, nuclear receptors and GPCRs. The EF results of WEGA, Rigid-LS-align and LSA are as depicted in Table 2.
| Categories (#proteins) | Method | EF1% | EF5% | EF10% |
|---|---|---|---|---|
| Kinases (26) | WEGA | 17.7 | 6.4 | 3.8 |
| Rigid-LS-align | 19 | 6.5 | 4.2 | |
| LSA | 26.4 | 10.2 | 5.9 | |
| Proteases (15) | WEGA | 14.4 | 6.2 | 4.0 |
| Rigid-LS-align | 15.4 | 6.3 | 4.3 | |
| LSA | 24.9 | 11.3 | 6.5 | |
| Nuclear receptors (11) | WEGA | 27.8 | 9.0 | 5.4 |
| Rigid-LS-align | 22.2 | 7.2 | 4.6 | |
| LSA | 22.3 | 8.9 | 5.7 | |
| GPCRs (5) | WEGA | 9.6 | 3.8 | 2.7 |
| Rigid-LS-align | 16.6 | 5.5 | 3.6 | |
| LSA | 18.0 | 7.0 | 5.9 |
Superimposing two three-dimensional structures with LSA
LSA can be named as a 3D-substructure search engine, which superimposes two steric structures with substructure match restrictions. As shown in Fig. 4, LSA superimposes a compound against a template HDAC inhibitor (CHEMBL275089). In WEGA, two molecules are superimposed using the entire molecular mass center as the focused point. In LSA, however, two molecules are superimposed using the core substructure as the focused center. LSA starts from standard orientations and optimizes with four possible unique initial alignments.4 The superimposing is optimized toward the large volume of core substructures base on the weight assignment. Therefore, LSA can be used as a better tool to dock a molecule into a binding pocket for a co-crystal complex if the native ligand and the privileged substructure(s) or “a warhead” of the ligand is known.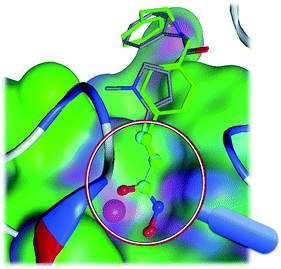 | ||
| Fig. 4 The superimposed structures. The core substructures are superimposed in the magnifier. The molecule in green is CHEMBL343068 and the other molecule is CHEMBL275089 as in Fig. 1. | ||
Conclusions
LSA reflects the fact that a privileged substructure is more important than the rest of the chemical structure in a query/template structure in virtual screening a compound library. After validating LSA with 102 targeted compound libraries, we have proved that the three-dimensional substructure search algorithm does result in improved virtual screening performance.However, there might exist multiple privileged core substructures in a query structure. LSA cannot handle these cases. Although, these cases are rare.
Successfully applying LSA depends also on correctly specifying a core query substructure in a template structure. A larger core query substructure may result in no hits. A user should figure out the balance point of this technology. Our experience indicates that LSA is more suitable for screening bioactive compounds with a “warhead”, or a covalent binding group.23
Conflicts of interest
There are no conflicts to declare.Acknowledgements
This work has funded in part of the science & technology program of Guangzhou (201604020109), the science & technology planning project of Guangdong Province (2016A020217005), GD Frontier & Key Techn. Innovation Program (2015B010109004), GD-NSF (2016A030310228), the National Key R&D Program of China (2017YFB02034043), Guangdong Provincial Key Lab of Construction Foundation (2011A060901014), Natural Science Foundation of China (U1611261, 61772566, 81773636) and the fundamental research funds for the central universities under grant 17LGJC23.Notes and references
- X. Yan, C. Liao, Z. Liu, A. T. Hagler, Q. Gu and J. Xu, Curr. Drug Targets, 2016, 17, 1580–1585 CrossRef CAS PubMed.
- A. Nicholls, G. B. McGaughey, R. P. Sheridan, A. C. Good, G. Warren, M. Mathieu, S. W. Muchmore, S. P. Brown, J. A. Grant, J. A. Haigh, N. Nevins, A. N. Jain and B. Kelley, J. Med. Chem., 2010, 53, 3862–3886 CrossRef CAS PubMed.
- J. A. Grant and B. T. Pickup, J. Phys. Chem., 1995, 99, 3503–3510 CrossRef CAS.
- X. Yan, J. B. Li, Z. H. Liu, M. H. Zheng, H. Ge and J. Xu, J. Chem. Inf. Model., 2013, 53, 1967–1978 CrossRef CAS PubMed.
- M. Sastry, J. F. Lowrie, S. L. Dixon and W. Sherman, J. Chem. Inf. Model., 2010, 50, 771–784 CrossRef CAS PubMed.
- D. H. S. Raymond, E. Carhart and R. Venkataraghavan, J. Chem. Inf. Comput. Sci., 1985, 25, 64–73 CrossRef.
- D. Rogers and M. Hahn, J. Chem. Inf. Model., 2010, 50, 742–754 CrossRef CAS PubMed.
- J. Xu, J. Chem. Inf. Comput. Sci., 1996, 36, 25–38 CrossRef CAS.
- G. M. Sastry, S. L. Dixon and W. Sherman, J. Chem. Inf. Model., 2011, 51, 2455–2466 CrossRef CAS PubMed.
- H. Cai, T. Wang, Z. Yang, Z. Xu, G. Wang, H. Y. Wang, W. Zhu and K. Chen, J. Chem. Inf. Model., 2017, 57, 2329–2335 CrossRef CAS PubMed.
- O. Ivanciuc, Curr. Comput.-Aided Drug Des., 2013, 9, 153–163 CrossRef CAS PubMed.
- Y. Hu, D. Stumpfe and J. Bajorath, F1000Research, 2013, 2, 199 Search PubMed.
- H. Peng, Z. Liu, X. Yan, J. Ren and J. Xu, Sci. Rep., 2017, 7, 11121 CrossRef PubMed.
- S. Barelier and I. Krimm, Curr. Opin. Chem. Biol., 2011, 15, 469–474 CrossRef CAS PubMed.
- D. P. Dowling, S. L. Gantt, S. G. Gattis, C. A. Fierke and D. W. Christianson, Biochemistry, 2008, 47, 13554–13563 CrossRef CAS PubMed.
- H. Park, S. Kim, Y. E. Kim and S. J. Lim, ChemMedChem, 2010, 5, 591–597 CrossRef CAS PubMed.
- P. J. Ballester and W. G. Richards, J. Comput. Chem., 2007, 28, 1711–1723 CrossRef CAS PubMed.
- J. Kirchmair, S. Distinto, P. Markt, D. Schuster, G. M. Spitzer, K. R. Liedl and G. Wolber, J. Chem. Inf. Model., 2009, 49, 678–692 CrossRef CAS PubMed.
- M. M. Mysinger, M. Carchia, J. J. Irwin and B. K. Shoichet, J. Med. Chem., 2012, 55, 6582–6594 CrossRef CAS PubMed.
- J. Li, T. Ehlers, J. Sutter, S. Varma-O'brien and J. Kirchmair, J. Chem. Inf. Model., 2007, 47, 1923–1932 CrossRef CAS PubMed.
- J. Hu, Z. Liu, D.-J. Yu, Y. Zhang and A. Valencia, Bioinformatics, 2018, 34, 2209–2218 CrossRef PubMed.
- T. Litfin, Y. Zhou and Y. Yang, Bioinformatics, 2017, 33, 1238–1240 CAS.
- J. Du, X. Yan, Z. Liu, L. Cui, P. Ding, X. Tan, X. Li, H. Zhou, Q. Gu and J. Xu, Bioinformatics, 2017, 33, 1258–1260 CAS.
Footnotes |
| † Electronic supplementary information (ESI) available. See DOI: 10.1039/c8ra08915a |
| ‡ Equal contributors. |
| § The Directory of Useful Decoys (DUD-E) collection are available in the website, http://dude.docking.org/. |
| ¶ LSA software and user guide can be downloaded for academic use at https://github.com/MingCPU/LSA.git |
| This journal is © The Royal Society of Chemistry 2019 |

