 Open Access Article
Preparation and processing of porous sulfur foams having low thermal conductivity†
Vijay S. Wadi,
Kishore K. Jena,
Shahrukh Z. Khawaja,
Vengatesan Muthukumarswamy Ranagraj and
Saeed M. Alhassan *
*
Department of Chemical Engineering, Khalifa University of Science and Technology, P. O. Box 127788, Abu Dhabi, United Arab Emirates. E-mail: saeed.alkhazraji@ku.ac.ae
First published on 5th February 2019
Abstract
Sulfur-containing polymers prepared via the inverse vulcanization technique have attracted considerable attention due to the feasibility of the method to produce stable polysulfides with up to 50–90 wt% of sulfur and their wide range of applications from Li–S batteries to catalysis, self-healing and optical materials. Despite many applications, the development of new advanced materials using sulfur is still in the initial stage. Herein, we reported the preparation and processing of a porous sulfur foam for low thermal conductivity applications by combining inverse vulcanization and template removal techniques. Initially, water-soluble template-embedded cross-linked polysulfides were prepared and hot-pressed to the required shape and size. Later, pores were generated by dissolving the template in water. The porosity of the foam was altered by varying the particle size of template materials. The effects of the templates on the porosity and morphology were discussed and correlated with thermal conductivity. The sulfur foam with a smaller pore size and high porosity showed significant decrease in the thermal conductivity up to ∼0.032 W m−1 K−1 at 25 °C, which was much lower than that of pristine sulfur (0.205 W m−1 K−1). The present method offers flexibility to modify the foam structure and properties during preparation and processing.
Introduction
Increase in energy demand and overproduction of oil and gas produce excess of sulfur, and the abundant availability of this un-tapped, low-cost sulfur has attracted many researchers to develop advanced materials.1 However, the processing of sulfur is challenging due to its limited solubility and poor compatibility with organic compounds. Moreover, the physical and chemical properties of sulfur depend on the temperature, which makes it more difficult to handle.2,3 These issues were solved by the inverse vulcanization technique; in this method, the active sulfur chain ends were reacted with organic dienes to produce a highly cross-linked stable polymer.4 This technique enables the preparation of polysulfides with up to 50–90 wt% sulfur and the method can also be applied to scale up the process to the kilogram scale.5 The advantage of this technique is that the properties of the polysulfides can be easily altered by changing cross-linkers and their amounts during synthesis.6 Thus, various synthetic7,8 and naturally occurring organic dienes9–11 have been used as cross-linkers12 and in a wide range of applications such as in Li–S batteries13–15 and as photoelectron catalysts for water splitting,16 IR transparent high-refractive-index optical materials,17,18 and self-healing materials19 as well as in the synthesis of nanoparticles.17,20 Although sulfur-rich polymers have gained significant attention, the development of advanced materials is still in the initial stage, thus offering an opportunity to develop new materials and applications using sulfur.Recently, a porous sulfur foam was recognised as one of the alternatives to remove toxic metals from water and gas streams. The high surface area of the foam enables the maximum absorption of toxic pollutants from water and gas streams.10,21,22 Hasell et al. first reported the preparation of a porous sulfur foam by creating supercritical carbon dioxide (scCO2) in a reaction vessel.23 The foams showed high porosities and surface areas; however, the preparation method involved the risk of applying high temperature and pressure to generate scCO2. Later, this method was simplified by employing the salt template method to obtain a porous structure and was efficiently used to remove mercury from wastewater.21 However, controlling the porosity and morphology and their effects on the structural property of the foams have not been fully explored.
In our previous work, we demonstrated the capturing of elemental mercury (Hg(0)) from the gas phase using a sulfur foam.24 Herein, we reported the preparation and processing of a pore size-controlled sulfur foam via inverse vulcanization and template removal techniques. The porosities of the foams were altered by varying the particle size of the water-soluble template. The effects of porosity on the morphology and surface area of the foam were discussed and correlated to the thermal conductivity at different temperatures (25 °C to 100 °C).
Experimental
Preparation of sulfur foams
Sulfur foams were prepared by combining template removal and inverse vulcanization techniques. A representative example for the preparation of the sulfur foam (NaSD) using sodium chloride (NaCl) as the template is as follows: elemental sulfur and NaCl in a 2![[thin space (1/6-em)]](https://www.rsc.org/images/entities/char_2009.gif) :
:![[thin space (1/6-em)]](https://www.rsc.org/images/entities/char_2009.gif) 3 ratio (4 g sulfur and 6 g NaCl) were mixed and ground into a fine powder using a pestle and mortar. The powder was transferred to a preheated beaker at 170 °C in an oil bath and mixed thoroughly as the sulfur melted. To this mixture, divinyl benzene (DVB) (4 mL) was added drop by drop and within 10–15 minutes, the mixture vitrified and the colour turned to brown. The obtained solid mass was crushed to small granules and hot-pressed into the required shape and size at 150 °C for 20 min. The hot-pressed circular shaped sample was then soaked in water overnight to dissolve the template and generate the porous structure. The obtained foams were finally dried in a vacuum oven at 60 °C for 4–6 h. The sample was designated as NaSD. A similar procedure was also applied to prepare sulfur foams using sodium carbonate (Na2CO3) and poly(sodium 4-styrenesulfonate) (PS) as the templates and the corresponding products were denoted as CNaSD and PSSD.
3 ratio (4 g sulfur and 6 g NaCl) were mixed and ground into a fine powder using a pestle and mortar. The powder was transferred to a preheated beaker at 170 °C in an oil bath and mixed thoroughly as the sulfur melted. To this mixture, divinyl benzene (DVB) (4 mL) was added drop by drop and within 10–15 minutes, the mixture vitrified and the colour turned to brown. The obtained solid mass was crushed to small granules and hot-pressed into the required shape and size at 150 °C for 20 min. The hot-pressed circular shaped sample was then soaked in water overnight to dissolve the template and generate the porous structure. The obtained foams were finally dried in a vacuum oven at 60 °C for 4–6 h. The sample was designated as NaSD. A similar procedure was also applied to prepare sulfur foams using sodium carbonate (Na2CO3) and poly(sodium 4-styrenesulfonate) (PS) as the templates and the corresponding products were denoted as CNaSD and PSSD.
Characterization
The samples were characterized using techniques similar to those used in our previously reported work.24 The structures of the prepared samples were confirmed with NMR spectra, which were recorded on a Bruker Avance 400 MHz spectrometer in deuterated chloroform (CDCl3) and the chemical shifts were reported relative to tetramethylsilane (TMS) as the internal standard. Fourier-transform infrared spectroscopy (FT-IR) was performed using Bruker Vertex 70 between 500 cm−1 and 4000 cm−1. The samples were loaded in the transmission mode after pressing into a KBr pellet. The thermal properties were studied by differential scanning calorimetry (DSC) on Discovery Series (TA Instruments). The samples were subjected to two heating cycles and one cooling cycle. The temperature was varied from −30 to 200 °C at a ramp rate of 10 °C min−1 under a nitrogen atmosphere. The glass transition temperature (Tg) was determined from the second cycle of the thermogram. Thermogravimetric analysis (TGA) was used to determine the thermal stability of these samples and it was conducted from room temperature to 700 °C using a Discovery TGA (USA) thermal analyzer at a heating rate of 10 °C min−1 under a nitrogen atmosphere with a flow rate of 10 mL min−1. Diffraction (XRD) patterns were collected using an analytical X'Pert PRO powder diffractometer (Cu-Kα radiation 1.5406 Å, 40 kV, 40 mA) in the 2θ range of 5–60°. The surface morphology of the composite was characterized by a scanning electron microscope (SEM, Quanta FEG-250). The true densities of the samples were analysed by Ultra-pycnometer 1000 by Quantachrome.Results and discussions
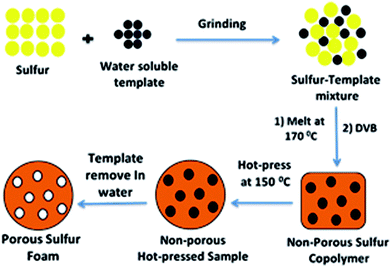
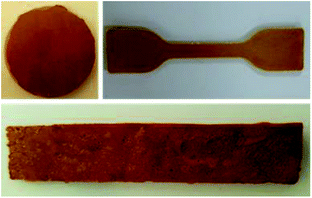
The general method for preparing a porous sulfur foam via template removal and inverse vulcanization methods is demonstrated in Fig. 1.In this method, initially, template-embedded polysulfides were prepared and hot-pressed to the required shape and size and later treated with water to generate a porous structure. The porosity generated in the foam was mainly governed by the particle size and the physical nature of the template. Hence, it was possible to control the morphology of the foams by the selection of the template materials. Thus, water-soluble compounds such as NaCl, Na2CO3, and PS possessing different particle sizes were chosen as templates to vary the porosity. The main advantage of this method is that the polysulfide properties and porosity can be easily altered during the synthesis and the required foam shape can be obtained in the processing step. The digital images of the hot-pressed samples in different shapes are presented in Fig. 2, suggesting the applicability of the method to prepare samples in diverse shapes and sizes. The objects were intact and free standing, indicating the formation of a strong cross-linked polymer.
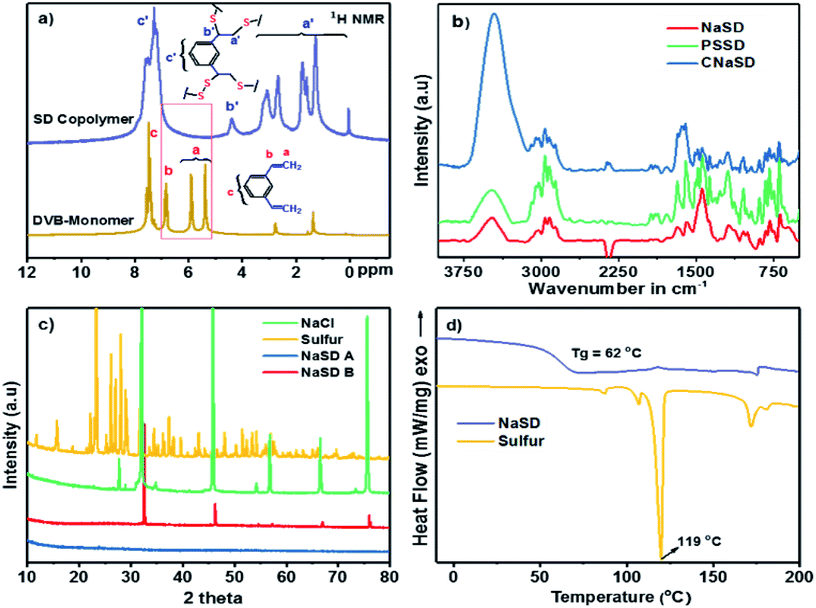
The structural analysis and cross-linking reaction of the polymer were confirmed by 1H NMR spectroscopy. The stacked 1H NMR spectrum of the DVB monomer and the cross-linked polymer (SD) is presented in Fig. 3a. In the spectrum, the two alkene CH2 protons of DVB appear at 5.40 and 5.90 ppm and the CH proton appears at 6.83 ppm. These peaks disappeared in the spectrum of SD and new complex aliphatic proton peaks appeared between 1.0 and 3.5 ppm, which confirmed the successful reaction of alkene groups with sulfur. The absence of alkene peaks also ensured the complete consumption of the monomers during the cross-linking reaction. The complexity in the aliphatic region could be due to the fact that the bulk reaction of sulfur and DVB leads to complex cross-linked microstructures.
The FTIR spectra of the sulfur foams are shown in Fig. 3b. The carbon–carbon double bond (C![[double bond, length as m-dash]](https://www.rsc.org/images/entities/char_e001.gif) C) peak at 1633 cm−1 completely disappeared and the new C–S stretching peak at 648 cm−1 appeared, which further supported the cross-linking reaction. The band appearing at ∼2950 cm−1 was attributed to methylene stretching in CH–CH2 and S–CH2 units. All the samples showed a broad peak near 3300 cm−1, which was assigned to the OH group that appeared due to the presence of a trace amount of water from water treatment.
C) peak at 1633 cm−1 completely disappeared and the new C–S stretching peak at 648 cm−1 appeared, which further supported the cross-linking reaction. The band appearing at ∼2950 cm−1 was attributed to methylene stretching in CH–CH2 and S–CH2 units. All the samples showed a broad peak near 3300 cm−1, which was assigned to the OH group that appeared due to the presence of a trace amount of water from water treatment.
X-ray diffraction was used to study the change in the crystallization behaviour of sulfur before and after the cross-linking reaction. A representative example of pure sulfur compared with NaSD and NaCl is presented in Fig. 3c. Sulfur is crystalline in nature; it showed sharp peaks (sulfur 2θ = 23°, 27°, 28°, 53° and 56°), which were absent after the cross-linking reaction, suggesting the formation of an amorphous polymer. Pure NaCl showed the characteristic crystalline diffraction peaks, i.e., 2θ = 31°, 46°, 56°, and 66°; these peaks were also observed for the sample before water treatment. However, the peaks completely disappeared after water treatment, which confirmed the removal of salt from the polymer. Similar results were also observed for the samples containing Na2CO3 and PS as templates (Fig. S1†).
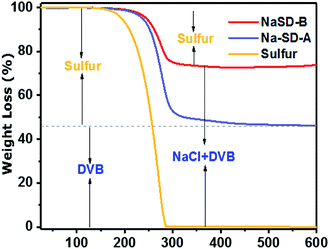
The thermal properties of the prepared samples were studied by DSC and TGA. A representative DSC thermogram of the NaSD foam and pure sulfur is presented in Fig. 3d. Pure sulfur showed a sharp melt transition at T = 119 °C, which indicated its highly crystalline nature. However, the melt transition was absent in the foam after the cross-linking reaction, which further supported the conversion of crystalline sulfur to an amorphous polymer; this was also in good agreement with the XRD results. Tg of the foam was observed well above the room temperature, i.e., at 62 °C, which supported the amorphous nature of the polysulfides. The thermal stability of the sulfur and polymer before and after water treatment was studied by TGA (Fig. 4). Pure sulfur showed initial degradation at 190 °C and degraded completely around 290 °C. However, polysulfides started to degrade at 236 °C, which was much higher than that of pure sulfur; this suggested increased thermal stability due to the strong cross-linking structure. The samples before water treatment (NaSD-B) showed 30% weight loss and 70 wt% residue at 600 °C. The weight loss was due to the degradation of the thermally less stable sulfur and the residue was from the combined weight of DVB and NaCl. However, the foam NaSD-A showed 53 wt% sulfur degradation and 47 wt% residue, which suggested the formation of a robust cross-linked polymer. The weight loss and residue were in good agreement with the initial feed ratio of sulfur and DVB, which further supported the complete conversion of monomers to polymer.
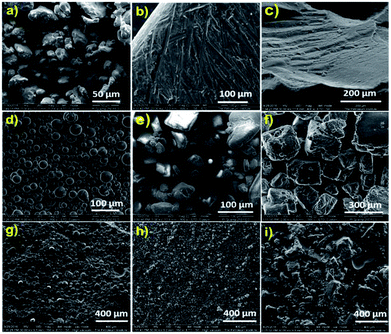
The surface morphology of the samples was analysed by scanning electron microscopy. Fig. 5 shows the SEM images of pure sulfur, various water-soluble templates and the corresponding polysulfides. Powdered elemental sulfur showed particles with irregular shapes (Fig. 5a); however, on heating above the melting point, sulfur melted and was rearranged to a highly crystalline structure, as shown in Fig. 5b. During the inverse vulcanization reaction, cross-linking destroyed the crystalline arrangements of sulfur and it turned into a uniform amorphous polymer (Fig. 5c). The templates PS, Na2CO3 and NaCl used to generate porous structures are presented in Fig. 5d, e and f, respectively. The image shows that the PS particles are spherical in shape and have sizes between 20 and 40 μm, whereas the Na2CO3 particles measure around 100–200 μm and the NaCl particles have sizes between 200 and 500 μm. The polysulfides prepared using corresponding templates (Fig. 5g–i) showed homogeneous dispersion and the surface roughness reflected the shape of the template loaded in the sample. These templates were dissolved in water to generate a porous structure. The amount of template removed was calculated and is presented in Table 1. The samples showed approximately 92–96% removal of the templates by water, which suggested that the particles were interconnected in the cross-linked polysulfide matrix.
| Sample name | Initial wt. of samplea in grams | Final wt. of the sample after water treatment in grams | Wt. of the template in the sample in grams (theoretically calculated) | Wt. of the template dissolved in water in grams | Wt% of template removed after water treatment |
|---|---|---|---|---|---|
a All samples were prepared in the constant weight ratio of template![[thin space (1/6-em)]](https://www.rsc.org/images/entities/char_2009.gif) : :![[thin space (1/6-em)]](https://www.rsc.org/images/entities/char_2009.gif) sulfur sulfur![[thin space (1/6-em)]](https://www.rsc.org/images/entities/char_2009.gif) : :![[thin space (1/6-em)]](https://www.rsc.org/images/entities/char_2009.gif) salt = 3 salt = 3![[thin space (1/6-em)]](https://www.rsc.org/images/entities/char_2009.gif) : :![[thin space (1/6-em)]](https://www.rsc.org/images/entities/char_2009.gif) 2 2![[thin space (1/6-em)]](https://www.rsc.org/images/entities/char_2009.gif) : :![[thin space (1/6-em)]](https://www.rsc.org/images/entities/char_2009.gif) 2. Templates were removed by soaking all samples overnight in water. 2. Templates were removed by soaking all samples overnight in water. |
|||||
| NaSD | 3.8 | 2.31 | 1.63 | 1.49 | ∼92 |
| CNaSD | 3.5 | 2.08 | 1.5 | 1.42 | ∼95 |
| PSSD | 2.9 | 1.7 | 1.24 | 1.2 | ∼96 |
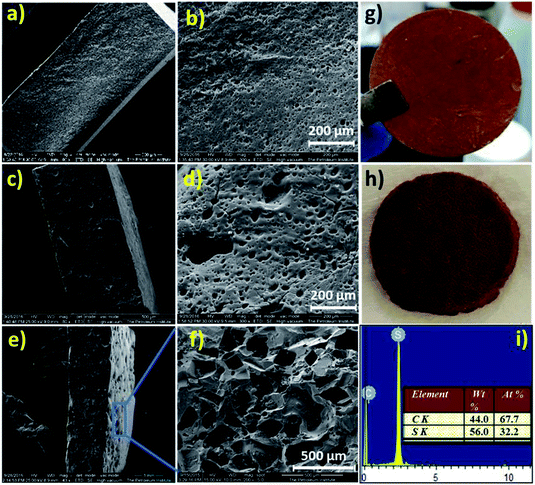
Digital images of the hot-pressed NaSD sample before and after water treatment are shown in Fig. 6g and h, respectively. The circular shape of the sample was not altered even after the removal of the template (Fig. 6h), which suggested the formation of a stable and intact foam.
The cross sections and surface morphologies of the foams analysed by SEM are presented in Fig. 6. All the samples displayed highly porous structures and the nature of the pores resembled the type of template used. The NaSD foam prepared using NaCl showed a larger pore size around 250–500 μm, whereas the CNaSD and PSSD foams showed pores in the range of 20–50 μm. A comparison of the template sizes and the pores generated by them after water treatment is shown in Fig. S2,† which confirms that the pore size and porosity can be controlled by templates. Similarly, the cross section images of all the samples also showed pores sizes comparable to the surface, which indicated that the template particles were interconnected, thus leading to the complete removal by water treatment. Thus, the pores obtained were a mixture of open and closed cells. However, the pore size distribution was uneven, which was attributed to the irregular size and shape of the template particles. The presence of only sulfur and carbon peaks in the EDX (Fig. 6e) results also supported the complete removal of the templates. The elemental mappings of the corresponding polymers are presented in Fig. S3.† The total surface area of the sample is determined by its porosity; however, SEM provides only information about the pore structure and size since the pores formed in the samples are micro to macro in size, which also restricts the use of BET to determine the porosity. Thus, a mathematical formula given in eqn (1) was used to determine the % porosity by measuring the densities of the foams.
 | (1) |
In general, low-density particles are expected to decrease the overall density and increase the porosity of the material. Thus, for comparison, all the samples were prepared with a constant weight ratio of template and reactants (template![[thin space (1/6-em)]](https://www.rsc.org/images/entities/char_2009.gif) :
:![[thin space (1/6-em)]](https://www.rsc.org/images/entities/char_2009.gif) sulfur
sulfur![[thin space (1/6-em)]](https://www.rsc.org/images/entities/char_2009.gif) :
:![[thin space (1/6-em)]](https://www.rsc.org/images/entities/char_2009.gif) DVB = 3
DVB = 3![[thin space (1/6-em)]](https://www.rsc.org/images/entities/char_2009.gif) :
:![[thin space (1/6-em)]](https://www.rsc.org/images/entities/char_2009.gif) 2
2![[thin space (1/6-em)]](https://www.rsc.org/images/entities/char_2009.gif) :
:![[thin space (1/6-em)]](https://www.rsc.org/images/entities/char_2009.gif) 2). The densities of the templates and the calculated porosities of the corresponding foams are given in Table 2. NaCl particles exhibited less volume due to their high density, which led to an intact foam with the lowest porosity of 40.23%. However, low-density PS particles acquired a larger volume compared to NaCl and decreased the overall density of the foam. The removal of the templates from the polymer led to increase in the porosity and decrease in the overall density (Table 2). Smaller PS particles resulted in a higher pore volume and more surface area and hence, PSSD samples showed lower density with high porosity of 59.09%. The relationship between density and porosity in the foam was plotted, as presented in Fig. 7a, clearly showing that the low-density foam produces high porosity. An increase in the template weight ratio >70 wt% resulted in fragile samples due to the less cross-linking density and the connectivity between sulfur and DVB; thus, the formed samples could easily break into powder. Hence, an optimum amount of template was required to obtain high porosity as well as a stable and intact structure. The amount of cross-linker also plays a major role in controlling the porosity of a foam. The samples with a small amount of cross-linker exhibited maximum porosity, which was primarily because of less cross-linking density and thus less volume shrinkage. Moreover, the samples with more cross-linkers possessed less porosities, which can be attributed to the higher volume shrinkage associated with higher cross-linking density.24 The porosity governs the surface area of the material; smaller pores result in a higher surface area of the sample. Thus, the porosity and surface area of the foam can be controlled by the template material. Thermal conductivity is a measure of heat conducted by the material at a given temperature. Pure sulfur possesses considerable low thermal conductivity (∼0.205 W m−1 K−1)25 and the generation of a porous structure can further decrease its thermal conductivity. The effective thermal conductivity as a function of temperature for pure sulfur and sulfur foams is shown in Fig. 7. Please note that each specimen was tested at four different temperatures. The porous foams showed low thermal conductivity compared to pure sulfur (Fig. 7). The thermal conductivity of the sample mainly depends on the porosity and hence, PSSD with the highest porosity showed the lowest thermal conductivity of 0.032 W m−1 K−1 at 25 °C. The thermal conductivity of the polymer is expected to increase with the temperature, especially near and above the glass transition temperature.26 However, the porous sulfur polymers were not affected much by the temperature and showed slight increase in the thermal conductivity with an increase in temperature up to 100 °C. This suggested that the less mobility of the sulfur chains and the stability of the porous structure were due to a highly cross-linked structure.
2). The densities of the templates and the calculated porosities of the corresponding foams are given in Table 2. NaCl particles exhibited less volume due to their high density, which led to an intact foam with the lowest porosity of 40.23%. However, low-density PS particles acquired a larger volume compared to NaCl and decreased the overall density of the foam. The removal of the templates from the polymer led to increase in the porosity and decrease in the overall density (Table 2). Smaller PS particles resulted in a higher pore volume and more surface area and hence, PSSD samples showed lower density with high porosity of 59.09%. The relationship between density and porosity in the foam was plotted, as presented in Fig. 7a, clearly showing that the low-density foam produces high porosity. An increase in the template weight ratio >70 wt% resulted in fragile samples due to the less cross-linking density and the connectivity between sulfur and DVB; thus, the formed samples could easily break into powder. Hence, an optimum amount of template was required to obtain high porosity as well as a stable and intact structure. The amount of cross-linker also plays a major role in controlling the porosity of a foam. The samples with a small amount of cross-linker exhibited maximum porosity, which was primarily because of less cross-linking density and thus less volume shrinkage. Moreover, the samples with more cross-linkers possessed less porosities, which can be attributed to the higher volume shrinkage associated with higher cross-linking density.24 The porosity governs the surface area of the material; smaller pores result in a higher surface area of the sample. Thus, the porosity and surface area of the foam can be controlled by the template material. Thermal conductivity is a measure of heat conducted by the material at a given temperature. Pure sulfur possesses considerable low thermal conductivity (∼0.205 W m−1 K−1)25 and the generation of a porous structure can further decrease its thermal conductivity. The effective thermal conductivity as a function of temperature for pure sulfur and sulfur foams is shown in Fig. 7. Please note that each specimen was tested at four different temperatures. The porous foams showed low thermal conductivity compared to pure sulfur (Fig. 7). The thermal conductivity of the sample mainly depends on the porosity and hence, PSSD with the highest porosity showed the lowest thermal conductivity of 0.032 W m−1 K−1 at 25 °C. The thermal conductivity of the polymer is expected to increase with the temperature, especially near and above the glass transition temperature.26 However, the porous sulfur polymers were not affected much by the temperature and showed slight increase in the thermal conductivity with an increase in temperature up to 100 °C. This suggested that the less mobility of the sulfur chains and the stability of the porous structure were due to a highly cross-linked structure.
| Sample name | Density before water treatment at RT in g cm−3 | Density after water treatment at RT in g cm−3 | % porosity |
|---|---|---|---|
| Sulfur | 1.96 | N/A | N/A |
| NaCl | 2.16 | N/A | N/A |
| Na2CO3 | 2.25 | N/A | N/A |
| PS | 0.80 | N/A | N/A |
| NaSD | 1.63 | 0.88 | 40.23 |
| CNaSD | 1.52 | 0.76 | 52.13 |
| PSSD | 1.03 | 0.53 | 59.09 |
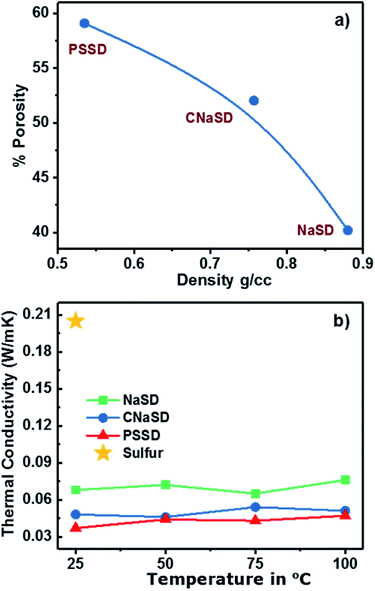 | ||
| Fig. 7 (a) Relationship between density and porosity of the copolymer. (b) Thermal conductivity of pure sulfur and porous sulfur copolymers at different temperatures. | ||
A comparison of the thermal conductivity of sulfur foams with those of commonly available insulators is shown in Table 3. Most of the commercial insulators such as polyester, nylon and phenolic foams exhibited higher conductivities than the sulfur foam except for PU foams. Hence, the synthesized material has the potential to be a good thermal insulator.
Conclusions
Herein, we showed a simple synthetic route to prepare a porosity-controlled sulfur foam with a high sulfur content and demonstrated the ability of the product to be used as a good thermal insulator. The pore size and porosity of the sulfur foam were manipulated by the selection of templates having different particle sizes. We also showed the ability of the method to process the foams in required shapes and sizes during the hot-press process. The smaller size and low density of the template particles play a major role in improving the porosity and final density of the foam. The thermal conductivity of the porous sulfur foams was significantly lower than that of pristine sulfur, and it was close to that of the commercially available insulator in the range of 0.035–0.16 W m−1 K−1. The lowest thermal conductivity of ∼0.032 W m−1 K−1 was achieved for the foam prepared using a small-sized template. The thermal conductivity of the foams was stable up to 100 °C, which also suggested the applicability of the sulfur foam in a wide range of temperatures. This method offers simple preparation and processing steps to prepare sulfur foams with low thermal conductivity insulators.Conflicts of interest
There are no conflicts to declare.Acknowledgements
This work is funded by the Gas Subcommittee of Abu Dhabi National Oil Company (ADNOC) Research & Development.References
- J. Lim, J. Pyun and K. Char, Angew. Chem., Int. Ed., 2015, 54, 3249–3258 CrossRef CAS PubMed.
- B. Meyer, Chem. Rev., 1976, 76, 367–388 CrossRef CAS.
- B. Meyer, N. Kharasch and I. Sulphur, Elemental sulfur: chemistry and physics, Interscience, New York, London, 1965 Search PubMed.
- W. J. Chung, J. J. Griebel, E. T. Kim, H. Yoon, A. G. Simmonds, H. J. Ji, P. T. Dirlam, R. S. Glass, J. J. Wie, N. A. Nguyen, B. W. Guralnick, J. Park, A. Somogyi, P. Theato, M. E. Mackay, Y.-E. Sung, K. Char and J. Pyun, Nat. Chem., 2013, 5, 518–524 CrossRef CAS.
- J. J. Griebel, G. Li, R. S. Glass, K. Char and J. Pyun, J. Polym. Sci., Part A: Polym. Chem., 2015, 53, 173–177 CrossRef CAS.
- D. A. Boyd, Angew. Chem., Int. Ed., 2016, 55, 15486–15502 CrossRef CAS PubMed.
- M. Arslan, B. Kiskan and Y. Yagci, Macromolecules, 2016, 49, 767–773 CrossRef CAS.
- K. Yamabuki, K. Itaoka, I.-t. Kim, N. Yoshimoto and H. Tsutsumi, Polymer, 2016, 91, 1–6 CrossRef CAS.
- M. P. Crockett, A. M. Evans, M. J. H. Worthington, I. S. Albuquerque, A. D. Slattery, C. T. Gibson, J. A. Campbell, D. A. Lewis, G. J. L. Bernardes and J. M. Chalker, Angew. Chem., Int. Ed., 2016, 55, 1714–1718 CrossRef CAS PubMed.
- M. J. H. Worthington, R. L. Kucera, I. S. Albuquerque, C. T. Gibson, A. Sibley, A. D. Slattery, J. A. Campbell, S. F. K. Alboaiji, K. A. Muller, J. Young, N. Adamson, J. R. Gascooke, D. Jampaiah, Y. M. Sabri, S. K. Bhargava, S. J. Ippolito, D. A. Lewis, J. S. Quinton, A. V. Ellis, A. Johs, G. J. L. Bernardes and J. M. Chalker, Chem.–Eur. J., 2017, 23, 16219–16230 CrossRef CAS PubMed.
- I. Gomez, O. Leonet, J. A. Blazquez and D. Mecerreyes, ChemSusChem, 2016, 9, 3419–3425 CrossRef CAS PubMed.
- J. J. Griebel, R. S. Glass, K. Char and J. Pyun, Prog. Polym. Sci., 2016, 58, 90–125 CrossRef CAS.
- P. T. Dirlam, A. G. Simmonds, T. S. Kleine, N. A. Nguyen, L. E. Anderson, A. O. Klever, A. Florian, P. J. Costanzo, P. Theato, M. E. Mackay, R. S. Glass, K. Char and J. Pyun, RSC Adv., 2015, 5, 24718–24722 RSC.
- I. Gomez, D. Mecerreyes, J. A. Blazquez, O. Leonet, H. Ben Youcef, C. Li, J. L. Gómez-Cámer, O. Bondarchuk and L. Rodriguez-Martinez, J. Power Sources, 2016, 329, 72–78 CrossRef CAS.
- Z. Sun, M. Xiao, S. Wang, D. Han, S. Song, G. Chen and Y. Meng, J. Mater. Chem. A, 2014, 2, 9280–9286 RSC.
- S. Zhuo, Y. Huang, C. Liu, H. Wang and B. Zhang, Chem. Commun., 2014, 50, 11208–11210 RSC.
- J. C. Bear, W. J. Peveler, P. D. McNaughter, I. P. Parkin, P. O'Brien and C. W. Dunnill, Chem. Commun., 2015, 51, 10467–10470 RSC.
- J. J. Griebel, S. Namnabat, E. T. Kim, R. Himmelhuber, D. H. Moronta, W. J. Chung, A. G. Simmonds, K. J. Kim, J. v. d. Laan, N. A. Nguyen, E. L. Dereniak, M. E. Mackay, K. Char, R. S. Glass, R. A. Norwood and J. Pyun, Adv. Mater., 2014, 26, 3014–3018 CrossRef CAS PubMed.
- M. Arslan, B. Kiskan and Y. Yagci, Sci. Rep., 2017, 7, 5207 CrossRef PubMed.
- E. T. Kim, W. J. Chung, J. Lim, P. Johe, R. S. Glass, J. Pyun and K. Char, Polym. Chem., 2014, 5, 3617–3623 RSC.
- D. J. Parker, H. A. Jones, S. Petcher, L. Cervini, J. M. Griffin, R. Akhtar and T. Hasell, J. Mater. Chem. A, 2017, 5, 11682–11692 RSC.
- N. A. Lundquist, M. J. H. Worthington, N. Adamson, C. T. Gibson, M. R. Johnston, A. V. Ellis and J. M. Chalker, RSC Adv., 2018, 8, 1232–1236 RSC.
- T. Hasell, D. J. Parker, H. A. Jones, T. McAllister and S. M. Howdle, Chem. Commun., 2016, 52, 5383–5386 RSC.
- A. M. Abraham, S. V. Kumar and S. M. Alhassan, Chem. Eng. J., 2018, 332, 1–7 CrossRef CAS.
- A. Sugawara, J. Appl. Phys., 1965, 36, 2375–2377 CrossRef CAS.
- A. Tessema, D. Zhao, J. Moll, S. Xu, R. Yang, C. Li, S. K. Kumar and A. Kidane, Polym. Test., 2017, 57, 101–106 CrossRef CAS.
- J.-W. Wu, W.-F. Sung and H.-S. Chu, Int. J. Heat Mass Transfer, 1999, 42, 2211–2217 CrossRef CAS.
- D. R. Anderson, Chem. Rev., 1966, 66, 677–690 CrossRef CAS.
- D. E. Kline, J. Polym. Sci., 1961, 50, 441–450 CrossRef CAS.
- H. Chen, V. V. Ginzburg, J. Yang, Y. Yang, W. Liu, Y. Huang, L. Du and B. Chen, Prog. Polym. Sci., 2016, 59, 41–85 CrossRef CAS.
- C. L. Choy, Polymer, 1977, 18, 984–1004 CrossRef CAS.
- G. Hakvoort, L. L. van Reijen and A. J. Aartsen, Thermochim. Acta, 1985, 93, 317–320 CrossRef CAS.
Footnote |
| † Electronic supplementary information (ESI) available. See DOI: 10.1039/c8ra09127g |
| This journal is © The Royal Society of Chemistry 2019 |

