DOI:
10.1039/C8RA09207A
(Paper)
RSC Adv., 2019,
9, 3102-3112
Synthesis, structures and properties of six lanthanide complexes based on a 2-(2-carboxyphenyl)imidazo(4,5-f)-(1,10)phenanthroline ligand†
Received
7th November 2018
, Accepted 11th January 2019
First published on 22nd January 2019
Abstract
Six lanthanide complexes [Tb(2-NCP)2(NO3)]n (1), [Eu(2-NCP)2(3-PYC)]n (2), [Sm(2-NCP)2(3-PYC)]n (3), [Eu(2-NCP)(SA)]n (4), [Tb(2-NCP)(SA)]n (5) and [Tb(2-NCP)(AA)]n (6) (2-HNCP = 2-(2-carboxyphenyl)imidazo(4,5-f)-(1,10)phenanthroline, 3-HPYC = pyridine-3-carboxylic acid, H2SA = succinic acid, H2AA = adipic acid) have been synthesized by hydrothermal route, and the crystal structures were analyzed through elemental analysis, infrared spectroscopy, single crystal X-ray diffraction. Complexes 1 and 6 present two-dimensional (2D) layers, which are further connected to three-dimensional (3D) supramolecular architectures through C–H⋯π interactions. Complexes 2 and 3 exhibit infinite one-dimensional chains. Finally, the neighboring chains are packed by C–H⋯π interactions, giving rise to 3D supramolecular network. Complexes 4 and 5 display 2D layers, which are further extend to 3D supramolecular structures via C–H⋯O intermolecular hydrogen bonding. Six complexes possess good thermal stabilities, characteristic photoluminescence properties, and photocatalytic activities for the degradation of organic dyes under visible light irradiation. In addition, the complex 6 exhibits significantly enhanced photocatalytic activity for methylene blue, and the degradation rate could reach 81.2% in 370 min. Meanwhile trapping experiments indicated that the hole, ·O2− and ·OH are the main activated species. Furthermore, by comparing the photoluminescent and photocatalytic mutation results of same metal complexes induced by interconversion of coligands, we confirm that the properties mutation induced by coligands is much obvious and controllable.
Introduction
The past decade has seen an exponential growth of reports dealing with complexes, which are being studied for their possible application in adsorption and separation,1–4 luminescence,5 magnetism,6 sensor7 and catalysis,8–11 etc. Recently, much effort has also been devoted to developing new photocatalytic materials based on complexes, which is prompted largely by a demand for solving environmental pollution problems owing to their potential applications in the degradation of organic pollutants.12,13 As an important type of complex with unique structure and characteristic fluorescence via lanthanide ions combining with appropriate organic ligands, application of lanthanide complexes in luminescent materials has received widespread attention.14–17 Nevertheless, the studies on the photocatalytic properties of lanthanide complexes are relatively rare,18 therefore, design and synthesis of novel lanthanide complexes with excellent photocatalytic properties have always been the direction of research.
Among the numerous ligands for preparing metal complexes, structural units containing N,O ligands have received extensive attention.19 1,10-Phenanthroline derivatives are one of the most unique N,O-containing ligands ascribing to rigid-flexible combining structure. Researchers have also explored phenanthroline derivatives, such as pyrazine(2,3-f)-(1,10)phenanthroline,20 2-(3-pyridyl)imidazo(4,5-f)-(1,10)phenanthroline21,22 2-(2-carboxyphenyl) imidazo(4,5-f)-(1,10)phenanthroline (2-HNCP),23,24 and 2-(4-carboxyphenyl)imidazo(4,5-f)-(1,10)phenanthroline25 and so on. Over the past several years, our group has been dedicated to the syntheses of some carboxyl derivatives of 1,10-phenanthroline to construct complexes and analysis of their luminescence and photocatalysis abilities on organic pollutants.23–28 It is well known that there is compact relationship between the structures and the properties of complexes, and that the properties of the complexes can be effectively regulated by changing the main ligands and the coligands. Therefore, in order to deeply understand the structure–property relationship of lanthanide complexes based on the carboxyl derivatives of 1,10-phenanthroline, we chose 2-HNCP as the main ligand and pyridine-3-carboxylic acid (3-HPYC), succinic acid (H2SA), adipic acid (H2AA) as coligands (Schemes 1 and 2) to construct six complexes: [Tb(2-NCP)2(NO3)]n (1), [Eu(2-NCP)2(3-PYC)]n (2), [Sm(2-NCP)2(3-PYC)]n (3), [Eu(2-NCP)(SA)]n (4), [Tb(2-NCP)(SA)]n (5) and [Tb(2-NCP)(AA)]n (6). In addition, we also conducted a detailed analyses of the thermal stabilities, photoluminescence properties and photocatalytic activities for the degradation of organic dyes of six complexes.
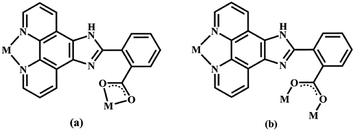 |
| | Scheme 1 Two coordination modes of the main ligand 2-NCP− in complexes 1–6 (M = metal). | |
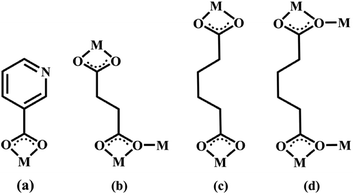 |
| | Scheme 2 The coordination modes of 3-PYC−, SA2− and AA2− coligands in complexes 2–6 (M = metal). | |
Experimental section
Characterizing machinery
All of the chemical reagents were obtained Jinan Heng Hua Science and Technology Company and used without further purification. Elemental analysis was performed on a Perkin-Elmer 240 analyzer. The infrared (IR) spectrum was recorded as KBr pellets on a Nicolet iS50 FT-IR Spectrometer in the 4000–400 cm−1 region. Powder X-ray diffraction (PXRD) pattern of the complex was collected on a D/MAX-3C diffractometer with the Cu Kα radiation (λ = 1.5406 Å) at room temperature and 2θ ranging from 5 to 50°. Thermogravimetric analysis (TGA) was performed on a STA 449 F3 Jupiter Synchronous thermal analyzer with a heating rate of 10 °C min−1 under air atmosphere. UV-vis diffuse reflectance spectrum (UV-vis DRS) was obtained for the dry-pressed disk samples using a Specord 2450 spectrometer (Shimadzu, Japan) equipped with the integrated sphere accessory for diffuse reflectance spectra, using BaSO4 as the reference reflectance sample. The photoluminescence (PL) spectrum of the complex was obtained by the F4600 (Hitachi, Japan). The photodegradation test was performed by using photocatalytic reactor (DW-01, xenon light source, Yangzhou University teaching instrument factory).
Syntheses of the complexes
Synthesis of complex 1. A mixture of Tb(NO3)3·6H2O (0.0453 g, 0.1 mmol), 2-HNCP (0.0340 g, 0.1 mmol) and 10 mL of H2O was stirred for 10 min, then the pH value was adjusted to 6.5 by addition of NaOH solution (1 mol L−1). The resultant solution was heated at 443 K in a 25 mL Teflon-lined stainless steel autoclave under autogenous pressure for 3 days. Afterwards, the reaction system was cooled slowly to room temperature. The obtained solid is a mixture of yellow block crystals and powder. The crystals of complex 1 are picked out from the solid mixture in 51% yield based on Tb(NO3)3·6H2O. Anal. calc. for C40H22N9O7Tb (1) (%): C, 53.35; H, 2.44; N, 14.01. Found (%): C, 53.66; H, 2.50; N, 13.98. IR (KBr pellet, cm−1): complex 1: ν = 1685 (w), 1615 (m), 1560 (s), 1469 (s), 1421 (s), 1385 (w), 1288 (s), 1184 (m), 1079 (s), 1031 (w), 946 (w), 870 (m), 807 (m), 779 (m), 738 (s), 668 (w), 553 (w), 445 (w). Fig. S1a† exhibits the IR spectrum of the complex 1.
Synthesis of complex 2. A mixture of Eu(NO3)3·6H2O (0.0446 g, 0.1 mmol), 2-HNCP (0.0680 g, 0.2 mmol), 3-HPYC (0.0123 g, 0.1 mmol) and 10 mL of H2O was stirred for 10 min, then the pH value was adjusted to 6.5 by addition of NaOH solution (1 mol L−1). The resultant solution was heated at 443 K in a 25 mL Teflon-lined stainless steel autoclave under autogenous pressure for 3 days. Afterwards, the reaction system was cooled slowly to room temperature. The obtained solid is a mixture of yellow block crystals and powder. The crystals of complex 2 are picked out from the solid mixture in 47% yield based on Eu(NO3)3·6H2O. Anal. calc. for C46H26N9O6Eu (2) (%): C, 58.07; H, 2.69; N, 13.31. Found (%): C, 58.00; H, 2.73; N, 13.24. IR (KBr pellet, cm−1): complex 2: ν = 1553 (s), 1479 (m), 1414 (s), 1358 (m), 1295 (m), 1184 (w), 1135 (w), 814 (s), 1086 (m), 1041 (w), 953 (w), 866 (m), 814 (s), 779 (w), 731 (s), 692 (w), 640 (w), 479 (w), 445 (w). Fig. S1b† exhibits the IR spectrum of the complex 2.
Synthesis of complex 3. The synthesis process of complex 3 is very similar to that of 2, except that the metal salt Eu(NO3)3·6H2O is replaced by Sm(NO3)3·6H2O (0.0444 g, 0.1 mmol), and the crystal color obtained of 3 is yellow. The crystals of complex 3 are picked out from the solid mixture in 59% yield based on Sm(NO3)3·6H2O. Anal. calc. for C46H26N9O6Sm (3) (%): C, 58.03; H, 2.82; N, 13.33. Found (%): C, 58.24; H, 2.93; N, 13.25. IR (KBr pellet, cm−1): complex 3: ν = 1591 (s), 1556 (s), 1479 (w), 1414 (s), 1361 (m), 1295 (w), 1191 (w), 1079 (m), 856 (m), 814 (s), 741 (s), 574 (w), 452 (w). Fig. S1c† exhibits the IR spectrum of the complex 3.
Synthesis of complex 4. A mixture of Eu(NO3)3·6H2O (0.0446 g, 0.1 mmol), 2-HNCP (0.0340 g, 0.1 mmol), H2SA (0.0108 g, 0.1 mmol) and 10 mL of H2O was stirred for 10 min, then the pH value was adjusted to 6.0 by addition of NaOH solution (1 mol L−1). The resultant solution was heated at 453 K in a 25 mL Teflon-lined stainless steel autoclave under autogenous pressure for 3 days. Afterwards, the reaction system was cooled slowly to room temperature. The obtained solid is a mixture of yellow block crystals and powder. The crystals of complex 4 are picked out from the solid mixture in 48% yield based on Eu(NO3)3·6H2O. Anal. calc. for C24H15N4O6Eu (4) (%): C, 45.28; H, 2.57; N, 9.61. Found (%): C, 45.20; H, 2.62; N, 9.67. IR (KBr pellet, cm−1): complex 4: ν = 3740 (m), 3240 (s), 2925 (m), 1976 (w), 1722 (w), 1607 (w), 1492 (w), 1429 (w), 1076 (s), 929 (s), 806 (s), 737 (w), 659 (s), 475 (m), 451 (s). Fig. S1d† exhibits the IR spectrum of the complex 4.
Synthesis of complex 5. The synthesis process of complex 5 is very similar to that of 4, except that the metal salt Eu(NO3)3·6H2O is replaced by Tb(NO3)3·6H2O (0.0453 g, 0.1 mmol). The obtained solid is a mixture of yellow block crystals and powder. The crystals of complex 5 are picked out from the solid mixture in 54% yield based on Tb(NO3)3·6H2O. Anal. calc. for C24H15N4O6Tb (5) (%): C, 46.91; H, 2.44; N, 9.12. Found (%): C, 46.88; H, 2.52; N, 9.20. IR (KBr pellet, cm−1): complex 5: ν = 3240 (s), 2909 (w), 2339 (w), 1553 (s), 1429 (s), 1068 (m), 937 (m), 814 (s), 775 (s), 667 (s), 483 (w), 459 (w). Fig. S1e† exhibits the IR spectrum of the complex 5.
Synthesis of complex 6. The synthesis process of complex 6 is very similar to that of 5, except that H2SA ligand is replaced by H2AA ligand (0.0146 g, 0.1 mmol). The obtained solid is a mixture of yellow block crystals and powder. The crystals of complex 6 are picked out from the solid mixture in 60% yield based on Tb(NO3)3·6H2O. Anal. calc. for C26H19N4O6Tb (6) (%): C, 48.59; H, 2.96; N, 8.72. Found (%): C, 48.53; H, 3.01; N, 8.77. IR (KBr pellet, cm−1): complex 6: ν = 3228 (m), 2948 (w), 1549 (s), 1435 (m), 1389 (m), 1328 (m), 1079 (m), 820 (s), 744 (s), 653 (w), 516 (w). Fig. S1f† exhibits the IR spectrum of the complex 6.
X-ray structure determination
Crystal data were collected on Bruker SMART APEX II CCD diffractometer with graphite monochromated Mo-Kα radiation (λ = 0.71073 Å) in the ω scan mode, respectively. All the structures were solved by direct methods using the program SHELXS-2014 (ref. 29) and refined by full-matrix least-squares techniques against F2 using the SHELXTL-2014 (ref. 30) crystallographic software package. All of the non-hydrogen atoms were easily found from the different Fourier map and refined anisotropically, whereas the hydrogen atoms of the complexes were placed by geometrical considerations and were added to the structure factor calculation. The crystallographic data of six complexes are summarized in Table S1† and the selected bond distances and angles in Table S2.†
Results and discussion
Structural analysis of complexes
Structure of [Tb(2-NCP)2(NO3)]n (1). Complex 1 crystallizes in the monoclinic space group P21/n. The asymmetric unit consists of one independent Tb3+ cation, two 2-NCP− anions, and one NO3− anion. As shown in Fig. 1, Tb3+ cation is ten-coordinated and encircled by four nitrogen atoms (N1, N2, N5, N6) from two chelating 2-NCP− ligands, and six oxygen atoms (O1#2, O2#2, O3#1, O4#1, O5, O6, symmetry codes: #1: −x, −y + 1, −z + 2; #2: x − 1/2, −y + 1/2, z − 1/2) from other two different 2-NCP− ligands and one NO3−. The Tb–N and Tb–O lengths lie in the range of 2.539(3)–2.646(3) Å and 2.441(3)–2.590(3) Å, respectively, which are in accordance with the previous reports.31–35 Each 2-NCP− ligand coordinates with two Tb3+ cations in bidentate fashion. In 2-NCP− ligand, the nitrogen atoms of pyridyl ring chelate one Tb3+ cation and the carboxylate group adopts μ1-η1:η1 coordination mode to link one Tb3+ ion (Scheme 1a). The adjacent Tb(NO3)2+ cations are held by a couple of antiparallel 2-NCP− ligands to form a [Tb2(2-NCP)2(NO3)2] dimeric unit where the Tb–Tb distance is 9.63 Å. Furthermore, the dimeric units are gathered through independent 2-NCP− linkers to form an infinite two-dimensional (2D) layer (Fig. 2). Among the layers, there exist edge-to-face C–H⋯π interactions between C8 and the phenyl rings of 2-NCP− anions (d(C8–H8⋯π) = 3.591 Å, <(C8–H8⋯π) = 103°), which lead to a three-dimensional (3D) supramolecular architecture (Fig. 3).
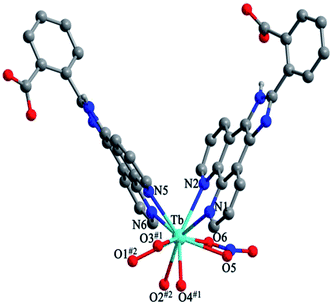 |
| | Fig. 1 View of the coordination environment around Tb3+ in 1. Symmetric codes: #1: −x, −y + 1, −z + 2; #2: x − 1/2, −y + 1/2, z − 1/2. | |
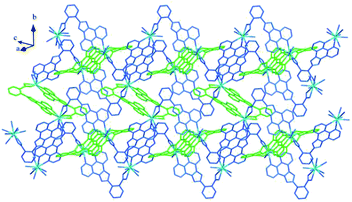 |
| | Fig. 2 View of the 2D layer of 1. | |
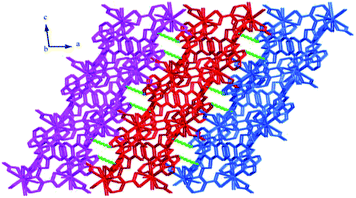 |
| | Fig. 3 The 3D supramolecular architecture of 1 connected by C–H⋯π interactions. | |
Structures of [Eu(2-NCP)2(3-PYC)]n (2) and [Sm(2-NCP)2(3-PYC)]n (3). Single-crystal X-ray analyses reveal that complexes 2 and 3 are isostructural and differ only in different lanthanide metal centers. Herein, the crystal structure of complex 2 is discussed as a representative. Complex 2 crystallizes in the space group P![[1 with combining macron]](https://www.rsc.org/images/entities/char_0031_0304.gif) . In the asymmetric unit, there are one crystallographically unique Eu3+ ion, two unique 2-NCP− anions and one 3-PYC− ligand. As depicted in Fig. 4, the Eu3+ ion is in a ten-coordinated environment, completed by six oxygen atoms (O1#1, O2#1, O3#2, O4#2, O5, O6, symmetry codes: #1: −x + 2, −y, −z + 2; #2: −x + 1, −y + 1, −z + 1) from two independent 2-NCP− anions and one terminal 3-PYC− ligand, and four nitrogen atom (N1, N2, N5, N6) from two 2-NCP− anions. The Eu–N and Eu–O lengths are in the range of 2.569(3)–2.689(3) Å and 2.421(3)–2.664(3) Å, respectively. The distances are comparable to those in the reported Eu3+ complexes.27,28,34–36 Notably, every pair of antiparallel 2-NCP− anions connects neighboring Eu(2-PYC)2+ cations to give a [Eu2(2-NCP)2(2-PYC)2] dimeric unit (the coordination modes of two ligands shown in Schemes 1a and 2a). With Eu3+ ions lying on the inversion center, the adjoining dimeric units are held together to give an infinite 1D chain (Fig. 5). In addition, the chains are sequentially joined by C–H⋯π interactions between C16 and the phenyl rings of 2-NCP− anions (d(C16–H16⋯π) = 3.373 Å, <(C16–H16⋯π) = 105°) to generate a 2D framework (Fig. 6). Also, edge-to-face C–H⋯π interactions are observed between the carbon atoms on 3-PYC− anions and the phenyl rings of 2-NCP− anions (d(C44–H44⋯π) = 3.697 Å, <(C16–H16⋯π) = 136°), which join the 2D layers to a 3D supramolecular architecture (Fig. 7).
. In the asymmetric unit, there are one crystallographically unique Eu3+ ion, two unique 2-NCP− anions and one 3-PYC− ligand. As depicted in Fig. 4, the Eu3+ ion is in a ten-coordinated environment, completed by six oxygen atoms (O1#1, O2#1, O3#2, O4#2, O5, O6, symmetry codes: #1: −x + 2, −y, −z + 2; #2: −x + 1, −y + 1, −z + 1) from two independent 2-NCP− anions and one terminal 3-PYC− ligand, and four nitrogen atom (N1, N2, N5, N6) from two 2-NCP− anions. The Eu–N and Eu–O lengths are in the range of 2.569(3)–2.689(3) Å and 2.421(3)–2.664(3) Å, respectively. The distances are comparable to those in the reported Eu3+ complexes.27,28,34–36 Notably, every pair of antiparallel 2-NCP− anions connects neighboring Eu(2-PYC)2+ cations to give a [Eu2(2-NCP)2(2-PYC)2] dimeric unit (the coordination modes of two ligands shown in Schemes 1a and 2a). With Eu3+ ions lying on the inversion center, the adjoining dimeric units are held together to give an infinite 1D chain (Fig. 5). In addition, the chains are sequentially joined by C–H⋯π interactions between C16 and the phenyl rings of 2-NCP− anions (d(C16–H16⋯π) = 3.373 Å, <(C16–H16⋯π) = 105°) to generate a 2D framework (Fig. 6). Also, edge-to-face C–H⋯π interactions are observed between the carbon atoms on 3-PYC− anions and the phenyl rings of 2-NCP− anions (d(C44–H44⋯π) = 3.697 Å, <(C16–H16⋯π) = 136°), which join the 2D layers to a 3D supramolecular architecture (Fig. 7).
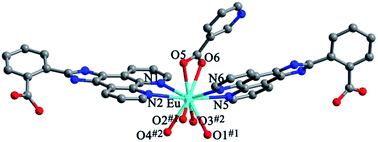 |
| | Fig. 4 View of the coordination environment of Eu3+ in 2. Symmetry codes: #1: −x + 2, −y, −z + 2; #2: −x + 1, −y + 1, −z + 1. | |
 |
| | Fig. 5 View of the 1D chain of 2. | |
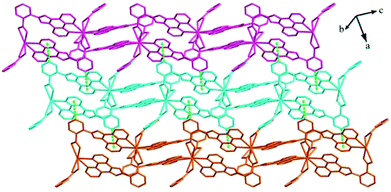 |
| | Fig. 6 View of the 2D supramolecular layer of 2 stabilized by C–H⋯π interactions. | |
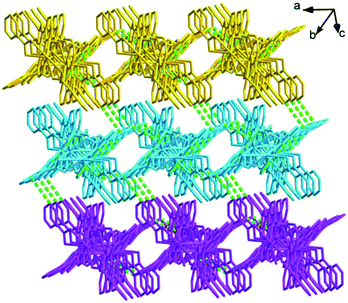 |
| | Fig. 7 View of the 3D supramolecular architecture of 2 formed by C–H⋯π interactions. | |
Structures of [Eu(2-NCP)(SA)]n (4) and [Tb(2-NCP)(SA)]n (5). In complexes 4 and 5, the auxiliary ligands have been changed from monocarboxylic ligands to dicarboxylic H2SA, which result in legible “pillar-chain” type 2D layers. Complexes 4 and 5 are isomorphous and display similar 3D supramolecular frameworks. Therefore, only the description of 4 is given in detail. Single crystal X-ray diffraction reveals that complex 4 belongs to the triclinic system and its space group is P![[1 with combining macron]](https://www.rsc.org/images/entities/char_0031_0304.gif) . The asymmetric unit contains one crystallographically independent Eu3+ ion, one 2-NCP− ligand, and one SA2− anion. As shown in Fig. 8, Eu3+ ion is in a nine-coordinated mode, and encircled by two nitrogen atoms (N1#4, N2#4, symmetry codes: #4: −x + 2, −y + 1, −z + 1) from one 2-NCP− ligand and seven oxygen atoms (O1, O2#1, O3, O4, O5#3, O6#2, O6#3, symmetry codes: #1: −x + 2, −y + 1, −z + 2; #2: −x + 3, −y + 1, −z + 2; #3: x − 1, y, z) from two 2-NCP− anions and three SA2− anions, respectively. The Eu–O and Eu–N lengths distances in 4 are in the range of 2.382(6)–2.610(6) Å and 2.539(7)–2.572(7) Å, respectively, which are in accordance with previous reports.27,28,34–36 Adjoining Eu3+ ions are held together by four carboxylate groups to afford a paddle wheel-like [Eu2] cluster with the Eu–Eu separation of 3.85 Å. Two antiparallel 2-NCP− ligands bridge the adjacent clusters in trident coordination mode to form a dimeric unit (the coordination mode of 2-NCP− shown in Scheme 1b). With the [Eu2] cluster as the symmetric center, adjacent dimer units are held together to generate an infinite 1D chain. Moreover, the SA2− anions adopt μ3-η2:η1:η1:η1 coordination modes (Scheme 2b) and pillar the neighboring chains to give a “pillar-chain” type 2D layer (Fig. 9). Additionally, there are C–H⋯O intermolecular hydrogen-bonding interactions between carbon atoms and carboxylate oxygen atoms (d(C8–H8⋯O4#5) = 3.189 Å, <(C8–H8⋯O4#5) = 136°, symmetry code: #5: −x + 2, −y, −z + 1), which extend the 2D layers to a 3D framework (Fig. 10).
. The asymmetric unit contains one crystallographically independent Eu3+ ion, one 2-NCP− ligand, and one SA2− anion. As shown in Fig. 8, Eu3+ ion is in a nine-coordinated mode, and encircled by two nitrogen atoms (N1#4, N2#4, symmetry codes: #4: −x + 2, −y + 1, −z + 1) from one 2-NCP− ligand and seven oxygen atoms (O1, O2#1, O3, O4, O5#3, O6#2, O6#3, symmetry codes: #1: −x + 2, −y + 1, −z + 2; #2: −x + 3, −y + 1, −z + 2; #3: x − 1, y, z) from two 2-NCP− anions and three SA2− anions, respectively. The Eu–O and Eu–N lengths distances in 4 are in the range of 2.382(6)–2.610(6) Å and 2.539(7)–2.572(7) Å, respectively, which are in accordance with previous reports.27,28,34–36 Adjoining Eu3+ ions are held together by four carboxylate groups to afford a paddle wheel-like [Eu2] cluster with the Eu–Eu separation of 3.85 Å. Two antiparallel 2-NCP− ligands bridge the adjacent clusters in trident coordination mode to form a dimeric unit (the coordination mode of 2-NCP− shown in Scheme 1b). With the [Eu2] cluster as the symmetric center, adjacent dimer units are held together to generate an infinite 1D chain. Moreover, the SA2− anions adopt μ3-η2:η1:η1:η1 coordination modes (Scheme 2b) and pillar the neighboring chains to give a “pillar-chain” type 2D layer (Fig. 9). Additionally, there are C–H⋯O intermolecular hydrogen-bonding interactions between carbon atoms and carboxylate oxygen atoms (d(C8–H8⋯O4#5) = 3.189 Å, <(C8–H8⋯O4#5) = 136°, symmetry code: #5: −x + 2, −y, −z + 1), which extend the 2D layers to a 3D framework (Fig. 10).
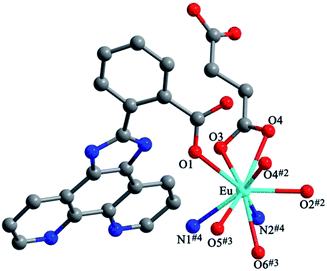 |
| | Fig. 8 View of the coordination environment of Eu3+ in 4. Symmetry codes: #2: −x + 2, −y + 2, −z + 2; #3: x + 1, y, z; #4: −x + 2, −y + 2, −z + 1. | |
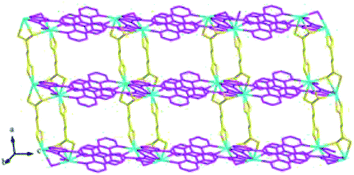 |
| | Fig. 9 View of the “pillar-chain” type 2D layer in 4. | |
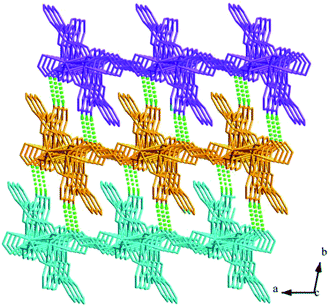 |
| | Fig. 10 View of the 3D supramolecular architecture of 4 formed by C–H⋯O interactions. | |
Structure of [Tb(2-NCP)(AA)]n (6). In complex 6, H2SA ligand has been replaced by H2AA with more flexible and longer nature. Single-crystal X-ray analysis reveals that complex 6 also exhibits “pillar-chain” type 2D layer. The asymmetric unit contains one independent Tb3+ ion, one 2-NCP− ligand and two half AA2− anions (Fig. 11). Tb3+ ion is nine-coordinated and surrounded by three 2-NCP− ligands and three AA2− anions. The average Tb–O (2.418(2) Å) and Tb–N (2.538(3) Å) distances for 6 are close to those of reported Tb3+ complexes.31–35 Each 2-NCP− ligand bridges three Tb3+ ions in a trident coordination fashion and adjacent Tb3+ ions are held by carboxylate groups to form a [Tb2] cluster (Scheme 1b). It should be pointed out that the coordination environments of metal ion and 2-NCP− ligand in 6 are similar with those in complex 4, which inevitably results in an analogous 1D chain. Then the chains are pillared by AA2− ligands to afford a 2D layer. However, in comparison with complex 4, the neighboring “pillars” AA2− ligands adopt μ2-η1:η1:η1:η1 and μ4-η2:η1:η2:η1 coordination modes (Schemes 2c and d), respectively, and exhibit unparallel fashion, which leads to an oblique “pillar-chain” type 2D layer (Fig. 12). In addition, intermolecular C–H⋯π interactions are observed between carbon atoms and phenyl rings of 2-NCP− anions (d(C17–H17⋯π) = 3.982 Å, <(C17–H17⋯π) = 83°). The 2D layers are further extended by these intermolecular interactions to generate a 3D supramolecular framework (Fig. 13).
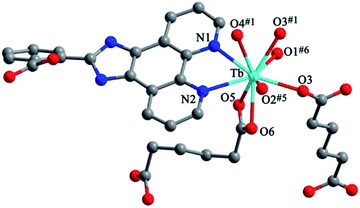 |
| | Fig. 11 View of the coordination environment of Tb3+ in 6. Symmetry code: #1: −x + 2, −y, −z + 2; #5: −x + 2, −y, −z + 1; #6: x, y, z + 1. | |
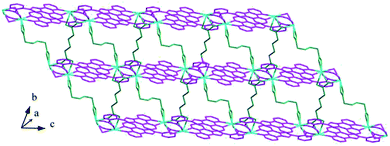 |
| | Fig. 12 View of the oblique “pillar-chain” type 2D layer in 6. | |
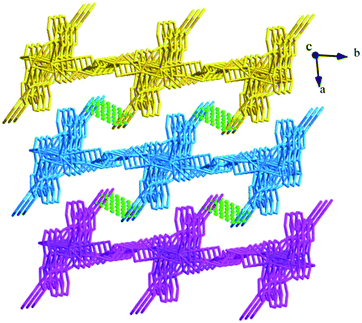 |
| | Fig. 13 View of the 3D supramolecular architecture of 6 furnished via C–H⋯π interactions. | |
Influence of coligands
Complexes 1–6 were synthesized under similar conditions by using identical 2-HNCP main ligands and lanthanide metal salts. From the structure description above, their diverse motifs can be ascribed to the difference of coligands. In complexes 1–6, coligands have different steric hindrance, flexibility and number of carboxylate group. These factors influence the structure of the complexes. Complexes 1 and 2 exhibit the effects of steric hindrance on their structures. In complex 2, the rigid 3-PYC− anions hinder the expansion of structure dimension, yielding a 1D chain. Complexes 4–6 imply the number of carboxylate group influence on the structure motifs. Compared with nitrite ion and 3-HPYC, H2SA and H2AA have additional carboxylate group. Generally, extra carboxylate group can increase the coordination patterns of ligands. In complexes 4–6, SA2− and AA2− anions gather the metal clusters and then support the adjacent chains. While in complexes 1–3, nitrite ions and 3-PYC− anions only act as terminal ligands. Additionally, the flexibility of ligands equally affects the complexity of structures. In comparison with SA2− in 4, AA2− has four –(CH2)– spacers and exhibits more flexible, indicating more unpredictable coordination mode of AA2− anions. As a result, AA2− anions adopt two kinds of coordination patterns in complex 6 and do not pillar the chains parallelly, which lead to an oblique “pillar-chain” type 2D layer.
PXRD and TGA
In order to ensure that the crystal powder is pure phase, the purity of the bulk materials of the complexes 1–6 were tested by PXRD (Fig. 14). The results show that the test values of the samples were consistent with those simulated from the single crystal X-ray diffraction data except for the relative intensity variation because of preferred orientation of the crystal, indicating that the samples have high purity. As depicted in Fig. 15, one obvious weight loss of 81.4%, 83.2%, 85.0%, 74.6%, 74.7% and 75.0% in the temperature range of 386–769, 394–732, 402–729, 215–556, 223–537 and 386–817 °C are assigned to the decomposition of framework for 1–6 (calcd: 82.3%, 84.0%, 84.2%, 75.0%, 74.1% and 75.3%), respectively. The final residue of 18.6%, 16.8%, 15%, 25.4%, 25.3%, 25% could correspond to the formation of metal oxide (calcd: Tb4O7, 20.7%, 1; Eu2O3, 18.4%, 2; Sm2O3, 18.3%, 3; Eu2O3, 28.9%, 4; Tb4O7, 30.4%, 5; Tb4O7, 29.1%, 6). The thermal analyses products were identified by PXRD (Fig. S2,† JCPDS no. 32-1286, 34-0392 and 42-1461).
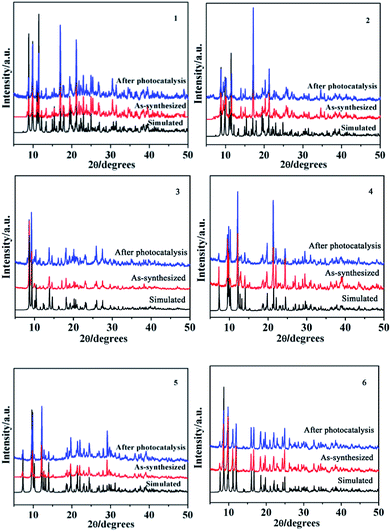 |
| | Fig. 14 Simulated, as-synthesized and after photocatalysis powder XRD patterns of 1–6. | |
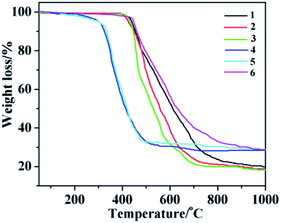 |
| | Fig. 15 TG curves of 1–6. | |
Photoluminescent properties
It is well known that ligand-sensitized lanthanide(III) complexes usually possess characteristic photoluminescence properties.14–17,37,38 Hence the solid-state fluorescence spectra of complexes 1–6 are investigated. The emission spectra of 1, 5 and 6 at room temperature are shown in Fig. 16, and are typical for the visible emission bands of Tb-based complexes related to literatures. Upon excitation (λex = 365 nm, 365 nm, 372 nm, respectively), four characteristic peaks of Tb3+ are observed, which correspond to the characteristic emission of 5D4 → 7F6, 5D4 → 7F5, 5D4 → 7F4 and 5D4 → 7F3 (491 nm, 546 nm, 591 nm and 618 nm for 1; 492 nm, 546 nm, 593 nm, 618 nm for 5; 492 nm, 546 nm, 586 nm, 621 nm for 6), respectively.39 Among of them, the intensity of the characteristic peak with a wavelength of about 618 nm of 1, 618 nm of 5 and 546 nm of 6 are the strongest. Upon excitation band at 417 nm and 365 nm, respectively, complexes 2 and 4 produced characteristic bands of Eu3+ in the visible region, peaking at 592 nm, 613 nm, 646 nm, 684 nm for 2 and 593 nm, 618 nm, 653 nm, 698 nm for 4 which are responsible for the transitions from the emitting 5D0 → 7F1, 5D0 → 7F2, 5D0 → 7F3 and 5D0 → 7F4.39 The strongest peak positions of two europium complexes appear at 613 nm and 618 nm, respectively. It is worthy to note that the difference of the emissive intensity, the strongest peak and peak splitting of Tb3+ or Eu3+ complexes can be attributed to the different energy levels of different coligands in the three complexes, so the efficiency of energy transfer is different, manifested in intensity and peak position. After excitation at 371 nm, the emission spectrum of complex 3 exhibits the characteristic luminescence bands of Sm3+ ions. Complex 3 displays four characteristic bands peaking at 562 nm, 594 nm, 642 nm and 709 nm ascribed to the 4G5/2 → 6H5/2, 4G5/2 → 6H7/2, 4G5/2 → 6H9/2 and 4G5/2 → 6H11/2, respectively.39
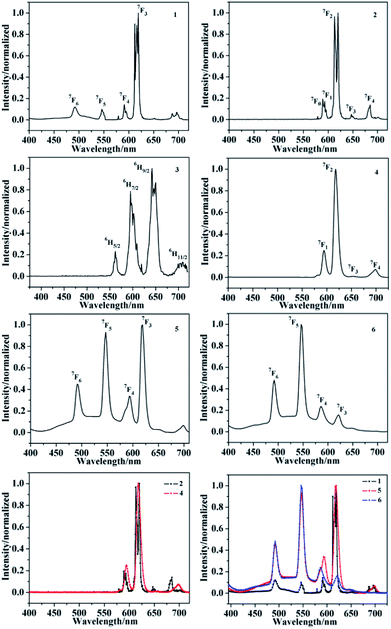 |
| | Fig. 16 PL spectra of complexes 1–6. | |
UV-vis diffuse reflectance spectrum
UV-visible diffuse reflectance spectroscopy is commonly used to study the light absorption and energy band characteristics of semiconductors. As shown in Fig. 17a, it is a solid UV-vis diffuse-reflectance spectra of complexes 1–6 and ligands 2-HNCP, 3-Hpyc, H2SA and H2AA. The UV-vis DRS of complexes 1–6 and ligand 2-HNCP almost overlaps, and the edge of the absorption band is located at 550 nm. This shows that the absorption of complexes 1–6 depends on the property of ligand 2-HNCP, and can respond in the visible light region, effective use of Xe lamp to degrade organic pollutants. In addition, in order to explore the conductivity of the title complexes, the measurement of diffuse reflectivity for a powder sample was used to obtain its band gap Eg, the band gap energy (Eg) of the complexes were calculated by the following formula based on the DRS result (1):where α is the absorption coefficient, n is the optical frequency, Eg is the band gap energy, A is a constant, respectively. Among of them, the value of n is determined by the type of optical transition of the semiconductor (i.e., n = 1 for direct transition and n = 4 for indirect transition). According to previous literature reports,40 for complexes 1–6 as a direct transition, the value of n is 1. Thus, as shown in Fig. 17b, the Eg of the complexes 1–6 are 2.08 eV, 2.01 eV, 1.95 eV, 1.88 eV, 1.81 eV and 1.72 eV, respectively.
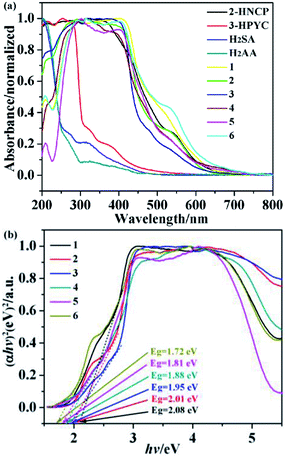 |
| | Fig. 17 (a) UV-vis diffuse-reflectance spectra of the complexes 1–6, 2-HNCP, 3-HPYC, H2SA and H2AA ligands with BaSO4 as background; (b) the plots of (αhv)2 versus (hv) of the complexes 1–6. | |
Photocatalytic studies
Prior research showed that some lanthanide(III) complexes have attracted attention due to their potential application fields, these are promising photocatalysts for the purifying water and air by completely decomposing organic pollutants.18 As part of the study to evaluate the efficiency of these six complexes as possible photocatalysts, we selected methylene blue (MB) as a model pollutant for degradation experiments. Typically, a suspension containing 1–6 (30 mg) and 100 mL MB (0.5 mg L−1) solution was stirred in the dark for about 40 minutes. Then turn on the Xe lamp source and remove the clear solution every 30 minutes. The characteristic absorption of MB (approximately 664 nm) was selected to monitor the photocatalytic degradation process. The reflectance spectra show that there exist the optical band gap and semiconductive behaviors in complexes. So these complexes can be employed as potential semiconductive materials. In addition, the concentrations of MB versus reaction time in the presence of complexes 1–6 are shown in Fig. 18a. The degradation efficiencies are defined as C/C0, where C and C0 represent the remnant and initial concentration of MB, respectively. After the irradiation time of 370 min, the MB degradation rates were 5.0%, 19.6%, 20.5%, 24.6%, 37.8%, 41.4% and 81.2% without and with 1–6 as photocatalysts, respectively. The results revealed that the order of the catalytic activities of six complexes was 6 > 5 > 4 > 3 > 2 > 1. These results suggest that the complex 6 may be a good candidate for the photocatalytic degradation of MB.
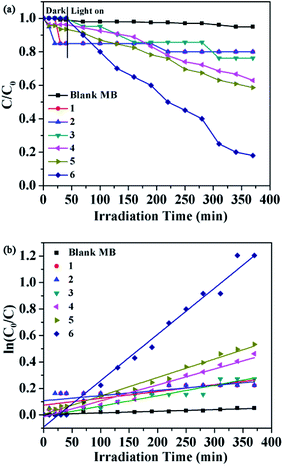 |
| | Fig. 18 (a) The photocatalytic activities of complexes 1–6 for MB of degradation under visible light; (b) the pseudo-first-order plot for the photodegradation of MB in the presence of 1–6 under visible light irradiation. The dots and line represent the experimental data and the fitted least-square line, respectively. | |
In order to describe the rate of degradation reaction for these samples, the corresponding reaction rate constant (k) was calculated by adopting the pseudo-first-order kinetic equation according to the Langmuir–Hinshelwood model. At the same time, the kinetic behaviors of photocatalytic degradation using the composite photocatalysts were further investigated, and the results are shown in Fig. 18b. All of them fit well with the pseudo-first-order correlation: ln(C0/C) = kt, where C is the concentration of organic dye remaining in the solution at an irradiation time of t, C0 is the initial concentration at t = 0, and k is the degradation apparent rate constant (min−1). It is found that the k values were calculated to be 5.13 × 10⁻⁴ min−1 for 1, 3.87 × 10 −4 min−1 for 2, 7.88 × 10⁻⁴ min−1 for 3, 1.21 × 10⁻³ min−1 for 4, 1.4 × 10⁻³ min−1 for 5, 3.5 × 10⁻³ min−1 for 6 and 1.24 × 10⁻⁴ min−1 for the blank experiment. The dots of the experimental data and the fitted least-square line show the R2 = 0.5970 for 1, R2 = 0.5617 for 2, R2 = 0.9393 for 3, R2 = 0.9636 for 4, R2 = 0.9853 for 5, R2 = 0.9848 for 6 and R2 = 0.9166 for the blank. In comparison with the calculated results, the effect of photocatalyst addition was a significant speed up of the discoloration processes. In addition, the stabilities of 1–6 were monitored using PXRD during the photocatalytic process. After photocatalysis, six complexes display similar PXRD patterns to the original (Fig. 14), implying that the stabilities toward photocatalytic reactions for 1–6 are excellent.
Herein, four organic dyes RhB, MO, MV and CR were selected as model pollutants in aqueous media to evaluate the photocatalytic effectiveness of complex 6. It can be seen that approximately 55% of RhB, 25% of MO, 44% of MV and 40% of CR have been decomposed after 370 min of irradiation for 6, respectively (Fig. 19a). These results indicated that the complex 6 is more active for the decomposition of RhB under visible light irradiation. This is good candidates for photocatalytic degradation of RhB. All of them fit well with the pseudo-first-order correlation: ln(C0/C) = kt. The order of different organic dyes degradation rate for as-prepared photocatalyst 6 was RhB (1.89 × 10⁻³ min−1) > MV (1.42 × 10⁻³ min−1) > CR (1.12 × 10⁻³ min−1) > MO (8.54 × 10⁻⁴ min−1) > blank (1.26 × 10⁻⁴ min−1, 1.24 × 10⁻⁴ min−1, 1.21 × 10⁻⁴ min−1, 1.00 × 10⁻⁴ min−1, respectively) (Fig. 19b). The dots of the experimental data and the fitted least-square line show the R2 = 0.9859 for RhB, R2 = 0.9391 for MO, R2 = 0.8075 for MV, R2 = 0.8142 for CR and R2 = 0.9059 for the blank RhB, R2 = 0.9406 for the blank MO, R2 = 0.9166 for the blank MV, R2 = 0.9774 for the blank CR. In comparison with the calculated results, the effect of photocatalyst addition also was a significant speed up of the discoloration processes.
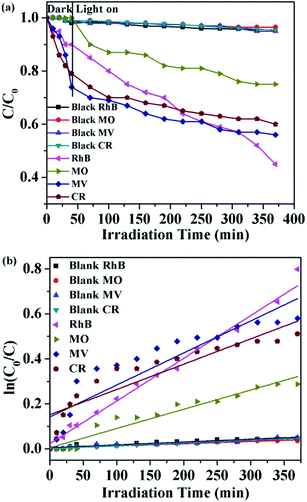 |
| | Fig. 19 (a) The photocatalytic activities of 6 for different organic dyes of degradation under visible light; (b) the first-kinetic of the photocatalytic degradation of four organic dyes. The dots and line represent the experimental data and the fitted least-square line, respectively. | |
Photocatalytic mechanism
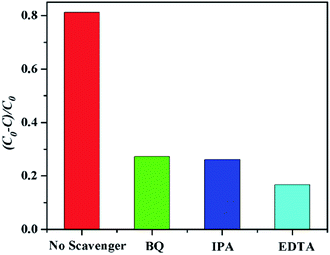
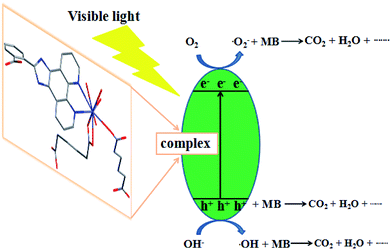
The mechanism of the photodegradation of organic pollutant catalyzed by complexes was illustrated as follows: the electrons of these complexes could be excited electrons (e−) from the valence band (VB) to the conduction band (CB) under the irradiation of visible light, generating the same amount of holes (h+). The key intermediate, hydroxyl radical (·OH), was yielded by the combination of H+ with ·O2− generated from the reduction of O2 by e− and the oxidation of OH− oxidized by h+. The ·OH radical was so active as to decompose the organic pollutants into other products, CO2, and H2O.41,42 Based on the above results, the complex 6 has good photocatalytic activity for MB. In order to clarify the photocatalytic mechanism of MB, trapping experiments of radicals were used to detect the main oxidative species in the photocatalytic process.23,43,44 Taking the photodegradation of MB as an example, the degradation rate of complex 6 under visible light without the addition of scavenger can reach 81.2%, respectively. As shown in Fig. 20 for the as-prepared sample, it can be seen that when the radical scavenger EDTA (as a hole scavenger) was added into reaction solution, the degradation rate of MB obviously was inhibited (16.67% for 6). At the same time, when the radical scavenger isopropyl alcohol (IPA, as a ·OH scavenger) and p-benzoquinone (BQ, as a ·O2− scavenger) were added into reaction solution, the degradation rate of MB was inhibited (26.09% and 27.27% for 6). Therefore, combined with the above discussion, the possible photocatalytic mechanism for degradation of MB with the photocatalyst 6 was proposed as shown in Fig. 21. On the basis of the above-mentioned photocatalytic mechanism, the efficiency of the photocatalyst relates to the balance between charges separation, interfacial electron transfer and charge recombination. Generally speaking, the ease of the charge separation depends on a narrow band gap. The smaller Eg value is in favor of the electron transition, which may be beneficial to catalysis. So it is noted that the catalytic activities of complex 6 in agreement with the Eg values.
 |
| | Fig. 20 Plots of radical trapping in the system of photodegradation of MB by complex 6 under visible light irradiation. | |
 |
| | Fig. 21 Possible mechanism for the photo-induced charge transfer route of complex 6. | |
Conclusions
In summary, we have hydrothermally synthesized six lanthanide(III) complexes by the reactions of 2-HNCP as the main ligand, and 3-HPYC, H2SA and H2AA as coligands, respectively. The structure analyses demonstrate that complexes 1, 4, 5 and 6 exhibit 2D layers, and complexes 2 and 3 display 1D chains. Finally, they all showed 3D supramolecular networks via C–H⋯π interactions or C–H⋯O inter-molecular hydrogen-bonding. TGA indicate that six complexes have remarkable thermal stabilities of the main framework. The PL spectra of these complexes exhibit the characteristic luminescence of the rare earth ion in the visible spectral regions at room temperature. Photocatalytic experiment results manifest that the complex 6 is more photocatalytically active for degrading MB dye under Xe lamp irradiation, which is an excellent potential candidate for photocatalytic degradation of organic pollutants. It is worth mentioning that the different coligands play important roles in the structures, thermal stabilities, photoluminescent properties and photocatalytic activities of same metal complexes. This work opens a new prospective and a feasible strategy for the application of complexes in photocatalytic degradation of organic pollutants by utilizing solar energy.
Conflicts of interest
There are no conflicts to declare.
Acknowledgements
This work is supported by the National Natural Science Foundation (No. 21576112, 21607051), The Project of Department of Science & Technology of Jilin Province (20180623042TC, 20180101181JC, 20150623024TC-19), the Project of Human Resources and Social Security Department of Jilin Province (2017956) and the Project of Education Department of Jilin Province (JJKH20180775KJ).
Notes and references
- J. Yu, L. H. Xie, J. R. Li, Y. Ma, J. M. Seminario and P. B. Balbuena, Chem. Rev., 2017, 117, 9674–9754 CrossRef CAS PubMed.
- V. J. Witherspoon, J. Xu and J. A. Reime, Chem. Rev., 2018, 118, 10033–10048 CrossRef CAS PubMed.
- C. Yao, W. Kang, S. R. Zhang, H. Y. Li, Y. H. Xu, Z. M. Su and G. B. Che, RSC Adv., 2018, 8, 36400–36406 RSC.
- K. Sumida, D. L. Rogow, J. A. Mason, T. M. McDonald, E. D. Bloch, Z. R. Herm, T. H. Bae and J. R. Long, Chem. Rev., 2012, 112, 724–781 CrossRef CAS PubMed.
- M. D. Allendorf, C. A. Bauer, R. K. Bhakta and R. J. T. Houk, Chem. Soc. Rev., 2009, 38, 1330–1352 RSC.
- M. Kurmoo, Chem. Soc. Rev., 2009, 38, 1353–1379 RSC.
- B. Gole, A. K. Bara and P. S. Mukherjee, Chem. Commun., 2011, 47, 12137–12139 RSC.
- L. Zhu, X. Q. Liu, H. L. Jiang and L. B. Sun, Chem. Rev., 2017, 117, 8129–8176 CrossRef CAS PubMed.
- C. C. Wang, J. R. Li, X. L. Lv, Y. Q. Zhang and G. S. Guo, Energy Environ. Sci., 2014, 7, 2831–2867 RSC.
- M. Yoon, R. Srirambalaji and K. Kim, Chem. Rev., 2011, 112, 1196–1231 CrossRef PubMed.
- S. Fukuzumi, Y. M. Lee and W. Nam, Coord. Chem. Rev., 2018, 355, 54–73 CrossRef CAS.
- W. Wang, M. O. Tadé and Z. Shao, Prog. Mater. Sci., 2018, 92, 33–63 CrossRef CAS.
- M. Sillanpää, M. C. Ncibi and A. Matilainen, J. Environ. Manage., 2018, 208, 56–76 CrossRef PubMed.
- M. L. Aulsebrook, B. Graham, M. R. Grace and K. L. Tuck, Coord. Chem. Rev., 2018, 395, 191–220 CrossRef.
- A. B. Ruiz-Muelle, A. García-García, A. A. García-Valdivia, I. Oyarzabal, J. Cepeda, J. M. Seco, E. Colacio, A. Rodríguez-Diéguez and I. Fernández, Dalton Trans., 2018, 47, 12783–12794 RSC.
- J. Ma and B. Yan, New J. Chem., 2018, 42, 15061–15067 RSC.
- N. Wang, J. W. Wang, D. Zhao, S. K. Mellerup, T. Peng, H. B. Wang and S. N. Wang, Inorg. Chem., 2018, 57, 10040–10049 CrossRef CAS PubMed.
- Q. S. Xia, X. D. Yu, H. M. Zhao, S. P. Wang, H. Wang, Z. F. Guo and H. Z. Xing, Cryst. Growth Des., 2017, 17, 4189–4195 CrossRef CAS.
- M. W. Drover, J. A. Love and L. L. Schafer, Chem. Soc. Rev., 2017, 46, 2913–2940 RSC.
- D. Inci, R. Aydin, H. Huriyet, Y. Zorlu and N. Çinkılıç, Appl. Organomet. Chem., 2018, 32, e4309 CrossRef.
- X. L. Wang, J. X. Zhang, G. C. Liu, H. Y. Lin and Z. H. Kang, J. Coord. Chem., 2010, 63, 3933–3943 CrossRef CAS.
- X. L. Wang, J. X. Zhang, G. C. Liu, H. Y. Lin and Y. Q. Chen, Russ. J. Coord. Chem., 2010, 36, 662–673 CrossRef CAS.
- Z. M. Li, Y. Qiao, C. B. Liu, Y. F. Zhou, X. Y. Wang, P. A. Charpentier, G. B. Che, W. Z. Xu, L. H. Liu and E. W. Zhu, Dalton Trans., 2018, 47, 7761–7775 RSC.
- C. B. Liu, H. Y. Sun, X. Y. Li, H. Y. Bai, Y. Cong, A. Ren and G. B. Che, Inorg. Chem. Commun., 2014, 47, 80–83 CrossRef CAS.
- X. J. Zhang, W. K. Li, W. T. Zhang, G. B. Che, X. Y. Li, Y. Qiao and C. C. Zhao, Inorg. Chem. Commun., 2015, 51, 122–125 CrossRef CAS.
- Y. Qiao, Y. F. Zhou, W. S. Guan, L. H. Liu, B. Liu, G. B. Che, C. B. Liu, X. Lin and E. W. Zhu, Inorg. Chim. Acta, 2017, 466, 291–297 CrossRef CAS.
- G. B. Che, S. Y. Liu, Q. Zhang, C. B. Liu and X. J. Zhang, J. Solid State Chem., 2015, 225, 378–382 CrossRef CAS.
- Y. Qiao, Z. M. Li, X. B. Wang, W. S. Guan, L. H. Liu, B. Liu, J. K. Wang, G. B. Che, C. B. Liu and X. Lin, Inorg. Chim. Acta, 2018, 471, 397–403 CrossRef CAS.
- G. M. Sheldrick, SHELXS-2014, Program for the Solution of Crystal Structures, University of Göttingen, Germany, 2014 Search PubMed.
- G. M. Sheldrick, SHELXL-2014, Program for the Refinement of Crystal Structure, University of Göttingen, Germany, 2014 Search PubMed.
- X. L. Pang, L. Li, Y. Wei, X. D. Yu and Y. J. Li, Dalton Trans., 2018, 47, 11530–11538 RSC.
- H. Y. Wong, W. T. K. Chan and G. L. Law, Inorg. Chem., 2018, 57, 6893–6902 CrossRef CAS PubMed.
- J. Z. Gu, Y. Cai, Y. Liu, X. X. Liang and A. M. Kirillov, Inorg. Chim. Acta, 2018, 469, 98–104 CrossRef CAS.
- L. L. Luo, X. L. Qu, Z. Li, X. Li and H. L. Sun, Dalton Trans., 2018, 47, 925–934 RSC.
- H. J. Zhang, R. Q. Fan, Y. W. Dong, W. Chen, X. Du, P. Wang and Y. L. Yang, CrystEngComm, 2016, 18, 3711–3724 RSC.
- B. Rajamouli and V. Sivakumar, New J. Chem., 2017, 41, 1017–1027 RSC.
- S. H. Zottnick, W. G. Daul, C. Kerpen, M. Finze and K. Mueller-Buschbaum, Chem.–Eur. J., 2018, 24, 15287–15294 CrossRef CAS PubMed.
- W. T. Chen, Z. X. Zhang, H. Luo, Y. Sui and D. S. Liu, Inorg. Chem., 2018, 57, 11626–11632 CrossRef CAS PubMed.
- J. C. G. Bünzli, Chem. Rev., 2010, 110, 2729–2755 CrossRef PubMed.
- Y. Qiao, S. S. Ren, L. H. Liu, W. S. Guan, Z. M. Li, G. B. Che, C. B. Liu, X. Y. Wang, Q. W. Wang and X. Y. Li, J. Mol. Struct., 2018, 1161, 238–245 CrossRef CAS.
- J. W. Cui, W. J. An, K. Van Hecke and G. H. Cui, Dalton Trans., 2016, 45, 17474–17484 RSC.
- L. Zeng, X. Guo, C. He and C. Duan, ACS Catal., 2016, 6, 7935–7947 CrossRef CAS.
- H. N. Che, L. H. Liu, G. B. Che, H. J. Dong, C. B. Liu and C. M. Li, Chem. Eng. J., 2019, 357, 209–219 CrossRef CAS.
- H. N. Che, G. B. Che, E. H. Jiang, C. B. Liu, H. J. Dong and C. M. Li, J. Taiwan Inst. Chem. Eng., 2018, 91, 224–234 CrossRef CAS.
Footnote |
| † Electronic supplementary information (ESI) available: Crystallographic data in CIF format and IR spectra for 1–6. CCDC 1865918–1865923 for 1–6. For ESI and crystallographic data in CIF or other electronic format see DOI: 10.1039/c8ra09207a |
|
| This journal is © The Royal Society of Chemistry 2019 |
Click here to see how this site uses Cookies. View our privacy policy here.  Open Access Article
 *ab and
Guangbo Che
 *a
*a

![[1 with combining macron]](https://www.rsc.org/images/entities/char_0031_0304.gif) . In the asymmetric unit, there are one crystallographically unique Eu3+ ion, two unique 2-NCP− anions and one 3-PYC− ligand. As depicted in Fig. 4, the Eu3+ ion is in a ten-coordinated environment, completed by six oxygen atoms (O1#1, O2#1, O3#2, O4#2, O5, O6, symmetry codes: #1: −x + 2, −y, −z + 2; #2: −x + 1, −y + 1, −z + 1) from two independent 2-NCP− anions and one terminal 3-PYC− ligand, and four nitrogen atom (N1, N2, N5, N6) from two 2-NCP− anions. The Eu–N and Eu–O lengths are in the range of 2.569(3)–2.689(3) Å and 2.421(3)–2.664(3) Å, respectively. The distances are comparable to those in the reported Eu3+ complexes.27,28,34–36 Notably, every pair of antiparallel 2-NCP− anions connects neighboring Eu(2-PYC)2+ cations to give a [Eu2(2-NCP)2(2-PYC)2] dimeric unit (the coordination modes of two ligands shown in Schemes 1a and 2a). With Eu3+ ions lying on the inversion center, the adjoining dimeric units are held together to give an infinite 1D chain (Fig. 5). In addition, the chains are sequentially joined by C–H⋯π interactions between C16 and the phenyl rings of 2-NCP− anions (d(C16–H16⋯π) = 3.373 Å, <(C16–H16⋯π) = 105°) to generate a 2D framework (Fig. 6). Also, edge-to-face C–H⋯π interactions are observed between the carbon atoms on 3-PYC− anions and the phenyl rings of 2-NCP− anions (d(C44–H44⋯π) = 3.697 Å, <(C16–H16⋯π) = 136°), which join the 2D layers to a 3D supramolecular architecture (Fig. 7).
. In the asymmetric unit, there are one crystallographically unique Eu3+ ion, two unique 2-NCP− anions and one 3-PYC− ligand. As depicted in Fig. 4, the Eu3+ ion is in a ten-coordinated environment, completed by six oxygen atoms (O1#1, O2#1, O3#2, O4#2, O5, O6, symmetry codes: #1: −x + 2, −y, −z + 2; #2: −x + 1, −y + 1, −z + 1) from two independent 2-NCP− anions and one terminal 3-PYC− ligand, and four nitrogen atom (N1, N2, N5, N6) from two 2-NCP− anions. The Eu–N and Eu–O lengths are in the range of 2.569(3)–2.689(3) Å and 2.421(3)–2.664(3) Å, respectively. The distances are comparable to those in the reported Eu3+ complexes.27,28,34–36 Notably, every pair of antiparallel 2-NCP− anions connects neighboring Eu(2-PYC)2+ cations to give a [Eu2(2-NCP)2(2-PYC)2] dimeric unit (the coordination modes of two ligands shown in Schemes 1a and 2a). With Eu3+ ions lying on the inversion center, the adjoining dimeric units are held together to give an infinite 1D chain (Fig. 5). In addition, the chains are sequentially joined by C–H⋯π interactions between C16 and the phenyl rings of 2-NCP− anions (d(C16–H16⋯π) = 3.373 Å, <(C16–H16⋯π) = 105°) to generate a 2D framework (Fig. 6). Also, edge-to-face C–H⋯π interactions are observed between the carbon atoms on 3-PYC− anions and the phenyl rings of 2-NCP− anions (d(C44–H44⋯π) = 3.697 Å, <(C16–H16⋯π) = 136°), which join the 2D layers to a 3D supramolecular architecture (Fig. 7).

![[1 with combining macron]](https://www.rsc.org/images/entities/char_0031_0304.gif) . The asymmetric unit contains one crystallographically independent Eu3+ ion, one 2-NCP− ligand, and one SA2− anion. As shown in Fig. 8, Eu3+ ion is in a nine-coordinated mode, and encircled by two nitrogen atoms (N1#4, N2#4, symmetry codes: #4: −x + 2, −y + 1, −z + 1) from one 2-NCP− ligand and seven oxygen atoms (O1, O2#1, O3, O4, O5#3, O6#2, O6#3, symmetry codes: #1: −x + 2, −y + 1, −z + 2; #2: −x + 3, −y + 1, −z + 2; #3: x − 1, y, z) from two 2-NCP− anions and three SA2− anions, respectively. The Eu–O and Eu–N lengths distances in 4 are in the range of 2.382(6)–2.610(6) Å and 2.539(7)–2.572(7) Å, respectively, which are in accordance with previous reports.27,28,34–36 Adjoining Eu3+ ions are held together by four carboxylate groups to afford a paddle wheel-like [Eu2] cluster with the Eu–Eu separation of 3.85 Å. Two antiparallel 2-NCP− ligands bridge the adjacent clusters in trident coordination mode to form a dimeric unit (the coordination mode of 2-NCP− shown in Scheme 1b). With the [Eu2] cluster as the symmetric center, adjacent dimer units are held together to generate an infinite 1D chain. Moreover, the SA2− anions adopt μ3-η2:η1:η1:η1 coordination modes (Scheme 2b) and pillar the neighboring chains to give a “pillar-chain” type 2D layer (Fig. 9). Additionally, there are C–H⋯O intermolecular hydrogen-bonding interactions between carbon atoms and carboxylate oxygen atoms (d(C8–H8⋯O4#5) = 3.189 Å, <(C8–H8⋯O4#5) = 136°, symmetry code: #5: −x + 2, −y, −z + 1), which extend the 2D layers to a 3D framework (Fig. 10).
. The asymmetric unit contains one crystallographically independent Eu3+ ion, one 2-NCP− ligand, and one SA2− anion. As shown in Fig. 8, Eu3+ ion is in a nine-coordinated mode, and encircled by two nitrogen atoms (N1#4, N2#4, symmetry codes: #4: −x + 2, −y + 1, −z + 1) from one 2-NCP− ligand and seven oxygen atoms (O1, O2#1, O3, O4, O5#3, O6#2, O6#3, symmetry codes: #1: −x + 2, −y + 1, −z + 2; #2: −x + 3, −y + 1, −z + 2; #3: x − 1, y, z) from two 2-NCP− anions and three SA2− anions, respectively. The Eu–O and Eu–N lengths distances in 4 are in the range of 2.382(6)–2.610(6) Å and 2.539(7)–2.572(7) Å, respectively, which are in accordance with previous reports.27,28,34–36 Adjoining Eu3+ ions are held together by four carboxylate groups to afford a paddle wheel-like [Eu2] cluster with the Eu–Eu separation of 3.85 Å. Two antiparallel 2-NCP− ligands bridge the adjacent clusters in trident coordination mode to form a dimeric unit (the coordination mode of 2-NCP− shown in Scheme 1b). With the [Eu2] cluster as the symmetric center, adjacent dimer units are held together to generate an infinite 1D chain. Moreover, the SA2− anions adopt μ3-η2:η1:η1:η1 coordination modes (Scheme 2b) and pillar the neighboring chains to give a “pillar-chain” type 2D layer (Fig. 9). Additionally, there are C–H⋯O intermolecular hydrogen-bonding interactions between carbon atoms and carboxylate oxygen atoms (d(C8–H8⋯O4#5) = 3.189 Å, <(C8–H8⋯O4#5) = 136°, symmetry code: #5: −x + 2, −y, −z + 1), which extend the 2D layers to a 3D framework (Fig. 10).


