 Open Access Article
Fe-MOFs prepared with the DBD plasma method for efficient Fenton catalysis
Xumei Tao *a,
Chao Suna,
Liang Huang*b,
Yuanyuan Hana and
Dongyan Xua
aState Key Laboratory Base for Eco-Chemical Engineering, College of Chemical Engineering, Qingdao University of Science and Technology, Qingdao 266042, Shandong, China. E-mail: qiqitxm_2002@sina.com.cn
bCollege of Electromechanical Engineering, Qingdao University of Science and Technology, Qingdao 266042, Shandong, China. E-mail: huangliang618@163.com
First published on 21st February 2019
Abstract
Fe-MOFs were successfully synthesized with the dielectric barrier discharge (DBD) plasma method, and applied for degradation of methyl orange by the Fenton process. Fe-MOFs were characterized by XRD, SEM, EDS, BET and FT-IR. A systematic study was carried out to optimize the synthesis conditions, taking into account the Fenton capacity performance for degradation of methyl orange. The optimal synthesis conditions were a discharge time of 100 min, discharge voltage of 18 kV, reactant concentration of 14 g L−1 and reactant mass ratio (TA![[thin space (1/6-em)]](https://www.rsc.org/images/entities/char_2009.gif) :
:![[thin space (1/6-em)]](https://www.rsc.org/images/entities/char_2009.gif) FeCl3·6H2O) of 1
FeCl3·6H2O) of 1![[thin space (1/6-em)]](https://www.rsc.org/images/entities/char_2009.gif) :
:![[thin space (1/6-em)]](https://www.rsc.org/images/entities/char_2009.gif) 5, with influence on the crystallization, morphologies and particle size. The degradation rate of methyl orange could reach 85% within 40 min with the MO concentration of 50 mg L−1, Fe-MOF dosage of 0.12 g L−1, pH of 5 and H2O2 at 1 mL L−1. Meanwhile, the Fenton catalytic process was conducted covering a range of catalyst concentrations, initial MO concentrations, pH and H2O2 amounts. Higher catalyst concentration, lower MO initial concentration, pH of 3 and H2O2 amount of 1 mL L−1 were conducive to the degradation efficiency.
5, with influence on the crystallization, morphologies and particle size. The degradation rate of methyl orange could reach 85% within 40 min with the MO concentration of 50 mg L−1, Fe-MOF dosage of 0.12 g L−1, pH of 5 and H2O2 at 1 mL L−1. Meanwhile, the Fenton catalytic process was conducted covering a range of catalyst concentrations, initial MO concentrations, pH and H2O2 amounts. Higher catalyst concentration, lower MO initial concentration, pH of 3 and H2O2 amount of 1 mL L−1 were conducive to the degradation efficiency.
1 Introduction
With the continuous development of modern industry, the wanton discharge of industrial wastewater and domestic sewage has caused different degrees of pollution in the water environment. Textile wastewater, paper making, printing, dyestuff, plastics and other industries produce a lot of wastewater, which leads to increasingly serious water pollution.1,2 Printing and dyeing wastewater is of high chromaticity, and some dyes are even considered toxic.3,4 At the same time, the organic matter in the wastewater will cause water body eutrophication. This will accelerate the growth of microorganisms in the water and destroy the ecological balance. Therefore, the treatment of printing and dyeing wastewater has become an urgent problem. Fenton degradation, as one of the advanced oxidation processes, has been demonstrated to be an efficient, economical and promising method, with strong oxidative capacity, rapid reaction rate, general applicability and mild reaction conditions.5 Therefore, it is imperative to find an efficient Fenton catalyst.Metal–organic frameworks (MOFs), with special crystalline nature and pore structure, tunable topology and metal sites,6 had great potential for Fenton catalysis. Lv H. et al.7 employed iron-based metal–organic framework for degradation of methylene blue wastewater by heterogeneous Fenton process, found that FeII@MIL-100(Fe) exhibited highest Fenton catalytic ability compared to MIL-100(Fe) and Fe2O3 catalysts. Martínez F. et al.8 applied Fe-based metal–organic frameworks Fe-BTC as catalyst for the degradation of methylene bule through Fenton oxidation, which evidenced a good catalytic performance. Besides Fe-based metal–organic frameworks, Cu9,10 and Co5,11 based metal–organic frameworks were also applied for Fenton catalysis.
It was worth noting that synthesis methods had significant influence on the Fenton catalytic performance. Low temperature plasma, as a novel method, was widely used for materials preparation and modification. Zhou Y.12 successfully loaded Pd particles into the pores of COPs and MOF-5 materials through plasma treatment, which achieved effective control of particle size and good oxidation activity. Decoste J. B. et al.13 improved the water stability of Cu-BET MOF materials by plasma chemical vapor deposition (PECVD) technology. Zhan14 activated Cu-MOF by dielectric barrier discharge (DBD) plasma to reduce content of adsorbed water in the Cu-MOFs structure and increase specific surface area, so as to reduce the initial transition temperature when catalyzing CO oxidation.
In this work, Fe based metal–organic frameworks were synthesized with DBD plasma method and applied for degradation of methyl orange (MO) wastewater by Fenton catalysis. A systematic study was carried out to optimize the synthesis conditions in terms of discharge time, discharge voltage, reactant concentration and reactant mass ratio, taking into account of the Fenton catalytic properties of Fe-MOFs. The Fenton catalytic process was conducted covering a range of catalyst concentration, MO initial concentration, pH and H2O2 amount conditions.
2 Experimental
2.1 Fe-MOFs synthesized with DBD plasma method
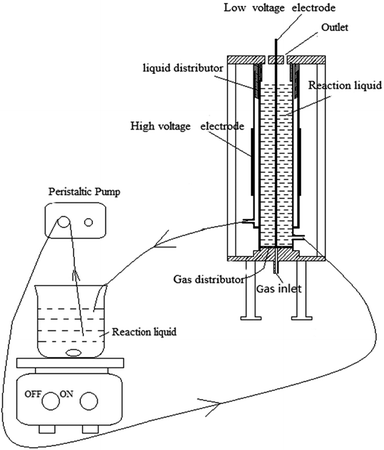
Synthesis of Fe-MOFs catalysts with DBD plasma technology was conducted. A certain amount of FeCl3·6H2O and 150 mL of N,N-dimethylformamide (DMF) for different mass ratio were added with stirring, followed by the addition of terephthalic acid (TA) and 150 mL of ethanol to the solution. After stirring for 0.5 h, the mixed solution was pumped into the DBD reactor and discharge for a certain time. The mixture after reaction was left for 24 h, and the solid products were dried at 160 °C for 4 h to remove DMF.The schematic diagram of DBD reactor was shown in Fig. 1. The reaction device consisted of two parts, the power system and the reaction system. The power system consisted of a peristaltic pump and a magnetic stirrer, providing power for the circulation of the solution. The reaction system consisted of a plasma discharge device and a quartz glass reactor, providing energy for the reaction of the solution. A voltage generator (CTP-2000K, Nanjing Suman Electronics Co, Ltd) was used to generate non-thermal plasma. The voltage was measured by oscilloscope (UTD2012CEX, UNI-T Co, Ltd). A stainless steel mesh served as high voltage electrode and a stainless steel rod served as low voltage electrode. The reactor consisted of two coaxial quartz tubes, with the mixed solution pumped to flow up through the inner quartz tube, then falling down on the outside of the inner tube, making a solution film. When the voltage was applied, discharge was generated, so that Fe-MOFs were synthesized.
To optimize the synthesis conditions, a systematic study was carried out in terms of discharge time, discharge voltage, reactant concentration and reactant mass ratio, as shown in Table 1. Fe-MOFs synthesized at optimal synthesis conditions were denoted as Fe-MOFs(o).
| Discharge time (min) | Discharge voltage (kV) | Reactant concentration (g L−1) | TA![[thin space (1/6-em)]](https://www.rsc.org/images/entities/char_2009.gif) : :![[thin space (1/6-em)]](https://www.rsc.org/images/entities/char_2009.gif) FeCl3·6H2O FeCl3·6H2O |
|---|---|---|---|
| Changed | 15.6 | 8 | 1![[thin space (1/6-em)]](https://www.rsc.org/images/entities/char_2009.gif) : :![[thin space (1/6-em)]](https://www.rsc.org/images/entities/char_2009.gif) 2 2 |
| 90 | Changed | 8 | 1![[thin space (1/6-em)]](https://www.rsc.org/images/entities/char_2009.gif) : :![[thin space (1/6-em)]](https://www.rsc.org/images/entities/char_2009.gif) 2 2 |
| 90 | 15.6 | Changed | 1![[thin space (1/6-em)]](https://www.rsc.org/images/entities/char_2009.gif) : :![[thin space (1/6-em)]](https://www.rsc.org/images/entities/char_2009.gif) 2 2 |
| 90 | 15.6 | 8 | Changed |
2.2 Materials characterization
The X-ray diffraction (XRD) was carried out on a RINT2000 vertical diffractometer with Cu Kα radiation operated at 40 kV and 150 mA. XRD patterns were scanned in the 2θ range of 3–80° at a scan rate of 10° min−1 (step size 0.02° s−1). The morphology of the samples was examined using scanning electron microscopy (SEM, JEOL JSM-6700F Japan). Energy dispersive spectroscopy (EDS) was used for qualitative detection of Fe, Cl, C and O elements in the Fe-MOFs. The BET specific surface areas were measured by N2 adsorption at −196 °C using an ASAP 2020 apparatus. The structures of the Fe-MOFs and Fe-MOFs after reaction were analyzed by Fourier transformed infrared spectroscopy (FT-IR).2.3 Fenton catalytic activity of Fe-MOFs
The Fenton catalytic activity was estimated for the degradation of 500 mL methyl orange (MO) with the MO concentration of 50 mg L−1, Fe-MOFs dosage of 0.12 g L−1, pH of 5 and H2O2 of 1 mL L−1. The Fenton catalytic process was conducted covering a range of catalyst concentration, MO initial concentration, pH and H2O2 amount conditions, as shown in Table 2. After reaction, the suspensions were centrifuged at 3000 rpm. The MO concentration in the supernatants was analyzed using UV-vis spectrophotometer at 463 nm.| Catalyst concentration (g L−1) | MO concentration (mg L−1) | pH | H2O2 amount (mL L−1) |
|---|---|---|---|
| Changed | 50 | 5 | 1 |
| 0.12 | Changed | 5 | 1 |
| 0.12 | 50 | Changed | 1 |
| 0.12 | 50 | 5 | Changed |
3 Results and discussion
3.1 Characterization of the samples
Fig. 2 showed the characteristic XRD patterns of Fe-MOFs synthesized with different conditions. All the samples possessed the main diffraction peaks at 2θ of about 9.7°, 12.6°, 19° and 22°, matching with XRD pattern of MOF-235 standard. The features of the peaks were sharp, narrow and symmetrical with stable baseline, and no diffraction peaks of impurities were discerned, suggesting high crystallinity and purity of Fe-MOFs. With the increasing discharge time, discharge voltage, reactant concentration, as well as reactant mass ratio, the XRD diffraction peaks of samples became sharper and narrower, then became much broader and of lower intensity, indicating the different crystallization and particle size.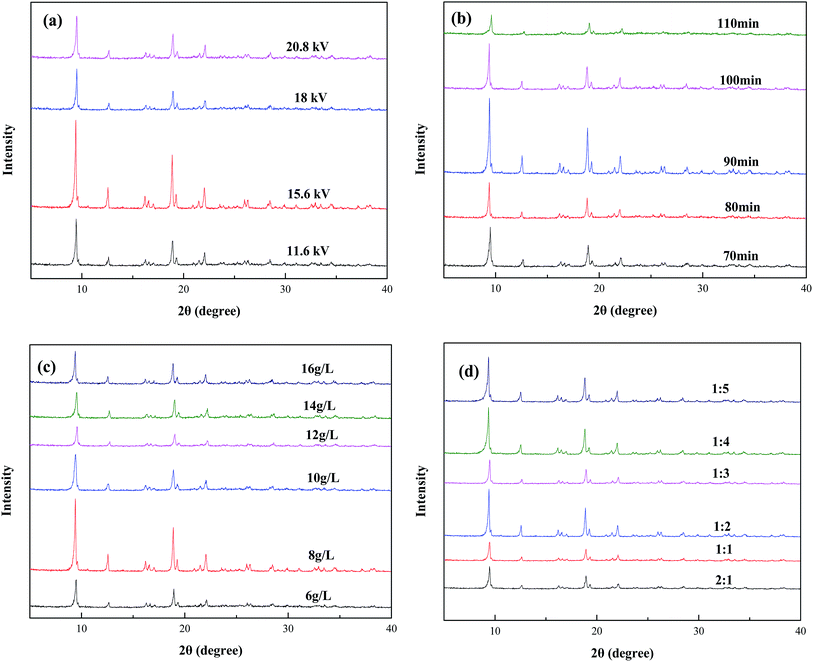 | ||
| Fig. 2 XRD patterns of Fe-MOFs synthesized with different conditions (a) discharge voltage, (b) discharge time, (c) reactant concentration, (d) reactant mass ratio. | ||
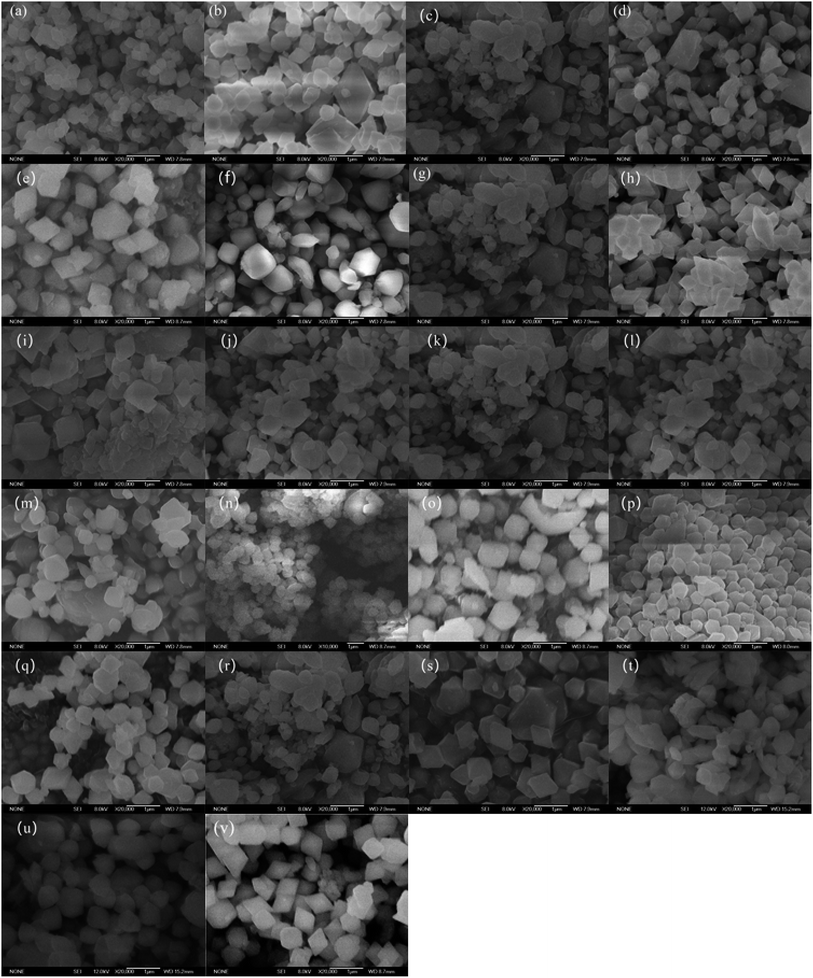
To further elucidate the influence of synthesis conditions on characteristics of Fe-MOFs, studies with SEM were carried out, as shown in Fig. 3. There were obvious differences in surface morphologies of Fe-MOFs synthesized with different conditions. It could be seen that different synthesis conditions induced different crystallization, which was consistent with XRD results. As shown in Fig. 3(a–e), with increasing discharge time, the crystals appeared more regular, and crystals with discharge time of 100 min seemed the most uniform with relatively smaller particle size. Fig. 3(f–i) showed the influence of discharge voltage on morphologies of Fe-MOFs, and crystals with discharge voltage of 18 kV appeared more regular and uniform. As shown in Fig. 3(j–o), higher reactant concentration induced regular and uniform crystallization, while there was accumulation between the crystals under lower reactant concentration. Relatively high and low reactant mass ratios (terephthalic acid (TA)![[thin space (1/6-em)]](https://www.rsc.org/images/entities/char_2009.gif) :
:![[thin space (1/6-em)]](https://www.rsc.org/images/entities/char_2009.gif) FeCl3·6H2O) were beneficial for crystallization, indicated by Fig. 3(p–u). Fe-MOFs(o) showed a more regular rhombus and clear crystals.
FeCl3·6H2O) were beneficial for crystallization, indicated by Fig. 3(p–u). Fe-MOFs(o) showed a more regular rhombus and clear crystals.
The EDS quantitative analysis was carried out on Fe-MOFs, and the relative contents of surface C, O, Fe and Cl were obtained, as shown in Table 3. It was indicated that with the increasing reactant mass ratios (TA![[thin space (1/6-em)]](https://www.rsc.org/images/entities/char_2009.gif) :
:![[thin space (1/6-em)]](https://www.rsc.org/images/entities/char_2009.gif) FeCl3·6H2O), the Fe elements on the surface of the sample increased, which was beneficial for Fenton reaction.
FeCl3·6H2O), the Fe elements on the surface of the sample increased, which was beneficial for Fenton reaction.
Samples (TA![[thin space (1/6-em)]](https://www.rsc.org/images/entities/char_2009.gif) : :![[thin space (1/6-em)]](https://www.rsc.org/images/entities/char_2009.gif) FeCl3·6H2O) FeCl3·6H2O) |
Element | EDS wt% |
|---|---|---|
1![[thin space (1/6-em)]](https://www.rsc.org/images/entities/char_2009.gif) : :![[thin space (1/6-em)]](https://www.rsc.org/images/entities/char_2009.gif) 4 4 |
C | 42.83 |
| O | 22.03 | |
| Cl | 9.79 | |
| Fe | 25.35 | |
1![[thin space (1/6-em)]](https://www.rsc.org/images/entities/char_2009.gif) : :![[thin space (1/6-em)]](https://www.rsc.org/images/entities/char_2009.gif) 5 5 |
C | 42.34 |
| O | 21.81 | |
| Cl | 9.86 | |
| Fe | 26.00 |
The nitrogen adsorption–desorption isotherms and pore size distribution curves of Fe-MOFs(o) were shown in Fig. 4. Fe-MOFs(o) displayed type IV isotherms according to the classification of Sing et al. which were typical for mesoporous materials. The higher the relative pressure, the larger adsorption amount was. The BJH Adsorption average pore diameter was 4.4 nm. The curves of Fe-MOFs(o) showed the generation of mesoporous and macropores, which were favorable for adsorption of MO. Table 4 showed the surface and pore properties of Fe-MOFs(o) sample.
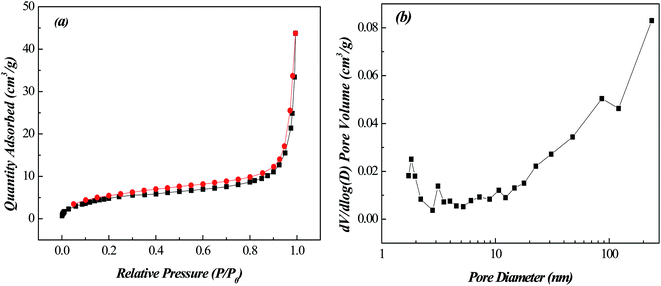 | ||
| Fig. 4 (a) Nitrogen adsorption–desorption isotherms and (b) pore size distribution of Fe-MOFs(o) sample. | ||
| Samples | Surface area (m2 g−1) | Average pore size (nm) | Pore volume (cm3 g−1) |
|---|---|---|---|
| Fe-MOF(o) | 18.5 | 19.5 | 0.064 |
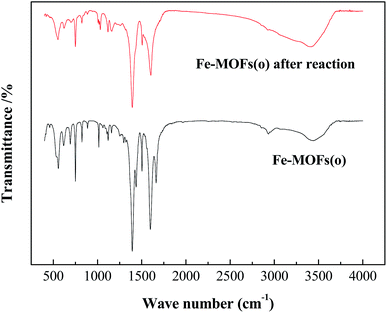
Fig. 5 illustrated the FT-IR spectrum of Fe-MOFs(o) and Fe-MOFs(o) after Fenton reaction. The FT-IR spectrum of Fe-MOFs contained the main peaks of 555 cm−1, 750 cm−1, 824 cm−1, 1015 cm−1, 1398 cm−1, 1597 cm−1, 2937 cm−1, 3421 cm−1 in accordance with that of MOF-235.15 The peaks at 3443 cm−1 were attributed to the vibration of –OH from the surface of the adsorbed water, and the weak peak at 2933 cm−1 corresponded to the telescopic vibration of the C–H bond in DMF. Peaks at 1597 cm−1 and 1398 cm−1 were the vibrations of carboxyl C–O. The bands at 1662–1393 cm−1 were the vibrant peak of the benzene ring, while bands at 1158–1015 cm−1 were telescopic vibration of carboxyl C![[double bond, length as m-dash]](https://www.rsc.org/images/entities/char_e001.gif) O double bond. Peaks at 555 cm−1 were the vibration of the C–Cl bond, and peaks at 749 cm−1 were the vibration of the two substitution bond of the benzene ring.
O double bond. Peaks at 555 cm−1 were the vibration of the C–Cl bond, and peaks at 749 cm−1 were the vibration of the two substitution bond of the benzene ring.
For the FT-IR spectrum of Fe-MOFs(o) after Fenton reaction, the peaks at 1604 cm−1 were the C–C bond vibration of benzene ring, and the peaks at 1505 cm−1 and 1116 cm−1 were C![[double bond, length as m-dash]](https://www.rsc.org/images/entities/char_e001.gif) N stretching vibration and 1,4 two substitution of benzene ring. The bands at 1395 cm−1 and 1152 cm−1 were the vibrations of the C–N bond, while the bands at 1030 cm−1 were the wave of –SO3Na. The FT-IR spectrum of Fe-MOFs(o) after Fenton reaction showed the existence of methyl orange, indicating that methyl orange adhered to the surface of metal–organic frameworks. Through adsorption of methyl orange on Fe-MOFs(o), the concentration of methyl orange near the catalyst increased, which could speed up the reaction. However, with the accumulation of methyl orange on the surface, the active sites were covered, and the catalytic performance of the catalysts decreased.
N stretching vibration and 1,4 two substitution of benzene ring. The bands at 1395 cm−1 and 1152 cm−1 were the vibrations of the C–N bond, while the bands at 1030 cm−1 were the wave of –SO3Na. The FT-IR spectrum of Fe-MOFs(o) after Fenton reaction showed the existence of methyl orange, indicating that methyl orange adhered to the surface of metal–organic frameworks. Through adsorption of methyl orange on Fe-MOFs(o), the concentration of methyl orange near the catalyst increased, which could speed up the reaction. However, with the accumulation of methyl orange on the surface, the active sites were covered, and the catalytic performance of the catalysts decreased.
3.2 Effect of synthesis conditions on Fenton catalytic performance
Fig. 6 showed Fenton catalytic performance of Fe-MOFs synthesized with different conditions for degradation of methyl orange. With the increasing discharge time, the Fenton catalytic activity increased and then decreased. Fe-MOFs with discharge time of 100 min showed the best degradation efficiency related to the uniform crystallization. Also, Fe-MOFs with discharge voltage of 18 kV, reactant concentration of 14 g L−1 and reactant mass ratios (TA![[thin space (1/6-em)]](https://www.rsc.org/images/entities/char_2009.gif) :
:![[thin space (1/6-em)]](https://www.rsc.org/images/entities/char_2009.gif) FeCl3·6H2O) of 1
FeCl3·6H2O) of 1![[thin space (1/6-em)]](https://www.rsc.org/images/entities/char_2009.gif) :
:![[thin space (1/6-em)]](https://www.rsc.org/images/entities/char_2009.gif) 5 exhibited better Fenton catalytic performance. The lower reactant concentration was not conducive to the combination of metal ions and organic ligands, while higher reactant concentration would exceed the carrying capacity of the solvent. With the increase of Fe ion content, the active sites on framework materials increased. Therefore, the optimal synthesis conditions were discharge time of 100 min, discharge voltage of 18 kV, reactant concentration of 14 g L−1 and reactant mass ratios (TA
5 exhibited better Fenton catalytic performance. The lower reactant concentration was not conducive to the combination of metal ions and organic ligands, while higher reactant concentration would exceed the carrying capacity of the solvent. With the increase of Fe ion content, the active sites on framework materials increased. Therefore, the optimal synthesis conditions were discharge time of 100 min, discharge voltage of 18 kV, reactant concentration of 14 g L−1 and reactant mass ratios (TA![[thin space (1/6-em)]](https://www.rsc.org/images/entities/char_2009.gif) :
:![[thin space (1/6-em)]](https://www.rsc.org/images/entities/char_2009.gif) FeCl3·6H2O) of 1
FeCl3·6H2O) of 1![[thin space (1/6-em)]](https://www.rsc.org/images/entities/char_2009.gif) :
:![[thin space (1/6-em)]](https://www.rsc.org/images/entities/char_2009.gif) 5. The degradation rate of methyl orange could reach 85% within 40 min with the MO concentration of 50 mg L−1, Fe-MOFs dosage of 0.12 g L−1, pH of 5 and H2O2 of 1 mL L−1.
5. The degradation rate of methyl orange could reach 85% within 40 min with the MO concentration of 50 mg L−1, Fe-MOFs dosage of 0.12 g L−1, pH of 5 and H2O2 of 1 mL L−1.
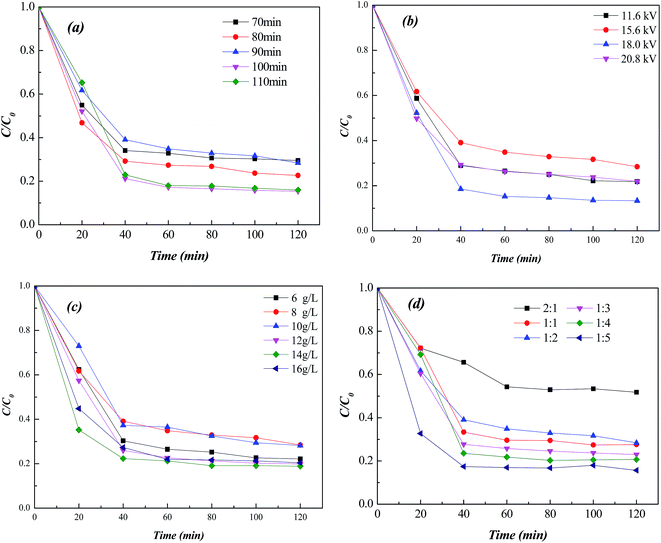 | ||
| Fig. 6 Effect of preparation conditions on Fenton catalytic activity (a) discharge time, (b) discharge voltage, (c) reactant concentration, (d) reactant mass ratio. | ||
3.3 Influence of reaction conditions on Fenton catalytic performance
Fig. 7 showed Fenton catalytic performance of Fe-MOFs under different reaction conditions, including catalyst concentration, MO initial concentration, pH and H2O2 amount. Higher catalyst concentration and lower MO initial concentration were conducive to the degradation efficiency because of the redundant active sites. The pH of 3 was beneficial for the Fenton reaction since pH significantly affected the solubility and oxidation state of Fe.16 H2O2 was the main source of hydroxyl radicals (·OH), which were the main reactive species in the Fenton reaction.17 H2O2 amount of 1 mL L−1 exhibited higher Fenton catalytic activity.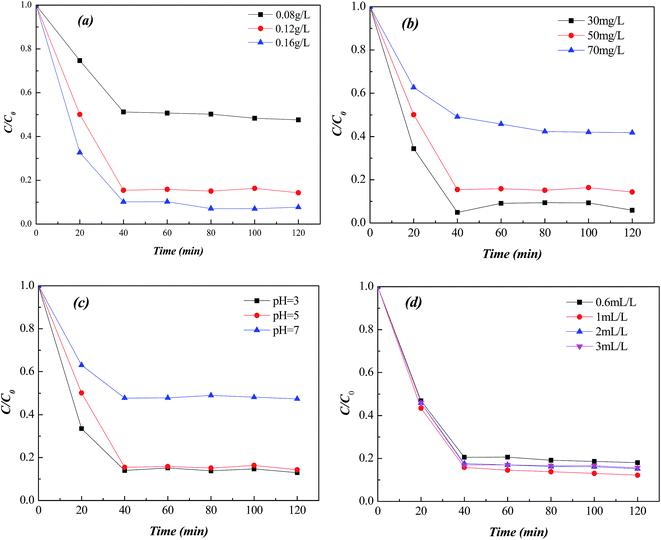 | ||
| Fig. 7 Influence of Fenton reaction conditions on catalytic activity (a) catalyst concentration, (b) MO concentration, (c) pH, (d) H2O2 amount. | ||
3.4 Comparison of Fenton catalytic properties with different materials
The Fenton catalytic performance of Fe-MOF(o) was compared with that of other catalysts shown in Table 5. The results showed that the catalytic performance of Fe-MOFs synthesized by DBD plasma method were favorable for MO degradation.| Sample | pH | H2O2 (mL L−1) | Catalyst concentration (g L−1) | Dyes | C0 (mg L−1) | Reaction time (min) | Degradation rate (%) | Ref. |
|---|---|---|---|---|---|---|---|---|
| Fe3O4@MIL-100(Fe) | 3 | 1.2 | 0.1 | MB | 50 | 120 | 99 | 18 |
| MIL-100(Fe)/GO | 3 | 0.24 | 0.5 | MO | 50 | 240 | 99 | 19 |
| NH2-MIL-88B(Fe) | 5.6 | 6 | 0.2 | MB | 20 | 60 | 98 | 20 |
| FeSO4 | 2.5 | 0.003 | 0.14 | MO | 10 | 120 | 80 | 21 |
| MOF-235 | 3 | 1.2 | 0.2 | MO | 40 | 30 | 80 | 22 |
| Fe-MOF(o) | 5 | 1 | 0.12 | MO | 50 | 40 | 85 | This work |
3.5 MOFs preparation and reaction mechanism
It was speculated how the DBD plasma could induce the crystal growth process. In the conventional hydrothermal process, the reaction to form precursor of Fe-MOFs is induced by heating, when the concentration of precursor increased at certain degree, the Fe-MOFs crystals nucleated near the walls or on dust particles.23 In DBD plasma MOFs preparation, there were a lot of micro-discharge channels, which composed of charged particles, photons and active neutral particles, profiled uniformly on the surface of solution film. The temperature in the channels could be hundreds kelvin, the energy of charged particles could be several eV by strong electric field impact.24 These particles collided with DMF, released their energy and formed much local superheat spots at the surface of solution film. It was these superheat spots that induced the reaction to form precursor of Fe-MOFs at ambient temperature and pressure. The concentration of precursor increased as circulation, and led to nucleation growth, as well as higher yields.Identifying fundamental characteristics of the reaction process was very important for elucidation of catalysis mechanism. During the reaction, Fe-MOFs could adsorb methyl orange, while methyl orange would enter the pores of Fe-MOFs. The adsorption capacity of Fe-MOFs would enhance the concentration of methyl orange around the material, which could react quickly with hydroxyl radicals (·OH). The hydroxyl radicals (·OH) produced by the Fenton reaction was rapidly consumed, that could accelerate the Fenton reaction. The whole reaction process was restricted around the material, reducing the time wastage of the transmission process. FT-IR data showed that some of the methyl orange would adhere to the surface of the material as the reaction proceeded. That would cover the active sites and reduce the reaction speed. After a period of reaction, the reaction rate gradually decreased and reached a balance.
4 Conclusions
In this paper, Fe-MOFs were successfully synthesized with dielectric barrier discharge (DBD) plasma method, and characterized by XRD, SEM, EDS and FT-IR. A systematic study was carried out to optimize the synthesis conditions, taking into account of the Fenton capacity performance for degradation of methyl orange. The optimal synthesis conditions were discharge time of 100 min, discharge voltage of 18 kV, reactant concentration of 14 g L−1 and reactant mass ratios (TA![[thin space (1/6-em)]](https://www.rsc.org/images/entities/char_2009.gif) :
:![[thin space (1/6-em)]](https://www.rsc.org/images/entities/char_2009.gif) FeCl3·6H2O) of 1
FeCl3·6H2O) of 1![[thin space (1/6-em)]](https://www.rsc.org/images/entities/char_2009.gif) :
:![[thin space (1/6-em)]](https://www.rsc.org/images/entities/char_2009.gif) 5, with influence on the crystallization, morphologies and particle size. The degradation rate of methyl orange could reach 85% within 40 min with the MO concentration of 50 mg L−1, Fe-MOFs dosage of 0.12 g L−1, pH of 5 and H2O2 of 1 mL L−1. Meanwhile, the Fenton catalytic process was conducted covering a range of catalyst concentration, MO initial concentration, pH and H2O2 amount conditions. Higher catalyst concentration, lower MO initial concentration, pH of 3 and H2O2 amount of 1 mL L−1 were conducive to the degradation efficiency.
5, with influence on the crystallization, morphologies and particle size. The degradation rate of methyl orange could reach 85% within 40 min with the MO concentration of 50 mg L−1, Fe-MOFs dosage of 0.12 g L−1, pH of 5 and H2O2 of 1 mL L−1. Meanwhile, the Fenton catalytic process was conducted covering a range of catalyst concentration, MO initial concentration, pH and H2O2 amount conditions. Higher catalyst concentration, lower MO initial concentration, pH of 3 and H2O2 amount of 1 mL L−1 were conducive to the degradation efficiency.
Conflicts of interest
There are no conflicts to declare.Acknowledgements
The authors would like to thank Haipeng Xu for useful discussions and helps.References
- Q. Wang and Z. Yang, Industrial water pollution, water environment treatment, and health risks in China, Environ. Pollut., 2016, 218, 358–365, DOI:10.1016/j.envpol.2016.07.011.
- J. Xiao, Y. Xie and F. Nawaz, et al., Dramatic coupling of visible light with ozone on honeycomb-like porous g-C3N4, towards superior oxidation of water pollutants, Appl. Catal., B, 2016, 183, 417–425, DOI:10.1016/j.envpol.2016.07.011.
- X. Zhong, Y. U. Yang and S. Liu, et al., Study on advanced treatment of printing and dyeing wastewater by combination of nano zero-valent iron and a EGSB reactor, Environ. Sci. Technol., 2016, 39(5), 80–84, DOI:10.3969/j.issn.1003-6504.2016.05.016.
- D. X. Hu, M. H. Cui and Z. B. Chen, et al., Performance of a novel HABR–CFASR system for the biological treatment of mixed printing and dyeing wastewater (MPDW), Desalin. Water Treat., 2014, 52(28–30), 5553–5562, DOI:10.1080/19443994.2013.813005.
- H. Zhao, Y. Chen and Q. Peng, et al., Catalytic activity of MOF(2Fe/Co)/carbon aerogel for improving H2O2 and ·OH generation in solar photo-electro-Fenton process, Appl. Catal., B, 2017, 203, 127–137, DOI:10.1016/j.apcatb.2016.09.074.
- L. Jiao, Y. Wang and H. L. Jiang, et al., Metal-organic frameworks as platforms for catalytic applications, Adv. Mater., 2017, 1703663, 1–23, DOI:10.1002/adma.201703663.
- H. Lv, H. Zhao and T. Cao, et al., Efficient degradation of high concentration azo-dye wastewater by heterogeneous Fenton process with iron-based metal-organic framework, J. Mol. Catal. A: Chem., 2015, 400, 81–89, DOI:10.1016/j.molcata.2015.02.007.
- G. Calleja, R. Sanz and G. Orcajo, et al., Copper-based MOF-74 material as effective acid catalyst in Friedel–Crafts acylation of anisole, Catal. Today, 2014, 227(10), 130–137, DOI:10.1016/j.cattod.2013.11.062.
- L. J. Han, Y. J. Kong and T. J. Yan, et al., A new five-coordinated copper compound for efficient degradation of methyl orange and Congo red in the absence of UV-visible radiation, Dalton Trans., 2016, 45, 18566–18571, 10.1039/C6DT03273G.
- Y. Xiong, L. Che and Z. Fu, et al., Preparation of CuxO/C composite derived from Cu-MOFs as Fenton-like catalyst by two-step calcination strategy, Adv. Powder Technol., 2018, 29(6), 1331–1338, DOI:10.1016/j.apt.2018.02.028.
- X. Li, J. Liu and A. I. Rykov, et al., Excellent photo-Fenton catalysts of Fe-Co Prussian blue analogues and their reaction mechanism study, Appl. Catal., B, 2015, 179, 196–205, DOI:10.1016/j.apcatb.2015.05.033.
- Y. Zhou, Porous organic frameworks supported noble metal catalysts prepared by plasma, PhD thesis, Tianjin University, 2010.
- J. B. Decoste, G. W. Peterson and M. W. Smith, et al., Enhanced stability of Cu-BTC MOF via perfluorohexane plasma-enhanced chemical vapor deposition, J. Am. Chem. Soc., 2012, 134(3), 1486–1489, DOI:10.1021/ja211182m.
- Z. B. Zhan, Activation and properties of metal-organic framework (Cu-MOF) by atmospheric pressure cold plasma, PhD thesis, Dalian University, 2017.
- M. Anbia, V. Hoseini and S. Sheykhi, Sorption of methane, hydrogen and carbon dioxide on metal-organic framework, iron terephthalate (MOF-235), J. Ind. Eng. Chem., 2012, 18(3), 1149–1152, DOI:10.1016/j.jiec.2012.01.014.
- F. C. Moreira, A. R. B. Rui and E. Brillas, et al., Electrochemical advanced oxidation processes: a review on their application to synthetic and real wastewaters, Appl. Catal., B, 2016, 202, 217–261, DOI:10.1016/j.apcatb.2016.08.037.
- F. F. Dias, A. A. S. Oliveira and A. P. Arcanjo, et al., Residue-based iron catalyst for the degradation of textile dye via heterogeneous photo-Fenton, Appl. Catal., B, 2016, 186, 136–142, DOI:10.1016/j.apcatb.2015.12.049.
- H. Zhao, L. Qian and H. Lv, et al., Introduction of a Fe3O4 core enhances the photocatalytic activity of MIL-100(Fe) with tunable shell thickness in the presence of H2O2, ChemCatChem, 2016, 7(24), 4148–4155, DOI:10.1002/cctc.201500801.
- J. Tang and J. Wang, Fe-based metal organic framework/graphene oxide composite as an efficient catalyst for Fenton-like degradation of methyl orange, RSC Adv., 2017, 7, 50829–50837, 10.1039/C7RA10145G.
- J. He, Y. Zhang and X. Zhang, et al., Highly efficient Fenton and enzyme-mimetic activities of NH2-MIL-88B(Fe) metal organic framework for methylene blue degradation, Sci. Rep., 2018, 8(1), 5159–5166, DOI:10.1038/s41598-018-23557-2.
- W. Luo, M. E. Abbas and L. Zhu, et al., Rapid quantitative determination of hydrogen peroxide by oxidation decolorization of methyl orange using a Fenton reaction system, Anal. Chim. Acta, 2008, 629(1), 1–5, DOI:10.1016/j.aca.2008.09.009.
- Y. Zhang, J. Li and C. Jiang, et al., Hydroxylamine hydrochloride enhanced MOF-235(Fe)/H2O2 Fenton-link process for the catalytic degradation of methyl orange in water, Environ. Eng., 2018, 36, 70–75 Search PubMed.
- Z. Ni and R. I. Masel, Rapid production of metal organic frameworks via microwave-assisted solvothermal synthesis, J. Am. Chem. Soc., 2006, 128(38), 12394–12395, DOI:10.1021/ja0635231.
- U. Kogelschatz, Dielectric-Barrier Discharges: Their History, Discharge Physics, and Industrial Applications, Plasma Chem. Plasma Process., 2003, 23(1), 1–46, DOI:10.1023/A:1022470901385.
| This journal is © The Royal Society of Chemistry 2019 |

