 Open Access Article
A fluorescent biosensor for cardiac biomarker myoglobin detection based on carbon dots and deoxyribonuclease I-aided target recycling signal amplification†
Jishun Chenab,
Fengying Ranb,
Qinhua Chen bc,
Dan Luob,
Weidong Maa,
Tuo Hana,
Ceming Wangb and
Congxia Wang
 *a
*a
aDepartment of Cardiology, The Second Affiliated Hospital of Xi'an Jiaotong University, Xi'an, Shanxi 710004, China. E-mail: wcx622@163.com; Tel: +86-02987679770
bAffiliated Dongfeng Hospital, Hubei University of Medicine, Shiyan, Hubei 442008, China
cShennongjia Golden Monkey Key Laboratory of Conservation Biology in Hubei Province, Shennongjia, Hubei 442400, China
First published on 4th February 2019
Abstract
A sensitive biosensor using carbon dots and deoxyribonuclease I-aided target recycling signal amplification has been developed to detect myoglobin (MB), which is an important cardiac biomarker and plays a major role in the diagnosis of acute myocardial infarction (AMI). Here, in the absence of MB, the MB aptamer (Ap) is absorbed on the surface of carbon dots (CDs) through π–π stacking interactions, resulting in quenching of the fluorescent label by forming CD–aptamer complexes. Upon adding MB, the Ap sequences could be specifically recognized by MB, leading to the recovery of quenched fluorescence. Thus, quantitative evaluation of MB concentration has been achieved in a broad range from 50 pg mL−1 to 100 ng mL−1, and the detection limit is as low as 20 pg mL−1. This strategy is capable of specific and sensitive detection of MB in human serum, urine, and saliva and can be used for the diagnosis of AMI in the future.
1. Introduction
Acute myocardial infarction (AMI) is one of the leading causes of death in most developing and developed countries,1 the early and quick diagnosis of AMI is extremely important. The World Health Organization (WHO) figures show that different cardiac biomarkers that can diagnose and monitor AMI levels, such as creatine kinases (CK-MB), C-reactive protein (CRP), troponins and myoglobin (MB), are several very early markers that increase after AMI.2,3 Thus, the development of rapid and accurate detection method of AMI biomarkers is extremely urgent.MB is one of the best indicators of AMI,4,5 it is an oxygen-carrying monomeric hemeprotein found in heart and skeletal muscles, and its main function is the uptake of oxygen from oxy-hemoglobin in the bloodstream.6 When muscle cells are damaged, MB will be rapidly released into the circulation.7 Therefore, the determination of serum MB can be used as an important biomarker of cardiac injury in the early stage of the disease. To date, some conventional methods have been employed to detect MB, such as electrochemical,8–10 immunoassay,11 surface plasmon resonance sensor (SPR),12 colorimetric biosensors,13,14 surface-enhanced Raman spectroscopy,15 single polyaniline nanowire biosensor,16 electrosynthesis of molecularly imprinted polymer,17 and fluorescence.18 Among the reported methods, fluorescence-based methods have attracted special attention due to their high sensitivity, specificity, easy readout and simple instruments.19,20 Despite many advances in this field, however, fluorescence methods suffer from several limitations including the high-cost material, fluorescence labeling and the use of traditional low light stability fluorescent dyes. Thus, it is still urgent and significant to develop a simple and sensitive method for MB detection.
Aptamers, as an artificial DNA or RNA molecules (approximately 12–80 nucleotides), can bind to cells, proteins and small molecules with high specificity, selectivity, and sensitivity.21,22 Compared with antibodies and enzymes, aptamers show one important advantage is that more stable and high resistance in the environment, easy artificial synthesis and easy storage.23,24 Moreover, aptamers can show high specificity and affinity for their targets, due to their structural flexibility and easily bear labels allows for adaptability of significant conformational changes after specific binding of aptamers to targets.25 Thus, aptamers have been widely used in the biometrics of proteins, cancer cells, and tumor medicine.26
Nowadays, several fluorescent nanomaterials have been employed to provide fluorescence response, such as organic dyes, quantum dots (QDs) and noble metal nanoclusters (NCs) have been reported of biosensing.27 However, there are some disadvantages including poor photostability, low solubility in water and narrow excitation spectra. It is necessary to search for better fluorophores in biological applications. The fluorescent carbon dots (CDs), as a new class of carbon-based nonmaterial's that quasispherical nanoparticles less than 10 nm in size,28 ease of synthesis, superior water dispersibility and stable fluorescence intensity.29 Consequently, CDs are attracted numerous attentions, and make its promising candidates for biosensor and clinical diagnostics.30–32 Meanwhile, because of the ratio of the aptamer to target is 1![[thin space (1/6-em)]](https://www.rsc.org/images/entities/char_2009.gif) :
:![[thin space (1/6-em)]](https://www.rsc.org/images/entities/char_2009.gif) 1 in almost all technologies, thus their ordinarily show low sensitivity and a high error rate. To overcome these limitations, the enzyme-aided signal amplification, including DNAzymes, exonucleases, nicking endonucleases, deoxyribonuclease I (DNase I), etc., have recently been developed to achieve the sensitive detection of biomolecules.33–35 Among these enzyme-aided signal amplification, DNase I has the advantages of being highly sensitive, easy to use and inexpensive, reliable and specific.36 Moreover, DNase I can cleave phosphodiester bonds to product many polynucleotides with 5′–phosphate and 3′–OH groups, but cannot digest RNA sequences.37,38 Thus, these make it suitable for MB detection based on DNase I-assisted target recycling and signal amplification.
1 in almost all technologies, thus their ordinarily show low sensitivity and a high error rate. To overcome these limitations, the enzyme-aided signal amplification, including DNAzymes, exonucleases, nicking endonucleases, deoxyribonuclease I (DNase I), etc., have recently been developed to achieve the sensitive detection of biomolecules.33–35 Among these enzyme-aided signal amplification, DNase I has the advantages of being highly sensitive, easy to use and inexpensive, reliable and specific.36 Moreover, DNase I can cleave phosphodiester bonds to product many polynucleotides with 5′–phosphate and 3′–OH groups, but cannot digest RNA sequences.37,38 Thus, these make it suitable for MB detection based on DNase I-assisted target recycling and signal amplification.
Hence, we report a sensitive and rapid aptasensing platform for the detection of MB based on the carbon dots and DNase I-aided target recycling signal amplification. In this work, upon addition of MB, the MB aptamer can recognize MB specifically and result in aptamer being away from CDs, then, while the DNase I is introduced, the DNase I target recycling signal amplification strategy, lead to cyclic reuse of the MB and quantities of MB can be achieved by fluorescence increment, was the MB concentration linear range from 50 pg mL−1 to 100 ng mL−1, and the detection limit of as low as 20 pg mL−1. More importantly, the sensor has been successfully applied to the detection of MB in various spiked biological samples, thus, this study not only provides a reliable method for the sensitive detection of MB, but also indicates that CDs and DNase I have becoming a promising star in the application of clinical diseases diagnosis.
2. Experimental section
2.1. Reagents and materials
The deoxyribonuclease I (DNase I) were obtained from solarbio (Beijing, China, http://www.solarbio.com). The MB, CD63, BSA, EPCAM and VEGF were purchased from Cusabio Biotech Co. Ltd. (http://www.cusabio.cn/). The MB aptamer (5′-CCCTCCTTTCCTTCGACGTAGATCTGCTGCGTTGTTCCGA-3′-FAM) were synthesized by Sangon Biological Engineering Technology Co., Ltd. (Shanghai, China, http://www.sangon.com) and purified using high performance liquid chromatography. All reagents employed were of analytical grade and used without further purification. And were diluted to the required concentration with working buffer (10 mM Tris, 100 mM NaNO3, pH 7.4) before usage. This study all experiments were performed in compliance with the relevant laws and institutional guidelines (National Health Commission of the people's Republic of china, ethical review of biomedical research involving human beings), healthy human serum, urine and saliva were provided by Affiliated Dongfeng Hospital, Hubei University of Medicine, and approved by Dongfeng Hospital's Ethics Committee, informed consent was obtained for any experimentation with human subjects. Ultrapure water obtained from a Millipore water purification system (18.2 MΩ cm resistivity, Milli-Q Direct 8) was used in all runs.2.2. Synthesis of CDs
The CDs were synthesized by an electro-chemical method. In a typical procedure, Firstly, two graphite rods (diameter 6.15 mm, length 15 cm) were placed into ultrapure water. Then, a bias of 30 eV was applied to the two electrodes and constant stirring for 120 h. Afterward, the dark yellow solution was formed. After that, the resultant solution was filtered for three times and formed the CDs solution. Lastly, the CDs solution though treated in a freeze-drying way and acquired the CDs powder.2.3. Apparatus and measurements
Firstly, the 30 nM FAM labeled MB aptamer (Ap) and a desired concentration of MB was first mixed and kept at 37 °C for 20 min, followed by adding 20 μg mL−1 of CDs. 5 min later, the reaction solution was added with 6 U mL−1 DNase I and incubated at 37 °C for 30 min. Finally, the fluorescence of the mixture was carried out on a Hitachi F-4600 spectrophotometer (Hitachi Co. Ltd, Japan) equipped with a xenon lamp excitation source at room temperature. The excitation was set at 495 nm and the emission spectra were collected from 510 nm to 600 nm. The fluorescence intensity at 517.6 nm was used to choose the optimal experimental conditions and evaluate the performance of the proposed sensing system. In control experiments, the measurement process was all the same with the above except the addition of MB. Unless otherwise noted, each fluorescence measurement was repeated three times, and the standard deviation was plotted as the error bar.3. Results and discussion
3.1. Characterization of CDs and principle of design
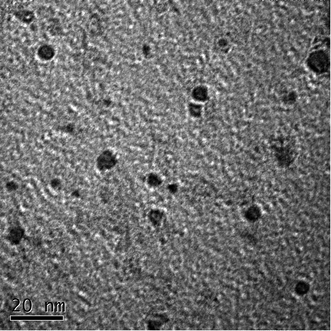
Fig. 1 shows the TEM image of the CDs, it is consistent with the publicly reported CDs structure.39 And the more characterizations of as-synthesized CDs are shown in ESI.† In the present study, the principle of fluorescent biosensor detection of MB based on carbon dots and DNase I-aided target recycling signal amplification is illustrated in Fig. 2. According to the literature report, the as prepared C-dots are predominantly multi-layer graphene oxide, therefore, C-dots has similar characteristics to GO, the ability to adsorb single-stranded DNA by π–π stacking interactions is weaker than that of small fragment DNA.40–42 Thus, in the absence of MB, the CDs enabled strong adsorption of Ap to the surface of CDs, leading to the effective fluorescence quenching. Upon the addition of MB, the stronger binding affinity between MB and their corresponding aptamers induced unwinding of MB-aptamer from the CDs surface, resulting in the recovery of quenched fluorescence. Then, when the DNase I is added, all DNA sequences are degraded, leading to the release of MB and FAM fluorophores. The released MB is recycled repeatedly, resulting in the accumulation of free FAM fluorophores. Thus, the fluorescence signal is significantly amplified by DNase I-mediated target recycling process, and the quantities of MB can be achieved by fluorescence increment.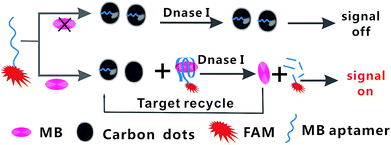 | ||
| Fig. 2 Schematic illustration of the fluorescent biosensor assay detection of MB by using carbon dots and DNase I-mediated target cyclic amplification. | ||
3.2. Feasibility analysis of the developed method for MB detection
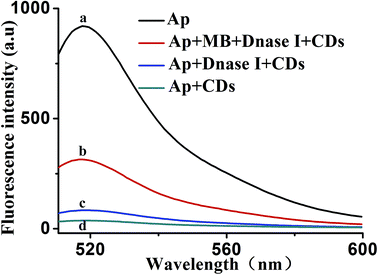
To further verify the feasibility of the proposed mechanism. Fig. 3 shows the fluorescence emission spectra of the Ap under different conditions. The fluorescence of the 30 nM Ap alone displayed a strong fluorescence emission, which acted as the control experiment (curve a). The introduction of CDs–aptamer complexes quenched the fluorescence emission (curve d), resulting in an intensity decreased remarkably that of the control experiment. It is suggested that CDs can interact with the Ap and absorb it. When DNase I was added to a solution of 30 nM Ap and 20 μg mL−1 CDs, the fluorescence intensity do not obviously increase (curve c), indicating the Ap cannot specifically bind to MB, lead to the FAM fluorophores are produced. However, upon adding MB, significant enhancement of the fluorescence intensity was observed (curve b), as a result of the stronger binding affinity between MB and their corresponding aptamers induced unwinding of MB-aptamer from the CDs surface. More importantly, the DNase I-aided target recycling results in the significant fluorescence amplification. These results suggested that CDs and DNase I can be used as a sensing platform for MB.3.3. Optimization of reaction conditions
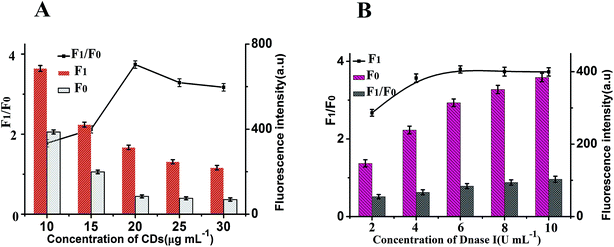
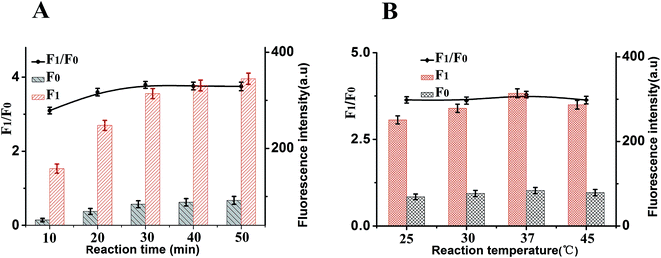
To achieve optimal sensing performance, several reaction conditions such as the concentration of DNase I, the concentration of CDs, the enzyme digestion time and reaction temperature were optimized. The F1 and F0 were the fluorescence intensities in the presence and absence of MB, respectively. The fluorescence intensity and the value of F1/F0 are selected to evaluate the effects of the reaction conditions on the sensing performance of the assay. Fig. 4A illustrates how the fluorescence change is related to the concentration of CDs after the isothermal amplification; the highest F1/F0 ratio for this work was detected when the concentration of CDs was 20 μg mL−1. Thus, 20 μg mL−1 CDs was employed for analytical purpose in this method. The concentration of DNase I plays an important role in this sensor. In order to obtain high sensitivity, the concentration of DNase I should be optimized. As depicted in Fig. 4B, with the increase in the concentration of DNase I, the fluorescence intensity initially increased and then gradually decrease, and maximum F1/F0 values are observed when the concentration of DNase I is 6 U mL−1. Thus, 6 U mL−1 DNase I was selected for the rest of the experiments.In addition, other experimental conditions, such as the enzyme digestion time and reaction temperature can also affect the detection sensitivity. A series of experiments were carried out to optimize the sensitivity of this sensor. As shown in Fig. 5A, maximum F1/F0 values are observed when enzyme digestion time is 30 min. Thus, 30 min of enzyme digestion time was used in the subsequent experiments. The effect of the enzyme reaction temperature has also been investigated. As shown in Fig. 5B, the maximum F1/F0 signal was obtained at 37 °C. Therefore, an enzyme reaction temperature of 37 °C was selected in this work.
3.4. Sensitivity and specificity
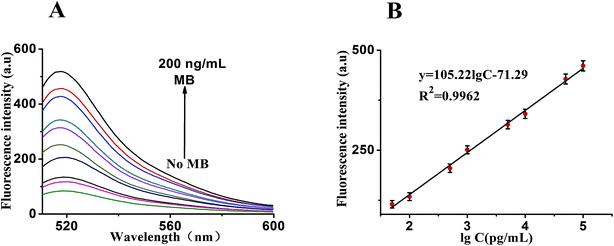
Under the optimal reaction conditions, the sensitivity of the sensor for detection of MB is investigated. Fig. 6A shows the fluorescence emission spectra of the biosensor incubated in different concentrations of MB (0, 100 pg mL−1, 500 pg mL−1, 1 ng mL−1, 5 ng mL−1, 10 ng mL−1, 50 ng mL−1, 100 ng mL−1 and 200 ng mL−1). We found that the fluorescence intensity decreased proportionally with the amount of MB introduced. It illustrates a strong concentration dependence of the sensor for detection of MB. At the same time, Fig. 6B shows a good linear correlation between the fluorescence intensity and the concentration of MB in the range from 50 pg mL−1 to 100 ng mL−1. The calibration plot of the linear equation is given as y = 105.22![[thin space (1/6-em)]](https://www.rsc.org/images/entities/char_2009.gif) lg
lg![[thin space (1/6-em)]](https://www.rsc.org/images/entities/char_2009.gif) c − 71.29 (R2 = 0.9962), where lg
c − 71.29 (R2 = 0.9962), where lg![[thin space (1/6-em)]](https://www.rsc.org/images/entities/char_2009.gif) c is the logarithm of MB concentration and y is the fluorescence intensity. Furthermore, the detection limit is at 20 pg mL−1. Suggesting the sensitivity of this analytical strategy. As far as we know, the linear range and the detection limit here we showed was obviously superior compared with those of previous reports Table 1 demonstrating that the approach we proposed may match the higher requirement for assaying MB.
c is the logarithm of MB concentration and y is the fluorescence intensity. Furthermore, the detection limit is at 20 pg mL−1. Suggesting the sensitivity of this analytical strategy. As far as we know, the linear range and the detection limit here we showed was obviously superior compared with those of previous reports Table 1 demonstrating that the approach we proposed may match the higher requirement for assaying MB.
| Analytical method | Detection limit | Linear range | Ref. |
|---|---|---|---|
| Electrochemical | 2.25 μg mL−1 | 0.852–4.26 μg mL−1 | 8 |
| Immunoassay | 0.18 ng mL−1 | 17.8 pg mL−1 to 356 ng mL−1 | 11 |
| Surface-enhanced Raman spectroscopy | 10 ng mL−1 | 10 ng mL−1 to 5μg mL−1 | 15 |
| Colorimetric biosensor | 44.5 ng mL−1 | 44.5 ng mL−1 to 1.78 μg mL−1 | 13 |
| Electrochemical | 2.1 pg mL−1 | 0.001 ng mL−1 to 100 mg mL−1 | 9 |
| Single polyaniline nanowire biosensor | 1.4 ng mL−1 | 1.4 ng mL−1 to 2.5 μg mL−1 | 16 |
| Electrochemical aptasensor | 0.45 ng mL−1 | 1.78–712 ng mL−1 | 10 |
| Electrosynthesis of molecularly imprinted polymer | 9 ng mL−1 | 17.8 ng mL−1 to 17.8 μg mL−1 | 17 |
| Surface plasmon resonance sensor | 87.6 ng mL−1 | 0.1–10 μg mL−1 | 12 |
| Fluorescence | 16 ng mL−1 | 20–30 ng mL−1 | 18 |
| Colorimetric sensing | 0.01 μg mL−1 | 0.91–18.2 μg mL−1 | 14 |
| Fluorescent biosensor | 20 pg mL−1 | 50 pg mL−1 to 100 ng mL−1 | This method |
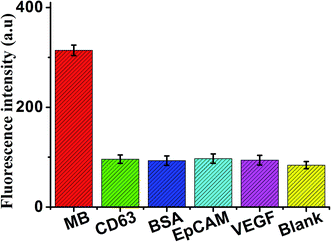
In addition, for the specificity study, adding different control proteins was investigated, including CD63, BSA, EpCAM, and VEGF, these concentrations of 50 ng mL−1. As shown in Fig. 7, in the presence of other control proteins, the significant increase of fluorescence signal is observed in the presence of the MB (5 ng mL−1), indicating that this proposed strategy exhibited good specificity for MB detection.
3.5. Analysis of MB in real samples
To further verify the potential applicability of this present strategy in biological samples, the detection of MB in biological samples by spiking MB to human urine, saliva and serum diluted to 10% with a buffer solution with the final concentration of 5 ng mL−1 were performed. As shown in Fig. 8, a significant increase in various biological samples is observed, compared with no spiking biological samples. These results clearly demonstrate that this sensor can be a potential analytical method to detect MB in real samples sensitively.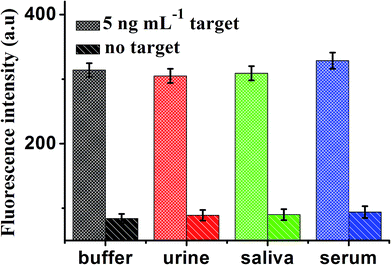 | ||
| Fig. 8 Fluorescence intensity of the sensor for detection of MB in buffer and blank biological samples (human urine, saliva and serum, respectively). Error bars: SD, n = 3. | ||
4. Conclusions
In summary, a specific and sensitive strategy for assaying MB using carbon dots and DNase I-aided target recycling signal amplification sensing platform was proposed. The fluorescence of the FAM-labeled MB aptamer was quenched efficiently by CDs in the absence of the target MB. Upon the addition of MB, the Ap and MB formed complexes that remained away from the CDs surface, and thereby preserved the fluorescence of FAM. As to MB, this sensor can detect MB with a linear range from 50 pg mL−1 to 100 ng mL−1, and the detection limit was low to 20 pg mL−1, indicating high sensitivity. Additionally, the fluorescence signals are also obtained when this sensor is used for biological samples. Aptamer can recognize MB specifically, and thus provide a promising method for its assay, this promising strategy might prove feasible as an MB assay for real samples. We believe that the present work will demonstrate its potentials for practical applications in cardiac disease diagnostics.Conflicts of interest
There are no conflicts to declare.Acknowledgements
These works were supported by the National Natural Science Foundation of China (81872509), Open Project Fund of Shennongjia Golden Monkey Conservation Biology Hubei Provincial Key Laboratory (201801), Hubei Provincial Technology Innovation Project (2017ACA176), Hubei University of Medicine Free exploration Project (FDFR201804), the Natural Science Foundation of Hubei Provincial Department of Education (No. B2016140), the Science and Technology Key Program of Shiyan (No. 18Y81 and 18Y82) and Hubei Province Health and Family Planning Scientific Research Project (WJ2019M054).References
- A. L. Straface, J. H. Myers, H. J. Kirchick and K. E. Blick, Am. J. Clin. Pathol., 2008, 129, 788–795 CrossRef PubMed.
- J. S. Alpert, K. Thygesen, E. Antman and J. P. Bassand, J. Am. Coll. Cardiol., 2000, 36, 959–969 CrossRef CAS PubMed.
- J. Mccord, M. P. Nowak RMHudson, P. A. Mccullough, M. C. Tomlanovich, G. Jacobsen, G. Tokarski, N. Khoury and W. D. Weaver, Ann. Emerg. Med., 2003, 42, 343–350 CrossRef PubMed.
- A. Qureshi, Y. Gurbuz and J. H. Niazi, Sens. Actuators, B, 2012, 171–172, 62–76 CrossRef CAS.
- B. A. Wittenberg and J. B. Wittenberg, Annu. Rev. Physiol., 1989, 51, 857–878 CrossRef CAS PubMed.
- T. Naka, D. Jones, I. Baldwin, N. Fealy, S. Bates, H. Goehl, S. Morgera, H. H. Neumayer and R. Bellomo, Critical Care, 2005, 9, R90–R95 CrossRef PubMed.
- R. H. Christenson and H. M. E. Azzazy, Clin. Biochem., 2009, 42, 150–157 CrossRef PubMed.
- F. T. C. Moreira, R. A. F. Dutra, J. P. C. Noronha and M. G. F. Sales, Electrochim. Acta, 2013, 107, 481–487 CrossRef CAS.
- J. A. Ribeiro, C. M. Pereira, A. F. Silva and S. Mgf, Anal. Chim. Acta, 2017, 981, 41–52 CrossRef CAS PubMed.
- S. M. Taghdisi, N. M. Danesh, M. Ramezani, A. S. Emrani and K. Abnous, Biosens. Bioelectron., 2016, 80, 532–537 CrossRef CAS PubMed.
- O. V. Gnedenko, Y. V. Mezentsev, A. A. Molnar, A. V. Lisitsa, A. S. Ivanov and A. I. Archakov, Anal. Chim. Acta, 2013, 759, 105–109 CrossRef CAS PubMed.
- B. Osman, L. Uzun, N. Besirli and A. Denizli, Mater. Sci. Eng., C, 2013, 33, 3609–3614 CrossRef CAS PubMed.
- Q. Wang, X. Yang, X. Yang, F. Liu and K. Wang, Sens. Actuators, B, 2015, 212, 440–445 CrossRef CAS.
- X. Zhang, X. Kong, W. Fan and X. Du, Langmuir, 2011, 27, 6504–6510 CrossRef CAS PubMed.
- W. A. El-Said, D. M. Fouad and S. A. El-Safty, Sens. Actuators, B, 2016, 228, 401–409 CrossRef CAS.
- I. Lee, X. Luo, X. T. Cui and M. Yun, Biosens. Bioelectron., 2011, 26, 3297–3302 CrossRef CAS PubMed.
- V. V. Shumyantseva, T. V. Bulko, L. V. Sigolaeva, A. V. Kuzikov, M. A. Shatskaya and A. I. Archakov, Dokl. Biochem. Biophys., 2015, 464, 275 CrossRef CAS PubMed.
- F. Darain, P. Yager, K. L. Gan and S. C. Tjin, Biosens. Bioelectron., 2009, 24, 1744–1750 CrossRef CAS PubMed.
- Y. Shen, S. Liu, J. Yang, L. Wang, X. Tan and Y. He, Sens. Actuators, B, 2014, 199, 389–397 CrossRef CAS.
- J. F. Fong, S. F. Chin and S. M. Ng, Biosens. Bioelectron., 2016, 85, 844–852 CrossRef CAS PubMed.
- H. Miao, L. Wang, Y. Zhuo, Z. Zhou and X. Yang, Biosens. Bioelectron., 2016, 86, 83–89 CrossRef CAS PubMed.
- J. Jun, J. S. Lee, H. S. Dong and J. Jang, ACS Appl. Mater. Interfaces, 2014, 6, 13859–13865 CrossRef CAS PubMed.
- K. Sefah, J. A. Phillips, X. Xiong, L. Meng, S. D. Van, H. Chen, J. Martin and W. Tan, Analyst, 2009, 134, 1765–1775 RSC.
- Q. Wang, W. Liu, Y. Xing, X. Yang, K. Wang, R. Jiang, P. Wang and Q. Zhao, Anal. Chem., 2014, 86, 6572 CrossRef CAS PubMed.
- M. Blind and M. Blank, Mol. Ther.--Nucleic Acids, 2015, 4, e223 CrossRef PubMed.
- Z. Ghasemi, R. Dinarvand, F. Mottaghitalab, M. Esfandyarimanesh, E. Sayari and F. Atyabi, Carbohydr. Polym., 2015, 121, 190–198 CrossRef CAS PubMed.
- M. Zhang, S. M. Guo, Y. R. Li, P. Zuo and B. C. Ye, Chem. Commun., 2012, 48, 5488–5490 RSC.
- X. Cui, L. Zhu, J. Wu, Y. Hou, P. Wang, Z. Wang and M. Yang, Biosens. Bioelectron., 2015, 63, 506–512 CrossRef CAS PubMed.
- C. Yu, X. Li, F. Zeng, F. Zheng and S. Wu, Chem. Commun., 2012, 49, 403–405 RSC.
- Q. Y. Cai, J. Li, J. Ge, L. Zhang, Y. L. Hu, Z. H. Li and L. B. Qu, Biosens. Bioelectron., 2015, 72, 31–36 CrossRef CAS PubMed.
- J. Kudr, L. Richtera, K. Xhaxhiu, D. Hynek, Z. Heger, O. Zitka and V. Adam, Biosens. Bioelectron., 2017, 92, 133–139 CrossRef CAS PubMed.
- J. Jana, T. Aditya, M. Ganguly and T. Pal, Sens. Actuators, B, 2017, 188, 551–560 Search PubMed.
- P. Zhang, H. Liu, S. Ma, S. Men, Q. Li, X. Yang, H. Wang and A. Zhang, Biosens. Bioelectron., 2016, 80, 538–542 CrossRef CAS PubMed.
- C. H. Guo, R. Wang, J. Jing, F. Ji, G. Z. Feng, L. Nian Bing and L. H. Qun, Biosens. Bioelectron., 2016, 77, 40–45 CrossRef PubMed.
- J. Sun, W. Jiang, J. Zhu, W. Li and L. Wang, Biosens. Bioelectron., 2015, 70, 15–20 CrossRef CAS PubMed.
- C. Y. Lee, K. S. Park, Y. K. Jung and H. G. Park, Biosens. Bioelectron., 2017, 93, 293–297 CrossRef CAS PubMed.
- E. Nevo, K. Kishi and A. Beiles, Biochem. Genet., 1990, 28, 561–570 CrossRef CAS PubMed.
- V. F. Martínez, E. Balada, J. Ordi-Ros and M. Vilardell-Tarres, Autoimmun. Rev., 2008, 7, 359–363 CrossRef PubMed.
- X. Zhang, X. Fu, Y. Zhang, Y. Zhu and J. Yang, Catal. Lett., 2016, 146, 1–6 CrossRef CAS.
- M. Hai, M. Zheng, L. Yang, P. Keming, Y. Hang, W. Fang and K. Zhenhui, Dalton Trans., 2012, 41, 9526–9531 RSC.
- B. Feng, L. Guo, L. Wang, F. Li, J. Lu, J. Gao, C. Fan and Q. Huang, Anal. Chem., 2013, 85, 7732–7737 CrossRef CAS PubMed.
- Z. Min, Y. Bin-Cheng, W. Xian-Fei and Y. Bang-Ce, Chem. Commun., 2011, 47, 2399–2401 RSC.
Footnote |
| † Electronic supplementary information (ESI) available. See DOI: 10.1039/c8ra09459d |
| This journal is © The Royal Society of Chemistry 2019 |

