 Open Access Article
Modulation of energy metabolism and mitochondrial biogenesis by a novel proteoglycan from Ganoderma lucidum
Zhou Yanga,
Zeng Zhangb,
Juan Zhaoa,
Yanming Heb,
Hongjie Yang*b and
Ping Zhou *a
*a
aState Key Laboratory of Molecular Engineering of Polymers, Department of Macromolecular Science, Fudan University, Shanghai 200433, P. R. China. E-mail: pingzhou@fudan.edu.cn; Fax: (+86)-21-31244038; Tel: (+86)-21-31244038
bYueyang Hospital of Integrated Traditional Chinese and Western Medicine, Shanghai University of Traditional Chinese Medicine, Shanghai 200437, P. R. China. E-mail: yanghongjie1964@aliyun.com
First published on 18th January 2019
Abstract
In this study we first focused on the effects of a novel proteoglycan extracted from Ganoderma lucidum (FYGL) on mitochondrial biogenesis, because mitochondrial dysfunction is highly related to insulin resistance. We found that FYGL can decrease ROS levels and increase ATP content in rat skeletal muscle L6 cells. In PGC-1α silent cells, FYGL increased expression of PGC-1α and positively modulated the Sirt1/PGC-1α pathway. Moreover, FYGL orally administered up-regulated the mitochondrial DNA (mtDNA) copy number and the related gene expressions that control mitochondrial biogenesis in ob/ob mice. Our work well elucidated the mechanism of FYGL ameliorating insulin resistance in the aspect of energy metabolism.
1 Introduction
The mitochondrion is an important intracellular organelle and mediates a series of biochemical reactions from energy production to apoptosis.1 Mitochondria control the oxidative respiratory chain and produce reactive oxygen species (ROS), whereas excessive ROS will impair mitochondrial DNA (mtDNA) and cause intracellular reaction dysfunction.1 It is notable that mitochondria play an important role in controlling type 2 diabetes mellitus (T2DM) by regulating the energy balance. It has been a hot topic recently to reveal the relationship between mitochondrial function and insulin resistance.2,3 Insulin resistance in T2DM usually accompanies mitochondrial dysfunction including reduction of oxidative phosphorylation activity.4 In turn, mitochondrial dysfunction also promotes insulin resistance and produces more ROS.4 ROS induces inactivation of insulin signaling pathway, and is considered as one of the major factors in the development of T2DM.5 In addition, mitochondrial density and volume are decreased in T2DM patients, which are associated with down-regulation of the peroxisome proliferator-activated receptor-γ coactivator-1α (PGC-1α) expression and the adenosine-triphosphate (ATP) content.6–9Mitochondrial biogenesis is highly correlated with PGC-1α, which is praised as the master regulator of mitochondrial biogenesis and energy expenditure.10 Dysfunction in mitochondrial energy metabolism decreases ATP production and generates more ROS, while intracellular PGC-1α can detoxify ROS via mediating ROS detoxifying enzymes.11 As one of the mammalian homology of yeast silent information regulator 2 (Sir2), sirtuin 1 (Sirt1) can mediate energy metabolism, and has been an attractive drug target in recent years.10 Sirt1 is an upstream effector of PGC-1α and activates PGC-1α through deacetylation. It is reported that activation of Sirt1 will ameliorate insulin resistance in mammalian peripheral tissues,12 and overexpression of Sirt1 in skeletal muscle tissues can reduce ROS and improve insulin sensitivity.13
Our previous work reported that a novel protein tyrosine phosphate 1B (PTP1B) inhibitor extracted from Ganoderma lucidum, named FYGL, can regulate insulin signaling pathway and promote the activation of adenosine 5′-monophosphate activated protein kinase (AMPK) in skeletal muscle tissues of ob/ob mice.14,15 Therefore, we first focused on mitochondrial biogenesis regulated by FYGL in the present study. We found that FYGL recovered the mtDNA copy number to normal level in skeletal muscle tissues of ob/ob mice, and positively mediated Sirt1/PGC-1α pathway and ameliorated mitochondrial dysfunction caused by insulin resistance via decreasing ROS level, and increasing ATP production in L6 cells. Our work revealed that FYGL ameliorated insulin resistance through positive modulation of mitochondrial biogenesis from the point of energy metabolism in vivo.
2 Materials and methods
2.1 Materials
FYGL was extracted from Ganoderma lucidum in our laboratory.14 Dulbecco's modified Eagle's medium (DMEM), fetal bovine serum (FBS) were purchased from Gibco Co. Ltd. (USA). 2′,7′-Dichlorodihydrofluorescein diacetate (DCFH-DA) and genomic DNA kit were purchased from Sigma Co. Ltd. (Shanghai, China). BCA (bicinchoninic acid) kit, PBS, penicillin and streptomycin were acquired from Sangon Co. Ltd. (Shanghai, China). 2.5% glutaraldehyde, trizol and SYBR Green I were provided by Yeasen Co. Ltd. (Shanghai, China). RIPA lysis buffer and ATP assay kit were bought from Beyotime Co. Ltd. (Shanghai, China). L6 cells were provided by JRDUN Co. Ltd. (Shanghai, China).2.2 Animal trial
All animal procedures were performed in accordance with the Guidelines for Care and Use of Laboratory Animals of Fudan University and approved by the Animal Ethics Committee of Medical College. 10 male eight-week-old wild type (WT) C57BL/6J mice and 50 male eight-week-old obese C57BL/6J (ob/ob) mice were obtained from Chinese Academy of Sciences Shanghai Institute of Materia Medica. All mice were housed at 22 ± 2 °C and 45–75% relative humidity with a 12 h light/dark cycle. 50 ob/ob mice were randomly divided into 5 groups with 10 mice in each group, model, given FYGL (150, 300, 400 mg kg−1) and metformin (250 mg kg−1) once a day, respectively. All mice were killed and the skeletal muscle tissues were isolated after 4 weeks.2.3 mtDNA content assay
Rat skeletal muscle L6 cell lines were cultured in DMEM with 10% FBS and 1% penicillin–streptomycin at 37 °C in 5% CO2 atmosphere. Genomic DNA was extracted from skeletal muscle tissues and L6 cells using genomic DNA kit. mtDNA was proliferated by quantitative PCR with the primer (the sequence was shown in Table 1) and the copy number was calculated.| Gene | Forward primer (5′ to 3′) | Reverse primer (5′ to 3′) |
|---|---|---|
| Rat β-actin | CCCATCTATGAGGGTTACGC | TTTAATGTCACGCACGATTTC |
| Rat PGC-1α | CGCACAACTCAGCAAGTCCTC | CCTTGCTGGCCTCCAAAGTCTC |
| Rat Sirt1 | CAGCATCTTGCCTGATTTGTAA | TTGGAATTAGTGCTACTGGTCTTAC |
| Rat Sirt3 | TCTACAGCAACCTTCAGCAGTATG | AAGGAAGTAGTGAGCGACATTGG |
| Rat mtDNA | AGCTATTAATGGTTCGTTTGT | AGGAGGCTCCATTTCTCTTGT |
| Rat NRF1 | AGAGACAGCAGACACGGTTG | GCTGCGCCAAACACCTTAAA |
| Rat TFAM | AGCAAATGGCTGAAGTTGGG | TCTAGTAAAGCCCGGAAGGT |
| Mouse β-actin | GGCTGTATTCCCCTCCATCG | CCAGTTGGTAACAATGCCATGT |
| Mouse mtDNA | TAAATTTCGTGCCAGCCACC | GTTGACACGTTTTACGCCGA |
| Mouse PGC-1α | ATCTGACCACAAACGATGACCCT | GAGGCATCTTTGAAGTCTAGTTGTCTA |
| Mouse Sirt1 | GCTGACGACTTCGACGACG | TCGGTCAACAGGAGGTTGTCT |
| Mouse Sirt3 | TACAGGCCCAATGTCACTCA | GGATCCCAGATGCTCTCTCA |
| Mouse TFAM | ATTCCGAAGTGTTTTTCCAGCA | TCTGAAAGTTTTGCATCTGGGT |
| Mouse NRF1 | CGGAAACGGCCTCATGTGT | CGCGTCGTGTACTCATCCAA |
2.4 RNA extraction and quantitative PCR (qPCR)
RNA was extracted from skeletal muscle tissues and L6 cells by using trizol agent, and then reversely transcribed to complementary DNA (cDNA). SYBR Green I including Taq enzyme and series of primers β-actin (as internal reference), Sirt1, sirtuin 3 (Sirt3), PGC-1α, mitochondrial transcription factor A (TFAM) and nuclear respiratory factor-1 (NRF1) (all synthesized by Sangon Co, and their sequences are shown in Table 1) were mixed with cDNA, proliferated on qPCR instrument (Bio-rad, Germany). The relative expression mRNA was determined according to the method in the ref. 16.2.5 Protein extraction and western blot
Skeletal muscle tissues and L6 cells were lysed in RIPA lysis buffer and centrifuged (12![[thin space (1/6-em)]](https://www.rsc.org/images/entities/char_2009.gif) 000 × g, 10 min, 4 °C). The lysates were separated by 10% SDS-PAGE and transferred to polyvinylidene fluoride membrane, immunoblotted with following primary antibodies of rabbit monoclonal anti-Sirt1, anti-Sirt3, anti-PGC-1α (BBI, Shanghai, China), anti-TFAM, anti-NRF1 and anti-GAPDH (ABCAM, Cambridge, UK), and then incubated with secondary goat anti-rabbit antibody (Cell Signaling, USA). The bands were visualized with enhanced chemiluminescence solution (ECL, Biotanon) and detected by Image Lab camera (Bio-rad, Germany), and then quantified by densitometry scanning with ImageJ software.
000 × g, 10 min, 4 °C). The lysates were separated by 10% SDS-PAGE and transferred to polyvinylidene fluoride membrane, immunoblotted with following primary antibodies of rabbit monoclonal anti-Sirt1, anti-Sirt3, anti-PGC-1α (BBI, Shanghai, China), anti-TFAM, anti-NRF1 and anti-GAPDH (ABCAM, Cambridge, UK), and then incubated with secondary goat anti-rabbit antibody (Cell Signaling, USA). The bands were visualized with enhanced chemiluminescence solution (ECL, Biotanon) and detected by Image Lab camera (Bio-rad, Germany), and then quantified by densitometry scanning with ImageJ software.
2.6 ROS level assay
Briefly, L6 cells were incubated with FYGL for 24 h, then 10 μmol L−1 DCFH-DA diluted in DMEM with 2% FBS (1![[thin space (1/6-em)]](https://www.rsc.org/images/entities/char_2009.gif) :
:![[thin space (1/6-em)]](https://www.rsc.org/images/entities/char_2009.gif) 1000) was added. After incubation for 20 min, DCFH-DA was removed and the cells were washed with PBS three times, and then ROS level was analyzed by flow cytometry (Gallios, Beckman coulter, USA).
1000) was added. After incubation for 20 min, DCFH-DA was removed and the cells were washed with PBS three times, and then ROS level was analyzed by flow cytometry (Gallios, Beckman coulter, USA).
2.7 Intracellular ATP content assay
L6 cells were seeded into 6-well plates, and FYGL at designated concentrations was added and incubated for 24 h. Then the cells were washed with cold PBS three times, and lysed by ATP lysis, and then centrifuged to collect supernatant. The emitted light was assayed by microplate luminometer (Bio-Tek, USA) and ATP content was calibrated by protein concentration finally.2.8 Transfection with PGC-1α siRNA
L6 cells were seeded into 6-well plates. 20 μmol L−1 PGC-1α siRNA (synthesized by Sangon Bio. Co, the sequence was shown in Table 2) and 5 μL Lipofectamine 6000 were premixed in opti-MEM to be added into the wells. After the cells were incubated 6 h, opti-MEM was removed. Then FYGL at designated concentrations was added and incubated for another 24 h. Finally, RNA and protein were extracted for qPCR and western blot analysis, respectively. Meanwhile ROS and ATP levels were also measured, respectively.| Sense (5′ to 3′) | AAGACGGAUUGCCCUCAUUUGtt |
| Anti-sense (5′ to 3′) | CAAAUGAGGGCAAUCCGUCUUtt |
2.9 Statistical analysis
All data are presented as mean ± SD. Multi-group comparisons of the means were carried out by one-way analysis of variance (ANOVA) test with post hoc contrasts by Student–Newman–Keuls test. A difference is considered statistically to be significant when the P value < 0.05.3 Results
3.1 FYGL increases mtDNA copy number in skeletal muscle tissues of mice
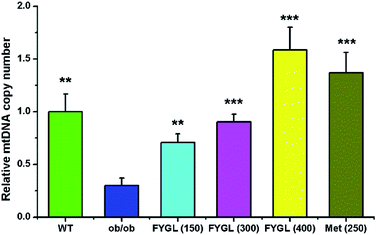
Fig. 1 shows the relative mtDNA copy number in skeletal muscle tissues of mice treated with saline, FYGL and metformin, respectively. The mtDNA level in skeletal muscle tissues of ob/ob mice was remarkably lower than that of WT mice. However, FYGL orally administrated significantly up-regulated mtDNA content, similar to metformin. Interestingly, it was almost 1.5 times of mtDNA copy number in ob/ob mice treated with 400 mg kg−1 FYGL as much as that in WT group, demonstrating that FYGL can promote mitochondrial biogenesis. Therefore, it is interesting for us to investigate the related pathway which is possibly influenced by FYGL.3.2 FYGL regulates mitochondrial signaling pathway
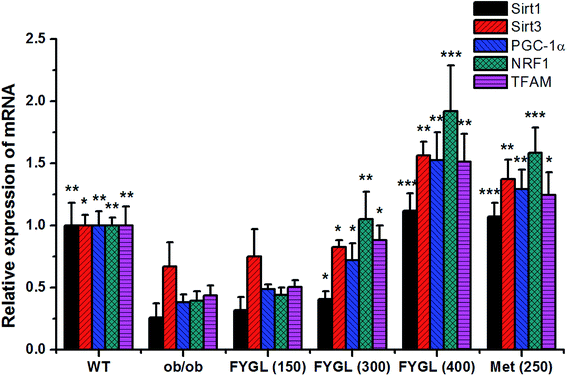
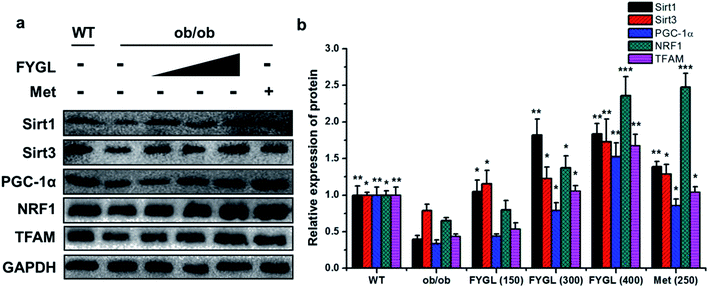
Fig. 2 shows the relative expressions of mRNAs related to mitochondrial signaling pathway in skeletal muscle tissues of mice. All the expressions of mRNAs including Sirt1, Sirt3, PGC-1α, NRF1 and TFAM were notably decreased in ob/ob mice, compared with that in WT group. However, the expressions of mRNAs were increased in ob/ob mice after treated with 150 mg kg−1 FYGL, and significantly up-regulated when dose of FYGL was higher than 300 mg kg−1.From the analysis data of western blot in Fig. 3, the proteins related to mitochondrial biogenesis including Sirt1, Sirt3, PGC-1α, NRF1 and TFAM were all down-regulated in ob/ob mice, compared with that in WT group, and both the expressions of Sirt1 and Sirt3 were markedly up-regulated in ob/ob mice treated with 150 mg kg−1 FYGL. Interestingly, all the proteins depicted in Fig. 3b exhibited significant increase when ob/ob mice took FYGL more than 300 mg kg−1. The results of western blot were consistent with those of qPCR.
3.3 FYGL decreases ROS level and increases ATP content in L6 cells
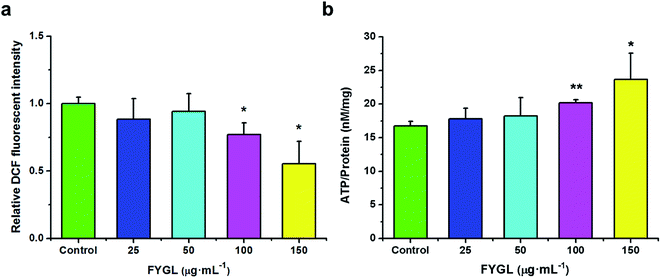
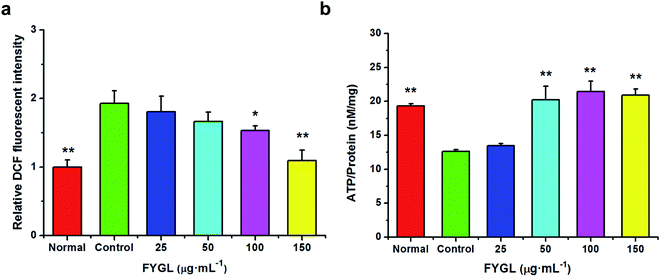
For clearly understanding the effect of FYGL on mitochondrial biogenesis, we investigated ROS level and ATP content in L6 cells. From Fig. 4a, fluorescent intensity of DCF represents the relative ROS level, and that of control group is normalized to 1.0. FYGL significantly decreased ROS level in L6 cells when its concentration was higher than 100 μg mL−1. Furthermore, from Fig. 4b, ATP content was increased in L6 cells after incubated with FYGL. Interestingly, ATP level was significantly increased when concentration of FYGL was higher than 100 μg mL−1, which was similar to the result of ROS level in L6 cells incubated with FYGL.In Fig. 5a, it was almost two times of ROS level in PGC-1α silent cells as high as that in normal cells, but decreased mildly after incubated with relative low concentration of FYGL. When FYGL concentration was higher than 100 μg mL−1, ROS level was significantly ameliorated. From Fig. 5b, ATP content was markedly decreased in PGC-1α silent cells compared with normal group, reflecting that the mitochondrial biogenesis was weakened when the expression of PGC-1α was declined. After the PGC-1α silent cells were incubated with FYGL especially when the concentration was higher than 50 μg mL−1, intracellular ATP content was significantly enhanced.
3.4 FYGL increases PGC-1α in L6 cells at the mRNA and protein levels
Table 3 shows the relative expressions of mRNAs and mtDNA in L6 cells transfected with PGC-1α siRNA and incubated with FYGL at different concentrations. After L6 cells were transfected with PGC-1α siRNA, the mRNA expression of PGC-1α was decreased instantly, accompanied with Sirt1, Sirt3, NRF1, TFAM mRNA and mtDNA copy number. Incubation with FYGL gradually enhanced PGC-1α mRNA expression in PGC-1α silent cells, and increased Sirt1 and Sirt3 mRNA expressions when the concentration of FYGL was higher than 50 μg mL−1, along with effectively improved NRF1 and TFAM mRNA expressions. In accordance with TFAM mRNA, mtDNA copy number in L6 cells was also significantly increased after incubated with FYGL.| a Data are presented as mean ± SD (n = 3). *P < 0.05, **P < 0.01, ***P < 0.001 versus with control group. | ||||||
|---|---|---|---|---|---|---|
| PGC-1α siRNA | − | + | + | + | + | + |
| FYGL (μg mL−1) | Normal | Control | 25 | 50 | 100 | 150 |
| Relative expression of Sirt1 mRNA | 1.0 ± 0.1** | 0.382 ± 0.003 | 0.46 ± 0.03 | 0.495 ± 0.005* | 0.81 ± 0.06* | 1.29 ± 0.09** |
| Sirt3 mRNA | 1.0 ± 0.2** | 0.23 ± 0.04 | 0.21 ± 0.05 | 0.56 ± 0.08* | 1.05 ± 0.08** | 1.4 ± 0.1*** |
| PGC-1α mRNA | 1.00 ± 0.05*** | 0.19 ± 0.02 | 1.8 ± 0.1*** | 6 ± 1*** | 15 ± 2*** | 22 ± 2*** |
| NRF1 mRNA | 1.0 ± 0.2* | 0.49 ± 0.07 | 1.8 ± 0.3*** | 3.02 ± 0.09*** | 5.5 ± 0.6*** | 21 ± 1*** |
| TFAM mRNA | 1.00 ± 0.07* | 0.56 ± 0.06 | 2.5 ± 0.3*** | 10 ± 1*** | 29 ± 1*** | 38 ± 1*** |
| mtDNA | 1.00 ± 0.06*** | 0.080 ± 0.005 | 0.29 ± 0.05 * | 1.3 ± 0.2*** | 2.3 ± 0.6*** | 2.1 ± 0.2*** |
As shown in Fig. 6, the expression of PGC-1α was significantly decreased in PGC-1α silent cells, followed with reductions of Sirt1, Sirt3, NRF1 and TFAM. Compared with control group, treatment with FYGL markedly increased PGC-1α, Sirt1, Sirt3, NRF1 and TFAM, especially when the concentration of FYGL was higher than 50 μg mL−1, coinciding with the results of qPCR.
4 Discussion and conclusions
4.1 The mechanism of FYGL decreasing ROS and increasing ATP
In recent decades, ROS has been identified to be a major factor in the development of T2DM by inactivating signaling pathway from insulin receptor to glucose transporter, and overproduction of ROS may induce apoptosis of islet β cells.7 FYGL was demonstrated to be a neutral hyperbranched proteoglycan consisting of 4 saccharides and 17 amino acids,17 the reductive sugars of FYGL including glucose and galactose might play an important role in ameliorating ROS level.5 Our previous work also found that FYGL can protect rat insulinoma cells (an islet β cell mode) against impairment from the fibrillation of human islet amyloid polypeptide (hIAPP),18 which suggested FYGL protected islet β cells possibly through ameliorating intracellular overproduction of ROS induced by misfolding of hIAPP.19Overexpression of PGC-1α can enhance intracellular ATP content, while deficiency of PGC-1α often causes decrease of ATP in cardiomyocytes via adiponectin/AMPK/PGC-1α pathway.20 Liu et al.21 reported that lead acetate can also increase ROS and decrease ATP in TM4 cells, accompanying with down-regulation of PGC-1α and Sirt3 mRNA. In our previous work, FYGL was demonstrated to enhance adiponectin and promote phosphorylation of AMPKα in vivo.22 In the current study, FYGL can increase ATP content in addition to decrease of ROS level in PGC-1α deficient cells, regulating mitochondrial biogenesis through PGC-1α related pathway.
4.2 Mitochondrial biogenesis regulated by FYGL
Mitochondrial dysfunction is a complication of high serum lipid-induced ROS in skeletal muscle tissues, in turn promotes ROS and mitochondrial alteration.23 High serum lipid induces the reduction of mitochondrial density in insulin resistant skeletal muscle.24 In addition, mitochondrial dysfunction can also exacerbate T2DM by inhibiting insulin action,23 and the toxic by-product from ROS will induce cell apoptosis and inhibit signaling transduction.25 In our previous work, FYGL can down-regulate serum lipid level, thus protecting peripheral tissues against damage from ROS.22 Moreover, mtDNA is also quite sensitive to ROS level and can be impaired by overload of ROS.25,26 Ikeda et al. reported that overexpression of TFAM can increase mtDNA copy number and limit mitochondrial oxidative stress.27 In this work the mtDNA copy number in skeletal muscle tissues of ob/ob mice was significantly lower than that of WT group, whereas treatment with FYGL remarkably up-regulated mtDNA copy number and improved the expression of TFAM in ob/ob mice, indicating that FYGL can also improve the mitochondrial biogenesis.4.3 Influence of PGC-1α by FYGL
Overexpression of PGC-1α can promote lipid metabolism and mitochondrial biogenesis,3 and increase insulin sensitivity in skeletal muscle tissues.28 It was reported that aldosterone decreases mtDNA copy number and ATP content, while PGC-1α overexpression can protect mitochondria against aldosterone-induced podocyte depletion.11 Knockdown of PGC-1α leads a series of mitochondrial alterations including aggravation of oxidative stress and fatty acid oxidation,29 even exacerbates insulin resistance.30 Wan et al.31 reported that PGC-1α is regulated by activation of AMPK. In this work, the expression of PGC-1α was significantly decreased in skeletal muscle tissues of ob/ob mice along with reduction of mtDNA copy number, while FYGL remarkably increased expression of PGC-1α and activated it major upstream regulator, AMPK, in vivo and in vitro.154.4 Influence of energy metabolism pathway by FYGL
Energy demand activates intracellular AMPK, and then increases the ratio of NAD+/NADH, finally activated Sirt1/PGC-1α cascades.2 Sirt1/PGC-1α is a crucial metabolic adaptation which can integrate muscle cells in response to low nutrient, and Sirt1 can promote the utilization of mitochondrial fatty acid and the transcription of related gene factors.32 Sirt1 overexpression can improve insulin sensitivity and ameliorate ROS and insulin resistance in high-fat diet rats.13 In addition, PGC-1α stimulates Sirt3, and Sirt3 in turn regulates PGC-1α through phosphorylation of cAMP-response element binding protein (CREB).33 Knockdown of Sirt3 significantly suppresses PGC-1α and expressions of other mitochondrial related genes, meanwhile decreases mitochondrial copy number and increases ROS level.33 PGC-1α can bind and co-activate NRF1, and increase transcriptional activity on target gene including TFAM.34 Kang et al.35 reported that aspartate raised ATP content in liver through AMPK-Sirt1-PGC-1 signal pathway. Intriguingly, FYGL promoted phosphorylation of AMPK in skeletal muscle tissues of ob/ob mice,15 and also increased ATP content in L6 cells through activating Sirt1/PGC-1α cascades. Although the mitochondrial related gene expressions were all down-regulated in skeletal muscle tissues of ob/ob mice, FYGL orally administrated significantly up-regulated Sirt1/TFAM cascades at the mRNA level and protein level. STR1720, a Sirt1 specific activator reported by Feige et al.36 can ameliorate insulin resistance in muscle, liver and brown adipose tissues, but its function is different from FYGL.4.5 Conclusions
In summary, our work investigated the effects of FYGL on mitochondrial biogenesis on the basis of the evidence that FYGL can regulate blood glucose and ameliorate insulin resistance in ob/ob mice. We found that FYGL ameliorated cellular damage from ROS and promoted ATP synthesis in L6 cells, along with enhancement of PGC-1α expression. Moreover, FYGL can also increase mtDNA copy number and expressions of mitochondrial related genes in vivo, thus protecting mitochondria against impairment from insulin resistance, in turn ameliorating insulin resistance.Author contributions
Zhou Yang and Juan Zhao performed the experiments and analyzed the data. Zhou Yang and Ping Zhou designed all the experiments. Zhou Yang, Hongjie Yang and Ping Zhou wrote the manuscript.Conflicts of interest
The authors claim that the researchers in this study have no conflict of interest.Abbreviations
| AMP | Adenosine 5′-monophosphate |
| AMPK | Adenosine 5′-monophosphate activated protein kinase |
| ATP | Adenosine-triphosphate |
| CREB | cAMP-response element binding protein |
| DCFH-DA | 2′,7′-Dichlorodihydrofluorescein diacetate |
| mtDNA | Mitochondrial DNA |
| NRF1 | Nuclear respiratory factor-1 |
| PGC-1α | Peroxisome proliferator-activated receptor-γ coactivator-1α |
| ROS | Reactive oxygen species |
| Sir2 | Silent information regulator 2 |
| Sirt1 | Sirtuin 1 |
| Sirt3 | Sirtuin 3 |
| T2DM | Type 2 diabetes mellitus |
| TFAM | Mitochondrial transcription factor A |
Acknowledgements
This work was supported by the Natural Science Foundation of China (No. 21374022 and 81374032), the Scientific Program of Shanghai Municipal Public Health Bureau (No. 2008220 and 2010231), the Science and Technology Innovation Action Plan of STCSM (No. 11DZ1971802), National Major Scientific and Technological Special Project for “Significant New Drugs Development” (No. 2017ZX09301006), Shanghai Science and Technology Innovation Action Plan “Science and Technology Support Project in Biomedical Science” (No. 17401902700).References
- M. Picard, T. Taivassalo, G. Gouspillou and R. T. Hepple, J. Photosci., 2011, 589, 4413–4421 CAS.
- D. C. Wallace, Science, 1999, 283, 1482–1488 CrossRef CAS PubMed.
- S. D. Martin and S. L. McGee, Biochim. Biophys. Acta, 2014, 1840, 1303–1312 CrossRef CAS PubMed.
- J. Szendroedi, E. Phielix and M. Roden, Nat. Rev. Endocrinol., 2011, 8, 92–103 CrossRef PubMed.
- P. Newsholme, E. P. Haber, S. M. Hirabara, E. L. Rebelato, J. Procopio, D. Morgan, H. C. Oliveira-Emilio, A. R. Carpinelli and R. Curi, J. Photosci., 2007, 583, 9–24 CAS.
- K. Morino, K. F. Petersen, S. Dufour, D. Befroy, J. Frattini, N. Shatzkes, S. Neschen, M. F. White, S. Bilz, S. Sono, M. Pypaert and G. I. Shulman, J. Clin. Invest., 2005, 115, 3587–3593 CrossRef CAS PubMed.
- D. E. Kelley, J. He, E. V. Menshikova and V. B. Ritov, Diabetes, 2002, 51, 2944–2950 CrossRef CAS PubMed.
- V. K. Mootha, C. M. Lindgren, K. F. Eriksson, A. Subramanian, S. Sihag, J. Lehar, P. Puigserver, E. Carlsson, M. Ridderstrale, E. Laurila, N. Houstis, M. J. Daly, N. Patterson, J. P. Mesirov, T. R. Golub, P. Tamayo, B. Spiegelman, E. S. Lander, J. N. Hirschhorn, D. Altshuler and L. C. Groop, Nat. Genet., 2003, 34, 267–273 CrossRef CAS PubMed.
- K. F. Petersen, D. Befroy, S. Dufour, J. Dziura, C. Ariyan, D. L. Rothman, L. DiPietro, G. W. Cline and G. I. Shulman, Science, 2003, 300, 1140–1142 CrossRef CAS PubMed.
- P. J. Fernandez-Marcos and J. Auwerx, Am. J. Clin. Nutr., 2011, 93, 884S–890S CrossRef CAS PubMed.
- M. Zhao, Y. Yuan, M. Bai, G. Ding, Z. Jia, S. Huang and A. Zhang, Oncotarget, 2016, 7, 12150–12162 Search PubMed.
- B. L. Tang, Mol. Cells, 2016, 39, 87–95 CrossRef CAS PubMed.
- H. H. Zhang, G. J. Qin, X. L. Li, Y. H. Zhang, P. J. Du, P. Y. Zhang, Y. Y. Zhao and J. Wu, J. Physiol. Biochem., 2015, 71, 177–190 CrossRef CAS PubMed.
- B. S. Teng, C. D. Wang, H. J. Yang, J. S. Wu, D. Zhang, M. Zheng, Z. H. Fan, D. Pan and P. Zhou, J. Agric. Food Chem., 2011, 59, 6492–6500 CrossRef CAS PubMed.
- Z. Yang, F. Wu, Y. He, Q. Zhang, Y. Zhang, G. Zhou, H. Yang and P. Zhou, Food Funct., 2018, 9, 397–406 RSC.
- H. A. Erlich, D. H. Gelfand and R. K. Saiki, Nature, 1988, 331, 461–462 CrossRef.
- D. Pan, L. Wang, C. Chen, B. Hu and P. Zhou, Carbohydr. Polym., 2015, 117, 106–114 CrossRef CAS PubMed.
- Q. Sun, J. Zhao, Y. Zhang, H. Yang and P. Zhou, RSC Adv., 2016, 6, 105690–105698 RSC.
- X. L. Li, Y. S. Wong, G. Xu and J. C. Chan, Eur. J. Nutr., 2015, 54, 509–522 CrossRef CAS PubMed.
- W. Yan, H. Zhang, P. Liu, H. Wang, J. Liu, C. Gao, Y. Liu, K. Lian, L. Yang, L. Sun, Y. Guo, L. Zhang, L. Dong, W. B. Lau, E. Gao, F. Gao, L. Xiong, H. Wang, Y. Qu and L. Tao, Basic Res. Cardiol., 2013, 108, 329 CrossRef PubMed.
- X. Liu, J. Ye, L. Wang, Z. Li, Y. Zhang, J. Sun, C. Du, C. Wang and S. Xu, Biol. Trace Elem. Res., 2017, 175, 440–448 CrossRef CAS PubMed.
- Z. Yang, C. Chen, J. Zhao, W. Xu, Y. He, H. Yang and P. Zhou, Eur. J. Pharmacol., 2017, 820, 77–85 CrossRef PubMed.
- S. Di Meo, S. Iossa and P. Venditti, J. Endocrinol., 2017, 233, R15–R42 CAS.
- P. Chomentowski, P. M. Coen, Z. Radikova, B. H. Goodpaster and F. G. Toledo, J. Clin. Endocrinol. Metab., 2011, 96, 494–503 CrossRef CAS PubMed.
- K. Brieger, S. Schiavone, F. J. Miller Jr and K. H. Krause, Swiss Med. Wkly., 2012, 142, w13659 CAS.
- T. Ide, H. Tsutsui, S. Hayashidani, D. C. Kang, N. Suematsu, K. Nakamura, H. Utsumi, N. Hamasaki and A. Takeshita, Circ. Res., 2001, 88, 529–535 CrossRef CAS PubMed.
- M. Ikeda, T. Ide, T. Fujino, S. Arai, K. Saku, T. Kakino, H. Tyynismaa, T. Yamasaki, K. Yamada, D. Kang, A. Suomalainen and K. Sunagawa, PLoS One, 2015, 10, e0119687 CrossRef PubMed.
- C. R. Benton, J. G. Nickerson, J. Lally, X. X. Han, G. P. Holloway, J. F. Glatz, J. J. Luiken, T. E. Graham, J. J. Heikkila and A. Bonen, J. Biol. Chem., 2008, 283, 4228–4240 CrossRef CAS PubMed.
- M. Waldman, L. Bellner, L. Vanella, J. Schragenheim, K. Sodhi, S. P. Singh, D. Lin, A. Lakhkar, J. Li, E. Hochhauser, M. Arad, Z. Darzynkiewicz, A. Kappas and N. G. Abraham, Stem Cells Dev., 2016, 25, 1084–1094 CrossRef CAS PubMed.
- S. Kleiner, R. J. Mepani, D. Laznik, L. Ye, M. J. Jurczak, F. R. Jornayvaz, J. L. Estall, D. Chatterjee Bhowmick, G. I. Shulman and B. M. Spiegelman, Proc. Natl. Acad. Sci. U. S. A., 2012, 109, 9635–9640 CrossRef CAS PubMed.
- Z. Wan, J. Root-Mccaig, L. Castellani, B. E. Kemp, G. R. Steinberg and D. C. Wright, Obesity, 2014, 22, 730–738 CrossRef CAS PubMed.
- Z. Gerhart-Hines, J. T. Rodgers, O. Bare, C. Kim, S. H. Kim, R. Mostoslavsky, F. W. Alt, Z. D. Wu and P. Puigserver, EMBO J., 2007, 26, 1913–1923 CrossRef CAS PubMed.
- X. Kong, R. Wang, Y. Xue, X. Liu, H. Zhang, Y. Chen, F. Fang and Y. Chang, PLoS One, 2010, 5, e11707 CrossRef PubMed.
- Z. Wu, P. Puigserver, U. Andersson, C. Zhang, G. Adelmant, V. Mootha, A. Troy, S. Cinti, B. Lowell, R. C. Scarpulla and B. M. Spiegelman, Cell, 1999, 98, 115–124 CrossRef CAS PubMed.
- P. Kang, Y. Liu, H. Zhu, S. Li, H. Shi, F. Chen, W. Leng, D. Pi, Y. Hou and D. Yi, Eur. J. Nutr., 2015, 54, 581–588 CrossRef CAS PubMed.
- J. N. Feige, M. Lagouge, C. Canto, A. Strehle, S. M. Houten, J. C. Milne, P. D. Lambert, C. Mataki, P. J. Elliott and J. Auwerx, Cell Metab., 2008, 8, 347–358 CrossRef CAS PubMed.
| This journal is © The Royal Society of Chemistry 2019 |

