 Open Access Article
An amorphous MoSx modified g-C3N4 composite for efficient photocatalytic hydrogen evolution under visible light†
Xia Lia,
Bo Wanga,
Xia Shua,
Dongmei Wanga,
Guangqing Xu a,
Xinyi Zhang
 b,
Jun Lv
 *a and
Yucheng Wu
 *ac
*ac
aSchool of Material Sciences and Engineering, Hefei University of Technology, Hefei 230009, China. E-mail: ycwu@hfut.edu.cn; lvjun117@126.com
bGuangxi Key Laboratory for Electrochemical Energy Materials, Guangxi University, Nanning, 530004, China
cAnhui Provincial Key Laboratory of Advanced Functional Materials and Devices, Hefei University of Technology, Hefei 230009, China
First published on 21st May 2019
Abstract
In this work, an MoSx/g-C3N4 composite photocatalyst was successfully fabricated by a sonochemical approach, where amorphous MoSx was synthesized using a hydrothermal method with Na2MoO4·H2O, H4SiO4(W3O9)4 and CH3CSNH2 as precursors, and g-C3N4 nanosheets were produced using a two-step thermal polycondensation method. The hydrogen-evolution performance of the MoSx/g-C3N4 composite was tested under visible light. The results show that the H2-evolution rate of the MoSx/g-C3N4 (7 wt%) photocatalyst reaches a maximum value of 1586 μmol g−1 h−1, which is about 70 times that of pure g-C3N4 nanosheets. The main reason is that amorphous MoSx forms intimate heterojunctions with g-C3N4 nanosheets, and the introduction of MoSx into g-C3N4 nanosheets not only enhances the ability to convert H+ into H2, but also promotes the separation of photoinduced electron–hole pairs for the photocatalyst. BET analysis shows that the specific surface area and pore volume of g-C3N4 are decreased in the presence of MoSx. XPS analysis manifests that MoSx provides a number of active sites. Mott–Schottky plots show that the conduction band of MoSx (−0.18 V vs. EAg/AgCl, pH = 7) is more negative than that of g-C3N4 nanosheets.
1. Introduction
With the intensification of the energy crisis and environmental pollution, the human need for green and renewable energy has become more urgent. Recently, research into and applications of solar energy have attracted great attention.1,2 There is little doubt that once solar energy is fully utilized, mankind can solve the energy crisis and alleviate environmental pollution. Hydrogen, a clean fuel with its combustion product being environmentally friendly water, is a suitable substitute for petroleum fuels.3 Furthermore, hydrogen can be obtained by water splitting in large quantities, so how to utilize solar energy to produce hydrogen by water splitting has become one of the key issues in achieving sustainable development.4 In recent years, the hydrogen evolution reaction (HER) by semiconductors has increasingly become the focus of research. Scientists have conducted extensive and in-depth studies on solar-driven water splitting to obtain hydrogen using semiconductors such as TiO2,5 CdS,6,7 and graphene.8 However, these materials have many different drawbacks, including the narrow range of response to visible light, environmental hazards and poor stability, which severely restrict their practical applications. For these reasons, the development of novel visible light responsive photocatalysts with high efficiency and good stability has become an important research direction.Graphitic carbon nitride (g-C3N4), a non-metallic semiconductor with a two-dimensional structure like graphene, has received great attention in the field of photocatalysis, due to its earth-abundance, high physicochemical stability, suitable band structure (Eg = 2.7 eV) and low cost.9,10 Since it was first reported as a metal-free semiconductor photocatalyst for H2 production in 2009,11 g-C3N4 has become a potential novel photocatalytic material for hydrogen production. Nevertheless, the photocatalytic performance of g-C3N4 is typically limited due to its high recombination of photoexcited electron–hole pairs, small surface area and low quantum efficiency.12,13 Different methods have been used to improve its photocatalytic properties by nanostructure modulation,14–16 ion doping,17,18 loading with co-catalysts,19 as well as compounding with other semiconductors.20
Molybdenum sulfide is a layered transition-metal dichalcogenide, which has been considered a promising candidate to replace Pt as a co-catalyst for HER. Molybdenum sulfide has superior properties, such as low cost, relative abundance, tunable band structure and absorption of visible light. Crystalline MoS2 has been reported to be an excellent catalyst for both photocatalytic and electrocatalytic HER due to the existence of active sites derived from the sulfur edges of MoS2 crystal layers.21,22 Reports have always focused on MoS2 as a co-catalyst to enhance the photocatalytic activity of HER under visible light: for example, MoS2/C3N4,23,24 MoS2/CdS,25 MoS2/graphene26 and MoS2/TiO2.27 Crystalline MoS2 has two distinct phases: the 2H-phase and the 1T-phase. 2H-MoS2 exists in the natural environment and is more stable than 1T-MoS2, but its poor electrical conductivity limits its performance for HER. Whereas 1T-MoS2 has high electron transfer capability and has been a vital research object.28 In addition, amorphous molybdenum sulfide (MoSx) has also been found to be highly active for HER because of its ample unsaturated atoms.29 In fact, amorphous MoSx has recently been demonstrated to be an excellent co-catalyst because of its active centers for HER. Huogen Yu and colleagues declared that an amorphous molybdenum sulfide modified g-C3N4 composite exhibits an obviously higher hydrogen-evolution activity than that of a crystalline molybdenum sulfide modified g-C3N4 composite.30 More recently, Xiao Hai and colleagues further demonstrated that the co-catalytic performance of monolayer MoS2 could be gradually enhanced by reducing its crystallinity, and a poorly crystalline MoS2 monolayer shows even higher co-catalytic performance than that of Pt.31
Herein, a novel kind of MoSx/g-C3N4 composite has been prepared by a sonochemical approach. The g-C3N4 nanosheets were synthesized by a thermal polycondensation method. The amorphous MoSx was synthesized by a hydrothermal method. The photocatalytic HER of MoSx/g-C3N4 was investigated and the mechanism of MoSx/g-C3N4 in improving the photocatalytic activity is discussed in detail. This work supplies a novel strategy for using amorphous MoSx as a co-catalyst to enhance the photocatalytic HER of g-C3N4 under visible light.
2. Experimental
2.1 Preparation
![[thin space (1/6-em)]](https://www.rsc.org/images/entities/char_2009.gif) 000 rpm and dried at 60 °C for 12 h and was named UCN.
000 rpm and dried at 60 °C for 12 h and was named UCN.![[thin space (1/6-em)]](https://www.rsc.org/images/entities/char_2009.gif) 000 rpm and the obtained precipitates were washed with deionized water and ethanol several times. The product was dried in a vacuum at 60 °C for 8 h and milled into powder, and denoted as primitive MoSx. 50 mg of the primitive MoSx was dispersed in 80 mL of deionized water at room temperature and exfoliated by ultrasonication for 2 h. The final product was centrifuged at 12
000 rpm and the obtained precipitates were washed with deionized water and ethanol several times. The product was dried in a vacuum at 60 °C for 8 h and milled into powder, and denoted as primitive MoSx. 50 mg of the primitive MoSx was dispersed in 80 mL of deionized water at room temperature and exfoliated by ultrasonication for 2 h. The final product was centrifuged at 12![[thin space (1/6-em)]](https://www.rsc.org/images/entities/char_2009.gif) 000 rpm, dried at 60 °C for 12 h and named MoSx. Crystalline MoS2 was obtained by heating the primitive MoSx at 360 °C in ambient N2 for 2 h.
000 rpm, dried at 60 °C for 12 h and named MoSx. Crystalline MoS2 was obtained by heating the primitive MoSx at 360 °C in ambient N2 for 2 h.2.2 Characterization
The power X-ray diffraction (XRD) patterns of the samples were recorded by a Rigaku D/MAX2500V X-ray diffractometer (Cu Kα1 irradiation, λ = 0.15406 Å). Transmission electron microscopy (TEM) was performed with an electron microscope (JEM-2100F, Japan) operating at 200 kV. The BET specific surface and pore volume of the samples were determined by a surface area and pore size analyzer (Quadrasorb evo, USA). X-ray photoelectron spectroscopy (XPS) analysis of the samples was performed using an ESCALAB250Xi photoelectron spectrometer (Thermo) with monochromatic Al Kα (1486.60 eV). The UV-vis spectra of the samples were measured on a UV-vis spectrophotometer (UV-3600, Shimadzu Corp, Japan). The photoluminescence (PL) spectra of the samples were measured using a fluorescence spectrophotometer (F-4500) with an excitation wavelength of 315 nm.2.3 Photocatalytic hydrogen production
Photocatalytic H2 production experiments were performed in a 300 mL sealed quartz reactor at room temperature. A 300 W Xe lamp with a UV-cutoff filter (λ > 400 nm) was used as the light source. In a typical photocatalytic experiment, 20 mg of photocatalyst power and 10 mL of triethanolamine were added into the quartz reactor, which contained 90 mL of deionized water, and were sonicated for 1 min. Before the photocatalytic experiments, the quartz reactor was degassed and maintained under vacuum conditions for 30 min by a vacuum pump, to remove the dissolved oxygen and ensure anaerobic conditions. Then, the suspensions were stirred and irradiated for 5 h. The amount of H2 released was measured by gas chromatography (FULI-9790II, with high-purity argon as the carrier gas).2.4 Photoelectrochemical measurements
The electrochemical tests were carried out on a CHI660C electrochemical analyzer (Chenhua Instrument, Inc.) in a standard three-electrode configuration with a Pt sheet (1 cm2 surface area) used as the counter electrode, Ag/AgCl (in saturated KCl) as the reference electrode, fluorine-doped tin oxide (FTO, 2 cm2 surface area) deposited with photocatalysts serving as a working electrode and 0.5 M Na2SO4 aqueous solution as the electrolyte. The working electrode was prepared as follows: 5 mg of photocatalyst power was mixed with 0.5 mL of ethyl alcohol, then 0.3 mL of Nafion solution (5 wt%) was added into the mixture to make a slurry by ultrasonic dispersal for 10 min. The slurry was uniformly dropped onto the working electrode. After drying at room temperature, the working electrode was transferred to a laboratory tube furnace and kept at 100 °C for 30 min in ambient N2. The photocurrent measurements were performed under the visible light irradiation of a 300 W Xe lamp with a UV-cutoff filter (λ > 400 nm) and a potential of −0.1 V vs. Ag/Ag Cl. The EIS experiments were conducted in the frequency range from 100 kHz to 0.01 Hz, with an amplitude voltage of 5 mV at the open circuit voltage. Mott–Schottky analysis was carried out with potentials ranging from −0.9 to 0.1 V vs. Ag/AgCl for UCN and −0.12 to 0.06 V vs. Ag/AgCl for MoSx with an amplitude voltage of 5 mV.3. Results and discussion
3.1 Characterization
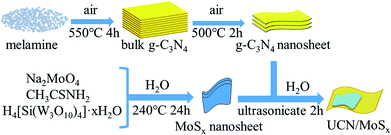
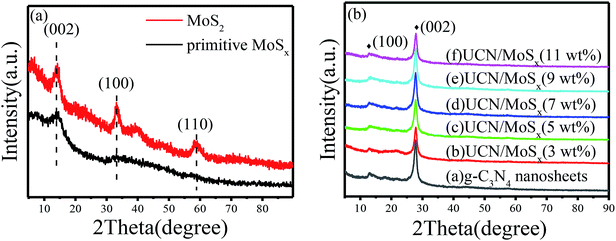
The MoSx/UCN composite was synthesized by a sonochemical method, as schematically illustrated in Fig. 1. The XRD patterns of primitive MoSx and MoS2 are shown in Fig. 2(a). Amorphous MoSx has only one weak and broad distinct diffraction peak at 14.4°. This demonstrates that the MoSx synthesized in this study has a very low crystallinity/amorphous structure, which is different from other MoS2 synthesized by a hydrothermal method.33,34 This is probably because H4SiMo12O40 is involved in the reaction.35 After calcination, amorphous MoSx can transform into crystallized MoS2. The XRD pattern of MoS2 has three distinct diffraction peaks at 14.4°, 32.9° and 58.2° corresponding to the (002), (100) and (110) planes of 2H-MoS2 (JCPDS no. 87-1526, molybdenum disulfide 2H), respectively. Fig. 2(b) shows XRD patterns of g-C3N4 nanosheets and ultrathin g-C3N4 with different contents of MoSx. For all samples, two diffraction peaks occur at 13.1° and 27.8°, and are indexed to be the (100) and (002) planes of g-C3N4 (JCDPS 87-1526). The strongest peak of (002) at about 27.8° is attributed to the inter-planar stacking of aromatic systems. The weak peak of (100) at 13.1° is induced by the in-plane structural stacking motif. The slight decrease in diffraction peak in the MoSx/UCN samples indicates that ultrathin g-C3N4 with less stacking is produced due to the exfoliation of g-C3N4 nanosheets in ultrasonic processing. Nevertheless, diffraction peaks corresponding to MoSx cannot be found in MoSx/UCN samples. This may be due to the amorphous structure of MoSx, and at the same time the broad diffraction peak of amorphous MoSx is too weak compared with the diffraction peak of the UCN crystal. The existence of MoSx in the MoSx/UCN composite will be confirmed further by our other tests.The morphology and microstructure of UCN, MoSx and MoSx/UCN samples were investigated by TEM characterization, and the results are shown in Fig. 3. Fig. 3(a) shows the two-dimensional morphology of the synthesized MoSx. Fig. 3(b) presents the typical TEM image of MoSx/UCN, which has a two-dimensional morphology similar to that of pure g-C3N4 nanosheets.36 Fig. 3(c) is an HRTEM image of MoSx, a disordered structure in the plane is observed, which indicates that MoSx is amorphous. The lattice fringe of the MoSx nanosheet edge confirms its layered structure with an interlayer distance of 0.62 nm. Fig. 3(d) shows HRTEM images for MoSx/UCN (7 wt%). The layered structure of MoSx can also be found, which demonstrates that the layered MoSx co-catalysts are successfully loaded onto the surface of UCN. Fig. 3(e) is the HRTEM image of another area in MoSx/UCN (7 wt%). The lattice spacing in Fig. 3(e) is 0.27 nm, which corresponds to the (100) facets of 2H-MoS2. The lattice fringe of 2H-MoS2 can be found because of the presence of partially crystalline MoS2 in MoSx.29 The co-existence of MoS2 and MoSx is shown in Fig. S1.† The EDX pattern (Fig. 3(f)) of area I in Fig. 3(b) and elemental mapping (Fig. S2†) fully prove the combination of UCN and MoSx from another perspective. The BET specific surface area and pore volume of the samples are listed in Table S2.† The BET specific surface area of UCN and MoSx/UCN are 89.29 and 72.56 m2 g−1, respectively. The pore volumes of UCN and MoSx/UCN are 0.31 and 0.18 m3 g−1. After loading with MoSx, the specific surface area and pore volume of MoSx/UCN decreased, which may be caused by the MoSx covering the pores of UCN. The results indicate that a MoSx/UCN photocatalyst with a two-dimensional structure has been successfully prepared in this study.
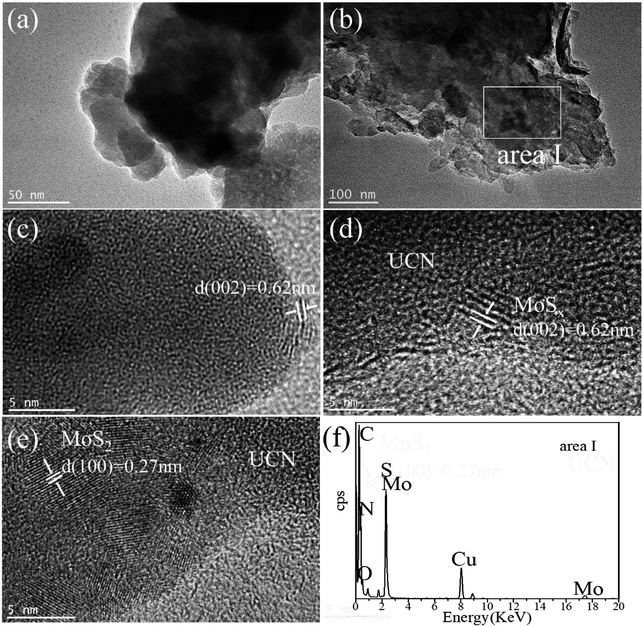 | ||
| Fig. 3 TEM images of (a) MoSx and (b) UCN; HRTEM images of (c) MoSx and (d and e) MoSx/UCN; EDX pattern of (f) area I. | ||
X-ray photoelectron spectroscopy was carried out to check the chemical states of the elements in MoSx/UCN photocatalysts. Fig. 4(a) indicates the presence of S, Mo, C, N and O in MoSx/UCN samples. Fig. 4(b–e) show the high-resolution XPS spectra of C 1s, N 1s, Mo 3d and S 2p in the MoSx/UCN samples. The C 1s spectrum shown in Fig. 4(b) can be deconvoluted into three peaks at 284.6, 285.9 and 288.6 eV, which are ascribed to the sp2-bonded aromatic structure (N–C![[double bond, length as m-dash]](https://www.rsc.org/images/entities/char_e001.gif) N), graphitic carbon (C–C), and residual C–O, respectively.37,38 As shown in Fig. 4(c), N 1s can be deconvoluted into three peaks at around 398.7 eV, 400.2 eV and 401.4 eV. The main peak at 398.7 eV can be assigned to sp2 hybridized aromatic N bonded to carbon atoms (C
N), graphitic carbon (C–C), and residual C–O, respectively.37,38 As shown in Fig. 4(c), N 1s can be deconvoluted into three peaks at around 398.7 eV, 400.2 eV and 401.4 eV. The main peak at 398.7 eV can be assigned to sp2 hybridized aromatic N bonded to carbon atoms (C![[double bond, length as m-dash]](https://www.rsc.org/images/entities/char_e001.gif) N–C).39 In addition, the peaks at 400.2 eV and 401.4 eV are ascribed to the tertiary N bonded to carbon atoms in the form of N–(C)3 and amino functional groups carrying hydrogen (C–N–H), respectively.40 From Fig. 4(d), we can confirm that, except for two S 2s peaks at binding energies of 227.3 and 226.1 eV, other peaks can be readily assigned to the Mo 3d spectrum.41 The peaks at 232.6 and 229.5 eV are attributed to Mo 3d3/2 and Mo 3d5/2, which are binding energies for Mo4+ species in amorphous molybdenum sulfide.42 The Mo 3d doublet at 229.8 and 233.3 eV may be attributed to Mo4+ or Mo5+ chemical state as in molybdenum oxysulfide MoSxOy, which can be surmised to be the presence of Mo
N–C).39 In addition, the peaks at 400.2 eV and 401.4 eV are ascribed to the tertiary N bonded to carbon atoms in the form of N–(C)3 and amino functional groups carrying hydrogen (C–N–H), respectively.40 From Fig. 4(d), we can confirm that, except for two S 2s peaks at binding energies of 227.3 and 226.1 eV, other peaks can be readily assigned to the Mo 3d spectrum.41 The peaks at 232.6 and 229.5 eV are attributed to Mo 3d3/2 and Mo 3d5/2, which are binding energies for Mo4+ species in amorphous molybdenum sulfide.42 The Mo 3d doublet at 229.8 and 233.3 eV may be attributed to Mo4+ or Mo5+ chemical state as in molybdenum oxysulfide MoSxOy, which can be surmised to be the presence of Mo![[double bond, length as m-dash]](https://www.rsc.org/images/entities/char_e001.gif) O defects in MoSx/UCN.43,44 Recently, Tran P. D. and colleagues found that Mo
O defects in MoSx/UCN.43,44 Recently, Tran P. D. and colleagues found that Mo![[double bond, length as m-dash]](https://www.rsc.org/images/entities/char_e001.gif) O defects will translate into Mo-bound hydride species which can act as the active species for H2-evolution.45 The doublet for Mo 3d at 233.1 and 236.1 eV suggests the presence of Mo6+, indicating the formation of small amounts of surface oxide species.23 The high-resolution XPS spectra of S 2p suggest the existence of both disulfide S22− and monosulfide S2−, as shown in Fig. 4(e).46,47 And the higher binding energy signals (at 163.1 and 164.2 eV) are assigned to apical S2− or bridging S22−, while the lower higher binding energy signals (at 161.3 and 162.6 eV) are assigned to unsaturated S2− or terminal S22−.31,48 The S atoms with high binding energy have better catalytic performance for the catalyst than those with low binding energy.49 The percentage of S atoms with high binding energy in MoSx is about 50%, which is conducive to the MoSx co-catalyst displaying a superior catalytic performance to crystalline MoS2. The peaks at 168.2 and 169.4 eV could be attributed to S6+ or S4+ in surface oxide species. High-resolution XPS spectra of Mo 3d and S 2p in MoS2 are shown in Fig. S3,† which shows a marked difference from MoSx. Furthermore, the atomic ratio of S/Mo was estimated as 2.7 according to XPS, which is higher than that of highly crystalline MoS2.50
O defects will translate into Mo-bound hydride species which can act as the active species for H2-evolution.45 The doublet for Mo 3d at 233.1 and 236.1 eV suggests the presence of Mo6+, indicating the formation of small amounts of surface oxide species.23 The high-resolution XPS spectra of S 2p suggest the existence of both disulfide S22− and monosulfide S2−, as shown in Fig. 4(e).46,47 And the higher binding energy signals (at 163.1 and 164.2 eV) are assigned to apical S2− or bridging S22−, while the lower higher binding energy signals (at 161.3 and 162.6 eV) are assigned to unsaturated S2− or terminal S22−.31,48 The S atoms with high binding energy have better catalytic performance for the catalyst than those with low binding energy.49 The percentage of S atoms with high binding energy in MoSx is about 50%, which is conducive to the MoSx co-catalyst displaying a superior catalytic performance to crystalline MoS2. The peaks at 168.2 and 169.4 eV could be attributed to S6+ or S4+ in surface oxide species. High-resolution XPS spectra of Mo 3d and S 2p in MoS2 are shown in Fig. S3,† which shows a marked difference from MoSx. Furthermore, the atomic ratio of S/Mo was estimated as 2.7 according to XPS, which is higher than that of highly crystalline MoS2.50
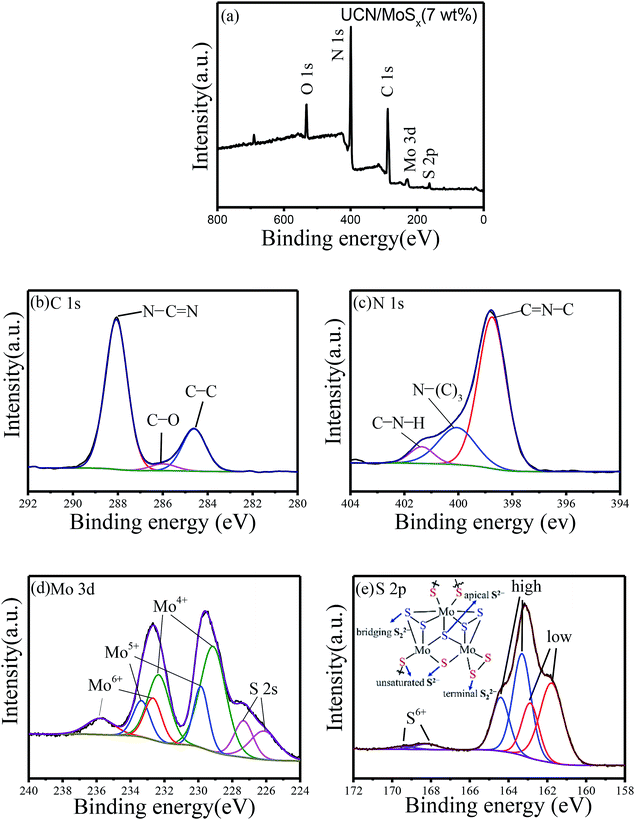 | ||
| Fig. 4 Typical (a) XPS survey spectra and high-resolution XPS spectra of (b) C 1s, (c) N 1s, (d) Mo 3d and (e) S 2p. | ||
The UV-vis diffuse reflectance spectra of UCN and MoSx/UCN are shown in Fig. 5(a). Pure UCN shows an absorption edge at 415 nm, which is consistent with previous studies.50,51 Compared with UCN, the MoSx/UCN composite exhibits a red-shift of the absorption edge and obviously enhanced light absorption in the visible region. The magnitude of the red-shift and the enhancement in light absorption gradually increase with increasing MoSx content. At the same time, the color of the prepared samples also changes from light yellow to dark gray. Fig. 5(b) shows that the Eg value of UCN is 2.92 eV and the Eg value of MoSx/UCN (3–11 wt%) is 2.86–2.73 eV. In short, MoSx expands the visible light-harvesting ability and narrows the Eg value of the UCN photocatalyst. This lets the photocatalyst absorb more photons, thereby enhancing its photocatalytic properties. In addition, as shown in Fig. 5(c), the photo-luminescence emission of UCN is remarkably quenched after MoSx has been loaded onto it. And the intensity of the PL emission peaks for the MoSx/UCN composite gradually decreases with an increase in MoSx content, which means that MoSx loading on the UCN surface can greatly suppress the rapid recombination of photogenerated electron–hole pairs in UCN. The results of UV-vis and PL measurements further prove that MoSx has been successfully deposited onto the surface of UCN, and 2D MoSx/UCN heterojunctions have been constructed.
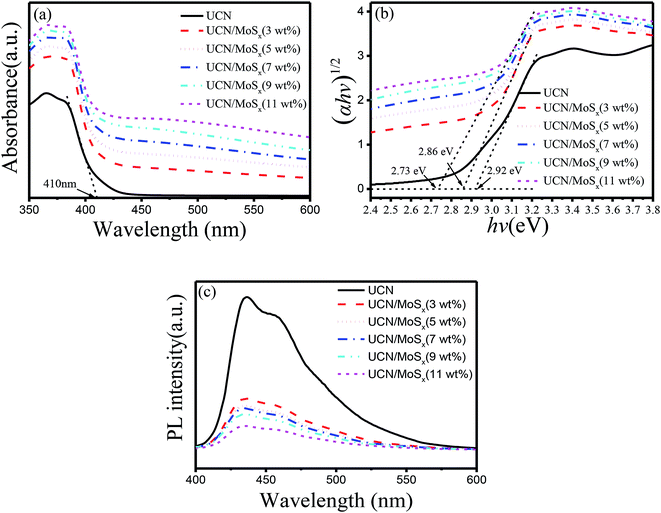 | ||
| Fig. 5 Photoresponse properties of samples: (a) UV-vis diffuse reflectance spectra, (b) Tauc plots and Eg values and (c) photoluminescence spectra. | ||
3.2 Photocatalytic H2-evolution activity
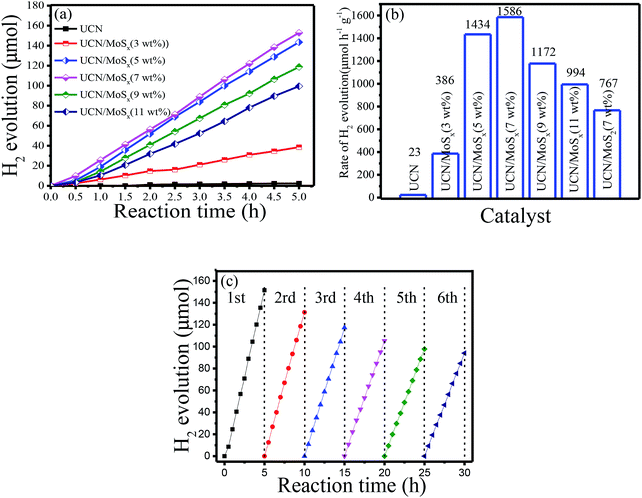
The photocatalytic H2-evolution performance of pure UCN, MoS2/UCN (7 wt%) and UCN/MoSx with different percentages of MoSx were evaluated under visible light irradiation (λ > 400 nm) using triethanolamine as a sacrificial reagent. Fig. 6(a) shows the H2-evolution rate by pure UCN and the MoSx/UCN composite. The linearly increasing rate of H2-evolution clearly shows that the MoSx/UCN composite photocatalysts exhibit very good photostability within five hours. Further comparison of the average photocatalytic H2-evolution rates of various photocatalysts is shown in Fig. 6(b). It can be seen that the H2-evolution rate of pure UCN is only 23 μmol g−1 h−1, due to its fast recombination of electron–hole pairs. After 3–7 wt% MoSx have combined with UCN, the average hydrogen-evolution rates of MoSx/UCN increase to an optimal value of 1586 μmol g−1 h−1. With a further increase in MoSx from 7 wt% to 11 wt%, the average H2-evolution rate begins to decrease from 1586 μmol g−1 h−1 to 994 g−1 h−1. We also found that the photocatalytic activity of MoS2/UCN is much lower than that of MoSx/UCN, which indicates that as a co-catalyst MoSx is much better than crystal MoS2. It is obvious that the photocatalytic activity of the binary composite photocatalysts is much higher than that of the pure UCN photocatalyst. The most outstanding H2-evolution rate of the MoSx/UCN (7 wt%) photocatalyst is about 70 times that of pure UCN. In addition, MoSx itself does not show such high photocatalytic activity for hydrogen evolution under visible light irradiation in the test, which confirms that MoSx only plays the role of co-catalyst in MoSx/UCN. In order to investigate the photocatalytic stability of the MoSx/UCN composite, cycle running tests were conducted under visible light irradiation and are shown in Fig. 6(c) The activity of the photocatalyst decreases quickly with the first three cycle tests. This phenomenon could be induced by the degradation of MoSx. After the fourth cycle, the H2-evolution volume remains at about 62% of the H2 volume produced with the first run test. From these results, deposition of MoSx on the surface of UCN plays a decisive role in enhancing the photocatalytic activity of H2-evolution. As mentioned, on the one hand, MoSx can improve the electron–hole separation efficiency as well as the visible light response of UCN; on the other hand, MoSx can provide a large number of active sites for H2-evolution. However, excessive MoSx above 7 wt% may lead to a lower H2-evolution rate, which can be caused by the shielding effects of MoSx for both the surface active sites and the visible light response of UCN.52,53 For comparison, the results of our research work and other reports are listed in Table S1.† The MoSx/UCN samples in our research work show much better photocatalytic activity for H2-evolution compared with most of the other research.3.3 Photoelectrochemical measurements
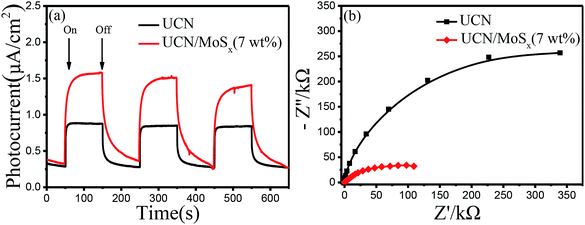
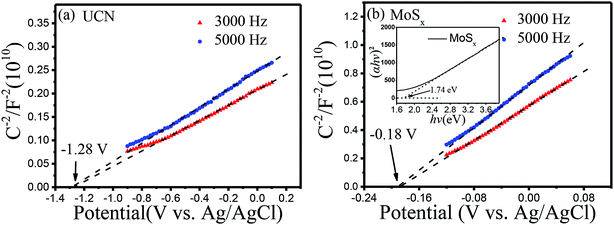
To further confirm the elevated separation efficiency of photogenerated carriers and the transfer rate of charge carriers for photocatalysts, the transient photocurrent response (I–t curves) and the electrochemical impedance spectroscopy (EIS) of pure UCN and the MoSx/UCN (7 wt%) composite photocatalysts performed by a typical three-electrode system are shown in Fig. 7. The photocurrent of the MoSx/UCN (7 wt%) under visible light is almost twice that of UCN, as shown in Fig. 7(a). The higher photocurrent of MoSx/UCN (7 wt%) can be ascribed to the introduction of MoSx, which increases the separation of electron–hole pairs. As shown in Fig. 7(b), it is obvious that MoSx/UCN (7 wt%) exhibits a smaller arc size compared to that of pure UCN, suggesting that the addition of MoSx can accelerate the electron transfer through the intimate interfaces between UCN and MoSx.In order to study the energy band structure of the semiconductor photocatalysts, a Mott–Schottky study was carried out. From the Mott–Schottky plots (Fig. 8), the conduction band potential of UCN and MoSx can be estimated.54 The conduction bands (CBs) are determined to be −1.28 V and −0.18 V (vs. EAg/AgCl, pH = 7) for UCN and MoSx, respectively. The potentials are converted to the NHE scale according to the equation:55,56
| ENHE = EAg/AgCl + E0Ag/AgCl (0.198 V) |
The recalculated valence band (VB) potentials of UCN and MoSx are −1.08 and 0.02 V (vs. ENHE, pH = 7), respectively. Following the equation EVB = ECB + Eg/e, the valence band potentials for UCN and MoSx are 1.84 and 1.76 V (vs. NHE, pH = 7). The conduction band potential for pure UCN (−1.08 V vs. ENHE, pH = 7) is more negative than the H+ reduction potential (−0.410 V vs. ENHE at pH = 7), which is enough to reduce H+ and produce H2. The conduction band potential of pure MoSx is more positive than the H+ reduction potential when the pH value equals 7, which results in an inertness of HER for MoSx under visible irradiation. The result is consistent with the studies of previous reports.57
3.4 Photocatalytic mechanism
Based on the experimental results, a possible mechanism is proposed to explain the enhanced H2-production activity of MoSx/UCN. As shown in Fig. 9, the conduction band position for UCN is higher than that of MoSx. Under visible light irradiation, UCN can capture the photons, and electrons in the valence band will transfer to the conduction band to form electron–hole pairs. After that, the electrons may move to the surface of UCN to reduce H+ and produce H2 by sufficient overpotential. But pure UCN shows poor H2-evolution performance due to the lack of active species for H2 production. After deposition of MoSx, the electrons excited on the surface of UCN can transfer to MoSx, because the conduction band of MoSx is more negative than that of UCN. First, the fast recombination of electron–hole pairs in UCN can be suppressed, and, second, the rapid consumption of electrons on the MoSx surface may lead to the production of more H2. Meanwhile, the holes in the VB of UCN are consumed by the triethanolamine sacrificial reagent. Furthermore, compared to MoS2, MoSx has a larger number of unsaturated S-atoms and unsaturated Mo-atoms. Unsaturated S-atoms and unsaturated Mo-atoms can absorb H+ to form S–H and Mo–H bonds,45,49 which can work as active species for H2 production, so MoSx shows better co-catalytic performance than MoS2.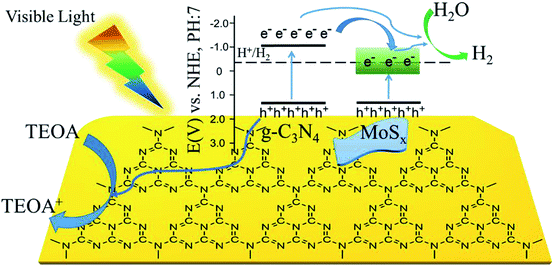 | ||
| Fig. 9 Schematic illustration of the proposed principle of photocatalytic H2-evolution by MoSx/UCN under visible light irradiation. | ||
4. Conclusion
In conclusion, a facile sonochemical approach was used to fabricate an MoSx/UCN composite photocatalyst for superior photocatalytic H2 production. The results demonstrate that amorphous MoSx loaded on UCN plays a co-catalyst role, the range of visible light absorption has been expanded, a large number of active species has been offered, and the separation and transportation of charge carriers have been promoted, leading to a tremendous improvement in the photocatalytic activity of UCN under visible light irradiation. For MoSx/UCN, the optimal content of MoSx is 7 wt%, in which the rate of H2-evolution can reach a maximum value of 1586 μmol g−1 h−1. The present work successfully provides a novel g-C3N4 and amorphous MoSx binary photocatalyst with excellent photocatalytic hydrogen-evolution performance.Conflicts of interest
There are no conflicts to declare.Acknowledgements
This work was financially supported by the National Natural Science Foundation of China (51770000), Natural Science Foundation of Anhui Province (1608085QE000), the Fundamental Research Funds for the Central Universities (JZ2017HGTB000), Guangxi Key Laboratory for Electrochemical Energy Materials, and the 111 Project “New Materials and Technology for Clean Energy” (B18018).References
- L. M. Dai, D. W. Chang, J. B. Baek and W. Lu, Small, 2012, 8, 1130–1166 CrossRef CAS.
- S. Wei, H. He, Y. Cheng, C. Yang, G. Zeng, L. Kang, H. Qian and C. Zhu, Fuel, 2017, 200, 11–21 CrossRef CAS.
- E. Baran and B. Yazici, Int. J. Hydrogen Energy, 2016, 41, 2498–2511 CrossRef CAS.
- K. Tedsree, T. Li, S. Jones, C. W. A. Chan, K. M. K. Yu, P. A. J. Bagot, E. A. Marquis, G. D. W. Smith and S. C. E. Tsang, Nat. Nanotechnol., 2011, 6, 302–307 CrossRef CAS PubMed.
- M. Z. Ge, J. S. Cai, J. Iocozzia, C. Y. Cao, J. Y. Huang, X. N. Zhang, J. L. Shen, S. C. Wang, S. N. Zhang, K. Q. Zhang, Y. K. Lai and Z. Q. Lin, Int. J. Hydrogen Energy, 2017, 42, 8418–8449 CrossRef CAS.
- W. Zhang, Y. B. Wang, Z. Wang, Z. Y. Zhong and R. Xu, Chem. Commun., 2010, 46, 7631–7633 RSC.
- T. Simon, N. Bouchonville, M. J. Berr, A. Vaneski, A. Adrovic, D. Volbers, R. Wyrwich, M. Doblinger, A. S. Susha, A. L. Rogach, F. Jackel, J. K. Stolarczyk and J. Feldmann, Nat. Mater., 2014, 13, 1013–1018 CrossRef CAS PubMed.
- Q. Xiang, J. Yu and M. Jaroniec, Nanoscale, 2011, 3, 3670–3678 RSC.
- S. C. Yan, Z. S. Li and Z. G. Zou, Langmuir, 2009, 25, 10397–10401 CrossRef CAS PubMed.
- S. C. Yan, Z. S. Li and Z. G. Zou, Langmuir, 2010, 26, 3894–3901 CrossRef CAS PubMed.
- X. Wang, K. Maeda, A. Thomas, K. Takanabe, G. Xin, J. M. Carlsson, K. Domen and M. Antonietti, Nat. Mater., 2009, 8, 76–80 CrossRef CAS PubMed.
- Y. W. Zhang, J. H. Liu, G. Wu and W. Chen, Nanoscale, 2012, 4, 5300–5303 RSC.
- B. Chai, T. Peng, J. Mao, K. Li and L. Zan, Phys. Chem. Chem. Phys., 2012, 14, 16745–16752 RSC.
- Q. Han, B. Wang, J. Gao, Z. Cheng, Y. Zhao, Z. Zhang and L. Qu, ACS Nano, 2016, 10, 2745–2751 CrossRef CAS.
- X. Wang, K. Maeda, X. Chen, K. Takanabe, K. Domen, Y. Hou, X. Fu and M. Antonietti, J. Am. Chem. Soc., 2009, 131, 1680 CrossRef CAS.
- J. Zhang, M. Zhang, C. Yang and X. Wang, Adv. Mater., 2014, 26, 4121–4126 CrossRef CAS PubMed.
- S. Hu, F. Li, Z. Fan, F. Wang, Y. Zhao and Z. Lv, Dalton Trans., 2015, 44, 1084–1092 RSC.
- G. Liu, P. Niu, C. Sun, S. C. Smith, Z. Chen, G. Q. Lu and H.-M. Cheng, J. Am. Chem. Soc., 2010, 132, 11642–11648 CrossRef CAS PubMed.
- Z. Zhu, Z. Lu, D. Wang, X. Tang, Y. Yan, W. Shi, Y. Wang, N. Gao, X. Yao and H. Dong, Appl. Catal., B, 2016, 182, 115–122 CrossRef CAS.
- O. Elbanna, M. Fujitsuka and T. Majima, ACS Appl. Mater. Interfaces, 2017, 9, 34844–34854 CrossRef CAS PubMed.
- J. D. Benck, T. R. Hellstern, J. Kibsgaard, P. Chakthranont and T. F. Jaramillo, ACS Catal., 2014, 4, 3957–3971 CrossRef CAS.
- S. R. Kadam, D. J. Late, R. P. Panmand, M. V. Kulkarni, L. K. Nikam, S. W. Gosavi, C. J. Park and B. B. Kale, J. Mater. Chem. A, 2015, 3, 21233–21243 RSC.
- Y. Hou, A. B. Laursen, J. Zhang, G. Zhang, Y. Zhu, X. Wang, S. Dahl and I. Chorkendorff, Angew. Chem., Int. Ed., 2013, 52, 3621–3625 CrossRef CAS PubMed.
- L. Ge, C. Han, X. Xiao and L. Guo, Int. J. Hydrogen Energy, 2013, 38, 6960–6969 CrossRef CAS.
- B. Han, S. Q. Liu, N. Zhang, Y. J. Xu and Z. R. Tang, Appl. Catal., B, 2017, 202, 298–304 CrossRef CAS.
- M. Latorre-Sanchez, I. Esteve-Adell, A. Primo and H. Garcia, Carbon, 2015, 81, 587–596 CrossRef CAS.
- Y. J. Yuan, Z.-J. Ye, H.-W. Lu, B. Hu, Y. H. Li, D.-Q. Chen, J.-S. Zhong, Z.-T. Yu and Z.-G. Zou, ACS Catal., 2016, 6, 532–541 CrossRef CAS.
- Q. Liu, Q. Fang, W. S. Chu, Y. Y. Wan, X. L. Li, W. Y. Xu, M. Habib, S. Tao, Y. Zhou, D. B. Liu, T. Xiang, A. Khalil, X. J. Wu, M. Chhowalla, P. M. Ajayan and L. Song, Chem. Mater., 2017, 29, 4738–4744 CrossRef CAS.
- S. C. Lee, J. D. Benck, C. Tsai, J. Park, A. L. Koh, F. Abild-Pedersen, T. F. Jaramillo and R. Sinclair, ACS Nano, 2016, 10, 624–632 CrossRef CAS PubMed.
- H. Yu, P. Xiao, P. Wang and J. Yu, Appl. Catal., B, 2016, 193, 217–225 CrossRef CAS.
- X. Hai, W. Zhou, K. Chang, H. Pang, H. Liu, L. Shi, F. Ichihara and J. Ye, J. Mater. Chem. A, 2017, 5, 8591–8598 RSC.
- P. Niu, L. Zhang, G. Liu and H.-M. Cheng, Adv. Funct. Mater., 2012, 22, 4763–4770 CrossRef CAS.
- Y. Hou, Z. Wen, S. Cui, X. Guo and J. Chen, Adv. Mater., 2013, 25, 6291–6297 CrossRef CAS PubMed.
- W. Zhou, Z. Yin, Y. Du, X. Huang, Z. Zeng, Z. Fan, H. Liu, J. Wang and H. Zhang, Small, 2013, 9, 140–147 CrossRef CAS PubMed.
- H. Lin, X. Chen, H. Li, M. Yang and Y. Qi, Mater. Lett., 2010, 64, 1748–1750 CrossRef CAS.
- Q. Liu, T. Chen, Y. Guo, Z. Zhang and X. Fang, Appl. Catal., B, 2016, 193, 248–258 CrossRef CAS.
- J. Mao, T. Peng, X. Zhang, K. Li, L. Ye and L. Zan, Catal. Sci. Technol., 2013, 3, 1253–1260 RSC.
- Y. P. Liu, P. Chen, Y. Chen, H. D. Lu, J. X. Wang, Z. S. Yang, Z. H. Lu, M. Li and L. Fang, RSC Adv., 2016, 6, 10802–10809 RSC.
- X. D. Zhang, X. Xie, H. Wang, J. J. Zhang, B. C. Pan and Y. Xie, J. Am. Chem. Soc., 2013, 135, 18–21 CrossRef CAS PubMed.
- X. Yuan, C. Zhou, Y. Jin, Q. Jing, Y. Yang, X. Shen, Q. Tang, Y. Mu and A.-K. Du, J. Colloid Interface Sci., 2016, 468, 211–219 CrossRef CAS PubMed.
- H. Vrubel and X. Hu, ACS Catal., 2013, 3, 2002–2011 CrossRef CAS.
- A. Y. Lu, X. Yang, C. C. Tseng, S. Min, S. H. Lin, C. L. Hsu, H. Li, H. Idriss, J.-L. Kuo, K.-W. Huang and L.-J. Li, Small, 2016, 12, 5530–5537 CrossRef CAS PubMed.
- P. Kien-Cuong, D. S. McPhail, A. T. S. Wee and D. H. C. Chua, RSC Adv., 2017, 7, 6856–6864 RSC.
- Y. Chen, P. D. Tran, P. Boix, Y. Ren, S. Y. Chiam, Z. Li, K. Fu, L. H. Wong and J. Barber, ACS Nano, 2015, 9, 3829–3836 CrossRef CAS.
- P. D. Tran, T. V. Tran, M. Orio, S. Torelli, Q. D. Truong, K. Nayuki, Y. Sasaki, S. Y. Chiam, R. Yi, I. Honma, J. Barber and V. Artero, Nat. Mater., 2016, 15, 640 CrossRef CAS PubMed.
- D. Merki, S. Fierro, H. Vrubel and X. Hu, Chem. Sci., 2011, 2, 1262–1267 RSC.
- L. Ye, D. Wang and S. Chen, ACS Appl. Mater. Interfaces, 2016, 8, 5280–5289 CrossRef CAS PubMed.
- J. Kibsgaard, T. F. Jaramillo and F. Besenbacher, Nat. Chem., 2014, 6, 248–253 CrossRef CAS PubMed.
- L. R. L. Ting, Y. Deng, L. Ma, Y.-J. Zhang, A. A. Peterson and B. S. Yeo, ACS Catal., 2016, 6, 861–867 CrossRef CAS.
- K. K. Liu, W. J. Zhang, Y. H. Lee, Y. C. Lin, M. T. Chang, C. Y. Su, C. S. Chang, H. Li, Y. M. Shi, H. Zhang, C. S. Lai and L. J. Li, Nano Lett., 2012, 12, 1538–1544 CrossRef CAS PubMed.
- F. Dong, Y. Li, Z. Wang and W.-K. Ho, Appl. Surf. Sci., 2015, 358, 393–403 CrossRef CAS.
- Y. Min, G. He, Q. Xu and Y. Chen, J. Mater. Chem. A, 2014, 2, 2578–2584 RSC.
- K. Chang, Z. Mei, T. Wang, Q. Kang, S. Ouyang and J. Ye, ACS Nano, 2014, 8, 7078–7087 CrossRef CAS PubMed.
- T. Giannakopoulou, I. Papailias, N. Todorova, N. Boukos, Y. Liu, J. Yu and C. Trapalis, Chem. Eng. J., 2017, 310, 571–580 CrossRef CAS.
- S. Hong, D. P. Kumar, D. A. Reddy, J. Choi and T. K. Kim, Appl. Surf. Sci., 2017, 396, 421–429 CrossRef CAS.
- M. Li, L. Zhang, X. Fan, M. Wu, Y. Du, M. Wang, Q. Kong, L. Zhang and J. Shi, Appl. Catal., B, 2016, 190, 36–43 CrossRef CAS.
- Q. Xiang, B. Cheng and J. Yu, Angew. Chem., Int. Ed., 2015, 54, 11350–11366 CrossRef CAS PubMed.
Footnote |
| † Electronic supplementary information (ESI) available. See DOI: 10.1039/c8ra09806a |
| This journal is © The Royal Society of Chemistry 2019 |

