 Open Access Article
Novel red-emitting phosphor Li2MgZrO4:Mn4+,Ga3+ for warm white LEDs based on blue-emitting chip
Wen Yan,
Siguo Xiao * and
Xiaoliang Yang
School of Physics and Optoelectronics, Xiangtan University, Hunan 411105, China. E-mail: Xiaosiguo@xtu.edu.cn; Fax: +8673158292468; Tel: +8613786239082
First published on 12th February 2019
Abstract
Li2MgZrO4:Mn4+,Ga3+ phosphors are synthesized via a conventional high-temperature solid-state reaction. The red emission of Mn4+ is enhanced 6.68 times and 13.0 times under 352 nm and 468 nm excitation when Ga3+ ions with a concentration of 40% are introduced into the phosphor. The thermal stability of the phosphor is also slightly improved by Ga3+ doping. It is believed that the GaZr dopants in the Li2MgZrO4 host not only stabilize Mn ions in the 4+ state, but also lower the symmetry of Mn4+ sites, resulting in the significant improvement of the luminescence performance, especially under blue excitation. The results might provide meaningful reference to seek high-performance Mn4+ doped oxide phosphors for W-LED applications based on a blue-emitting InGaN chip.
1. Introduction
White light emitting diodes (W-LEDs) have sparked great interests due to their superior properties in luminous efficiency, lifetime, reliability, and environment-friendly features.1–4 Presently most W-LEDs are fabricated by an InGaN LED (emitting near 460 nm) in combination with a yellow emitting phosphor such as Y3Al5O12:Ce3+ (YAG:Ce3+).5,6 However, their luminescence suffers from problems such as cold white light and a low color-rendering index, which results from the lack of red spectral contribution.7–9 In order to obtain white light with a high-color-rendering index (CRI, Ra ≥ 80) and low correlated color temperature (CCT ≤ 4500 K), suitable red phosphors need to be mixed with YAG:Ce3+.10,11 Great efforts have been made to exploit novel rare-earth-doped red phosphors with high efficiency for this purpose, and the most successful materials are Eu2+- or Ce3+-doped nitride compounds.12–14 Regretfully, because of the 4f–5d transitions, the light re-absorption in the green or yellow spectral region for these nitride phosphors is unavoidable, causing color change and luminous reduction of W-LEDs.15 Besides, the red-emitting nitride phosphors are quite expensive due to the complex synthesis procedures.15,16As an alternative, the non-rare-earth Mn4+ doped red phosphors have gained increased attention recently due to their low cost and admirable spectral features. They usually exhibit broad and strong absorption between 250 and 550 nm and emit efficiently light from 600 to 750 nm.17–22 So far, Mn4+ red luminescence has been reported in Mn4+-doped fluoride and oxide compounds. For Mn4+ activated fluorides, they exhibit intense excitation band centered at ∼460 nm and sharp red emission lines peaking at ∼630 nm.6,23–25 Regretfully, the fluoride host is not stable due to its hygroscopicity. Moreover, in the synthesis process the required toxic HF solution is very harmful to environment.22,23 In contrast, Mn4+ activated oxides exhibiting much high chemical stability with an eco-friendly preparation procedure, show promising capabilities as good red converters for warm W-LEDs.26–28 Mn4+ activated aluminates,29,30 titanates,31,32 germanates33 and pyrosilicates34–38 has been widely reported. Unfortunately, the currently known Mn4+ activated oxide phosphors cannot meet the needs of general lighting due to the low quantum efficiency (QE) when excited by blue chips. Hence more in-depth investigations on Mn4+ activated oxide phosphors to improve their red luminescence performance are highly desired. Just recently the luminescence properties of Mn4+ activated double perovskites oxide Li2MgZrO4 (LMZO) have been reported.39 LMZO contains [ZrO6] octahedrons, offering great capacity to accept Mn4+ substitutes, thereupon efficient red emission is observed under excitation of both UV and blue light. The aim in the current study, therefore, is to enhance the red emission intensity of Mn4+ in LMZO host, especially under blue light excitation, by doping with an impurity of Ga3+.
2. Experimental section
2.1. Sample fabrication
The LMZO:Mn4+,Ga3+ powders were prepared by a conventional high-temperature solid-state reaction method. The chemicals, such as Li2CO3 (A.R. 99.5%), MgO (A.R. 99.9%), ZrO2 (A.R. 99.9%), MnCO3 (A.R. 99.5%), and Ga2O3 (99.5%) are used as raw materials, which are purchased from the Aladdin Chemical Reagent Company in Shanghai, China. The nominal chemical compositions for the phosphors were designed as Li2MgZr0.996−xO4:Mn0.0044+,Gax3+ (x = 0.00, 0.05, 0.10, 0.15, 0.20, 0.25, 0.30, 0.35, 0.40, 0.45, 0.50). The starting materials were weighed with stoichiometric ratio and finely mixed in an agate mortar to ensure homogeneous mixing. Then the mixed samples were sintered at 1250 °C for 8 h in air. After that, the samples were cooled to room temperature and finely ground to obtain the final products.2.2. Characterization
The crystalline phases of the samples were analyzed by X-ray diffraction (XRD) on a Bruker D8 advanced equipment, using Cu tube with Cu/K (k = 0.1541 nm) radiation in the 2θ range of 5° to 90°. The photoluminescence excitation spectra and visible-NIR photoluminescence spectra were measured by a monochromator (Zolix Instrument, Omni-λ320i) coupled with photomultiplier tube (PMTHS1-R928), in which a monochromator (Zolix Instrument Omni-λ300) coupled with a 150 W xenon lamp was used to provide monochromatic light for excitation spectra measurement. Luminescence decay curves and temperature dependent emission spectra were measured by a FLS920 (Edinburgh) spectrometer. Both continuous and pulsed 150 W xenon lamps were used as excitation light source and an R928p (hamamatsu) detector was used to acquire emission light signal. Quantum efficiency (QE) is measured directly by a Mars HS3000 spectrofluorimeter with integrating sphere at room temperature.3. Results and discussion
3.1. Crystal structure analysis
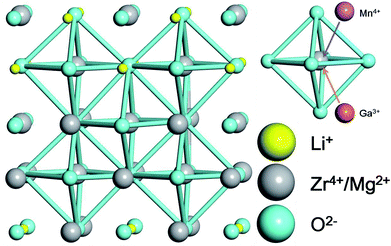
The X-ray diffraction (XRD) patterns of the as-prepared LMZO:Mn0.0044+,Gax3+ (x = 0.00, 0.05, 0.10, 0.15, 0.20, 0.25, 0.30, 0.35, 0.40, 0.45, 0.50) are shown in Fig. 1. The XRD pattern of the sample doped with relatively low Ga3+ concentration (x ≤ 0.40) matches well with the Joint Committee on Powder Diffraction Standard (JCPDS) card 78-0198 for LMZO. This indicates that the introduction of Ga3+ ions within a certain concentration range has not caused significant change in the crystal structure of the LMZO. However, impurity phases such as MgO, and LiGaO2 appears as the doped Ga3+ ions is high enough (x > 0.40). A schematic of the LMZO crystal structure is also given in Fig. 2. LMZO as a double perovskites oxide is described as the tetragonal crystal system with space-group I41/amd (141).40 The LMZO crystal structure consists of [LiO4] tetrahedron, [MgO6] and [ZrO6] octahedral. Mn4+ ions tend to replace the Zr4+ sites in terms of the charge balance and ionic radius similar principle.41 Meanwhile, the XRD analysis suggests that the sample remains pure LMZO when the doped Ga3+ concentration is less 40%, meaning that substitution of Zr4+ by Ga3+ in LMZO is also permissible. When Ga3+ ions replace the Zr4+ ions, oxygen vacancies might form to keep the electroneutrality of the compound.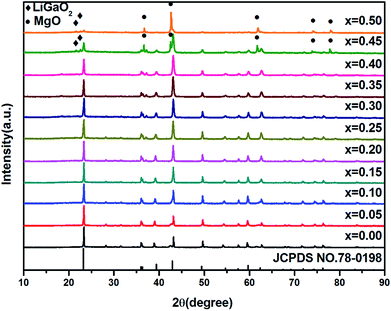 | ||
| Fig. 1 XRD patterns of LMZO:Mn0.0044+,Gax3+ (x = 0.00, 0.05, 0.10, 0.15, 0.20, 0.25, 0.30, 0.35, 0.40, 0.45, 0.50) phosphors. | ||
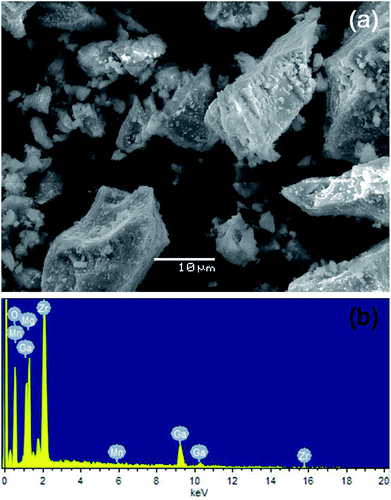
More detailed morphological and compositional results of the as-synthesized LMZO:Mn0.0044+,Ga0.403+ powder obtained from SEM and EDS measurements are shown in Fig. 3. Fig. 3a displays the fine particles with irregular and polygonal-shape morphology and the sizes in the range of sub-micrometer to a few micrometers. In the corresponding EDS spectrum presented in Fig. 3b, the peaks of manganese (Mn), magnesium (Mg), gallium (Ga), zirconium (Zr) and oxygen (O) can be clearly identified. As shown in Table 1, the atomic ratio of the three elements of Zr, Mn and Ga is calculated to be substantially equal to the stoichiometric ratio, which further suggests that Mn and Ga elements have indeed successfully occupied the lattice sites of Zr, generated the substance we expected.
| Chemical element | Weight percentage | Atomic percentage |
|---|---|---|
| O | 37.06 | 67.75 |
| Mg | 11.64 | 14.01 |
| Mn | 0.04 | 0.02 |
| Ga | 18.03 | 7.56 |
| Zr | 33.23 | 10.66 |
3.2. Characteristic analysis
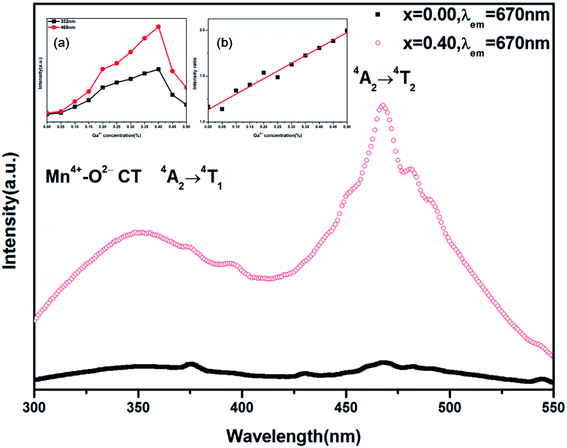
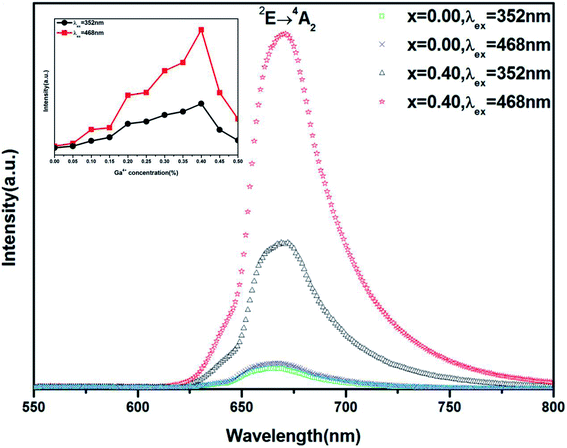
Fig. 4 shows the photoluminescence excitation (PLE) spectra of LMZO:Mn0.0044+,Gax3+ (x = 0.00, 0.40) samples, which were recorded by monitoring the red emission at 670 nm. In the region from 300 to 550 nm, the PLE spectra for both Ga3+ doped and un-doped samples consist of two broad excitation bands peaking at 352 and 468 nm, respectively. The PLE band in the near ultraviolet-violet range includes two overlapping excitation bands which originate from the Mn4+–O2− charge transfer (CT) and 4A2 → 4T1 transition of Mn4+ ion, respectively, while the band in the blue-green range is attributed to the 4A2 → 4T2 transition of Mn4+ ions.42,43 It is found that the introduction of Ga3+ ions has significantly changed excitation properties of Mn4+ ions, just as shown in the inset (a) of Fig. 4. From Fig. 4, one may find that the excitation intensities at 352 and 468 nm both increase with Ga3+ doping concentration increasing, reaches their maximum at x = 0.40, and then decrease sharply when the Ga3+ concentration is higher than 40 mol%. At x = 0.40, the excitation intensity at 352 nm is enhanced by 6.85 times, while the excitation intensity at 468 nm is enhanced by 10.6 times. This suggests that the excitation intensity in both ultraviolet-violet and blue-green range can be largely enhanced by introduction of Ga3+ ions of suitable concentration. However, the doped Ga3+ ions can more effectively improve the excitation properties in the blue-green region as compared with that in the ultraviolet-violet region, which can been clearly seen from the inset (b) in Fig. 4. The inset (b) in Fig. 4 gives the ratio of excitation intensity at 468 nm to that at 352 nm as a function of Ga3+ concentration. It is found that the ratio increases from 1.17 to 2.00 as Ga3+ doping concentration increases from 0% to 50%.The measured photoluminescence (PL) spectra of LMZO:Mn0.0044+,Gax3+ (x = 0.00, 0.40) phosphors under excitation of 352 and 468 nm are shown in Fig. 5. The emission spectra for Ga3+ doped and un-doped samples show similar profiles whether excited by 365 nm or 468 nm light, except for the intensity. They present a broad band in the region of 610–800 nm with emission peak at about 670 nm, corresponding to the 2E → 4A2 transition of Mn4+ ions.44,45 The full-width at half maximum (FWHM) of the Mn4+ emission band for these powders is about 40 nm. The Ga3+ concentration dependent emission intensity upon 352 nm and 468 nm excitation is shown in the inset of Fig. 5. The highest photoluminescence intensity is achieved at Ga3+ doping concentration of 40 mol% (x = 0.40) and it is enhanced by 6.68 times and 13.0 times under 352 nm and 468 nm excitation as compared with the Ga3+ un-doped sample, respectively.
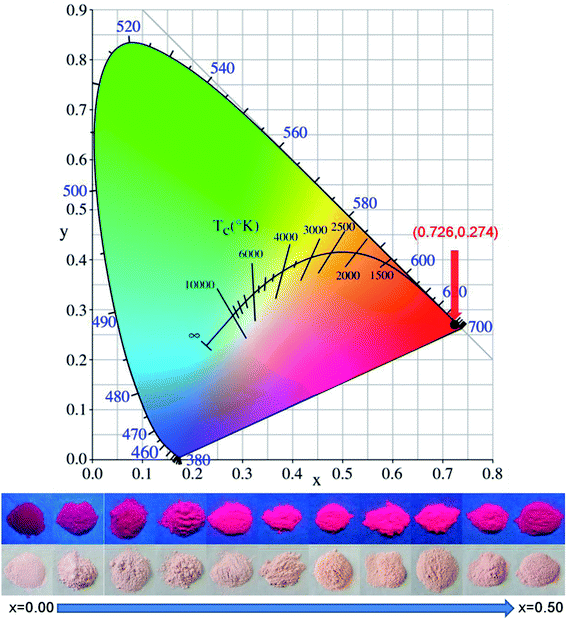
Based on the PL spectra, the Commission Internationale de L'Eclairage (CIE) coordinate for the phosphors can be calculated. The CIE coordinate has little altered when the sample is doped with Ga3+ ions of different concentration, since the doped Ga3+ ions has not changed the spectral shape of the emission band. The CIE coordinates for all the samples excited at 468 nm are (0.726, 0.274), located in the deep-red region. Fig. 6 shows the CIE coordinate of the phosphors under 468 nm excitation. The digital images of the as-prepared LMZO:Mn0.0044+,Gax3+ (x = 0.00, 0.05, 0.10, 0.15, 0.20, 0.25, 0.30, 0.35, 0.40, 0.45, 0.50) phosphors under daylight and 365 nm near-UV light are also given in Fig. 6. The daylight color of the samples changes from shallow to deep with an increase of the Ga3+ concentration. The red emissions from LMZO:Mn0.0044+,Gax3+ upon 365 nm excitation can be clearly seen with the naked eye. The color under 365 nm near ultraviolet light of the samples changes from dark to light and then from light to dark with the increase of the Ga3+ concentration. The light reaches the brightest when x = 0.40.
In recent years, many new Mn4+ doped oxide phosphors have been developed and some Mn4+ doped oxide phosphors reported can give very efficient red or deep red emission under near ultraviolet excitation.46–49 Regretfully, their emission intensities under blue excitation are usually much weaker than that under near ultraviolet excitation. This makes it difficult to meet the need of W-LEDs application based on blue-emitting InGaN chip. In the present work, however, it is manifested that the emission intensity of Mn4+ in the LMZO host can be significantly improved by Ga3+ doping, especially excited the blue light. This provides import reference for finding new Mn4+ doped oxide phosphors matching with the commercial blue chips.
It is known that the electronic states of 3d3 configuration of Mn4+ are even, and because of this, the transitions between these states are forbidden in the electric-dipole approximation. This rule can be somewhat released by an admixture of the states of opposite parities. In the LMZO host, the Ga3+ doping might lower the symmetry of Mn4+ sites and thus the admixture of states of opposite parity would increase. As a result, the electric dipole amplitude of Mn4+ arises with the increase of Ga3+ doping content. This might lead to large increase of the Mn4+ red emission excited by blue light. However, the emission increase caused by Ga3+ doping under ultraviolet excitation is not as significant as that under blue excitation, since some contribution of ultraviolet excitation is provided by Mn4+–O2− charge transfer that should be less sensitive to the local environment. On the other hand, GaZr dopants might also be helpful to stabilize Mn ions in 4+ state and thus enhance the luminescence intensity of the phosphor. Near recent investigation shows that hole-type dopants in Y3Al5O12 (YAG), such as MgAl6, CaY and NaY, can enhance the stability of Mn4+ state and correspondingly enhance its luminescence intensity.50 Presumably GaZr dopants might play the similar role in the LMZO host, stabilizing Mn4+ ions and reducing the formation of low valent Mn ions such as Mn3+. This not only increases the required Mn4+ luminescence centres, but also reduces the luminescence quenching based on energy transfers such as Mn4+ → Mn3+. The reduced luminescence quenching might also be proven by the Ga3+ concentration dependent luminescence decay properties of the red emission.
The luminescence decay curves of the 670 nm red emission of Li2MgZr0.996−xO4:Mn0.0044+,Gax3+ (x = 0.00, 0.05, 0.10, 0.15, 0.20, 0.25, 0.30, 0.35, 0.40, 0.45, 0.50) were measured under excitation of 468 nm light with pulsed duration of 1.5 μs, shown in Fig. 7. The mean lifetime τm can be calculated based on the formula:51
 | (1) |
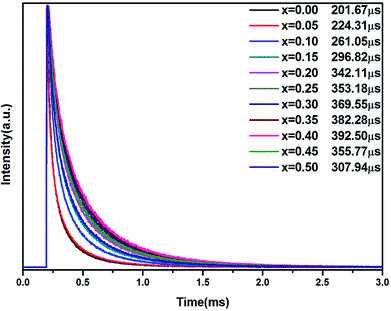 | ||
| Fig. 7 Decay curves of LMZO:Mn0.0044+,Gax3+ (x = 0.00, 0.05, 0.10, 0.15, 0.20, 0.25, 0.30, 0.35, 0.40, 0.45, 0.50) phosphors (λex = 468 nm; λem = 670 nm). | ||
QE is one of important performance indexes of phosphors. Therefore, QE of LMZO:Mn0.044+,Ga0.403+ phosphor under excitation of 468 nm has also been measured and the measured QE value is 25.3%. This indicates that the further research role is to improve its QE in order to get applications in W-LEDs.
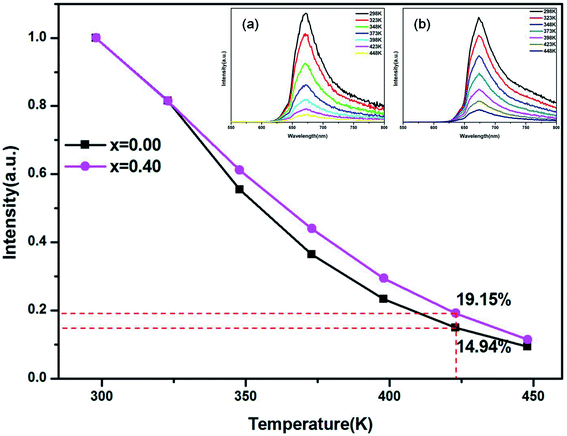
Additionally, the thermal stability of the LMZO:Mn0.044+,Ga0.403+ phosphor has also been studied. Fig. 8 shows the integrated emission intensity of the LMZO:Mn0.044+,Ga0.403+ and LMZO:Mn0.0044+,Ga0.003+ phosphors under 468 nm excitation as a function of temperature. The temperature-dependent emission spectra of (a) LMZO:Mn0.0044+,Ga0.003+ and (b) LMZO:Mn0.0044+,Ga0.403+ phosphors in the temperature range of 298–448 K have also been given as insets in Fig. 8. As demonstrated in the insets of Fig. 8, the positions of the emission bands did not show any distinct change with increasing temperature, whereas the PL intensity gradually reduced owing to the thermal quenching effect. It can be seen that the PL intensity of LMZO:Mn0.0044+,Ga0.403+ phosphor at 423 K was about 19.15% of that at room-temperature, which is better than the value of 14.94% of LMZO:Mn0.044+,Ga0.003+ phosphor. The result indicates that the thermal stability of the phosphor can also be improved after doping with Ga3+ ions.
The activation energy for the aforementioned thermal quenching can be determined by using the following equation:52
 | (2) |
4. Conclusions
In summary, LMZO:Mn0.0044+,Gax3+ (x = 0.00, 0.05, 0.10, 0.15, 0.20, 0.25, 0.30, 0.35, 0.40, 0.45, 0.50) phosphors were synthesized via conventional high-temperature solid-state reaction and the influence of Ga3+ doping on luminescence properties of Mn4+ in LMZO has been investigated. The prepared phosphor can exhibit deep red emission in region of 620–800 nm with peak at 670 nm, under excitation of both ultraviolet-violet and blue-green light from 300 to 550 nm. The luminescence intensity of LMZO:Mn4+ can be significantly improved by doping Ga3+ ions, especially under blue excitation. The optimum Ga3+ doping concentration of LMZO:Mn0.0044+,Gax3+ is determined to be x = 0.40. At x = 0.40, the red emission of Mn4+ is enhanced by 6.68 times and 13.0 times under 352 nm and 468 nm excitation, respectively, as compared with the Ga3+ un-doped sample. Moreover, the thermal stability of the phosphor has also been improved with the introduction of Ga3+ ions. The improved luminescence performance is attributed to the enhanced stability of Mn4+ ions in the host and the lowered symmetry of Mn4+ sites because of Ga3+ doping. The work might provide important and meaningful reference to seek high-performance Mn4+ doped oxide phosphors for W-LEDs application based on blue-emitting InGaN chip.Conflicts of interest
There are no conflicts to declare.Acknowledgements
This work was supported by the National Science Foundation of China (No. 11674272 & 51372214) and the National Natural Science Foundation of China and Guangdong Province (U1401241).Notes and references
- P. Pust, V. Weiler, C. Hecht, A. Tucks, A. S. Wochnik, A. K. Henss, D. Wiechert, C. Scheu, P. J. Schmidt and W. Schnick, Nat. Mater., 2014, 13, 891–896 CrossRef CAS PubMed.
- K. Li, M. Shang, H. Lian and J. Lin, J. Mater. Chem. C, 2016, 4, 5507–5530 RSC.
- J. Y. Park, J. S. Joo, H. K. Yang and M. Kwak, J. Alloys Compd., 2017, 714, 390–396 CrossRef CAS.
- Y. Chen, F. Pan, M. Wang, X. Zhang, J. Wang, M. Wu and C. Wang, J. Mater. Chem. C, 2016, 4, 2367–2373 RSC.
- P. Pust, P. J. Schmidt and W. Schnick, Nat. Mater., 2015, 14, 454–458 CrossRef CAS PubMed.
- H. M. Zhu, C. C. Lin, W. Q. Luo, S. T. Shu, Z. G. Liu, Y. S. Liu, J. T. Kong, E. Ma, Y. G. Cao, R. S. Liu and X. Y. Chen, Nat. Commun., 2014, 5, 4312–4321 CrossRef CAS PubMed.
- J. S. Kim, P. E. Jeon, Y. H. Park, J. C. Choi, H. L. Park, G. C. Kim and T. W. Kim, Appl. Phys. Lett., 2004, 85, 3696–3698 CrossRef CAS.
- Z. D. Hao, Z. D. Zhang, Z. D. Zhang, Z. D. Sun, Z. D. Luo, Z. D. Lu and Z. D. Wang, Appl. Phys. Lett., 2007, 90, 261113 CrossRef.
- Z. D. Xie, N. Hirosaki and N. Takeda, Appl. Phys. Express, 2009, 2, 022401–022403 CrossRef.
- J. Y. Han, W. B. Im, G. Y. Lee and D. Y. Jeon, J. Mater. Chem. C, 2012, 22, 8739–8798 Search PubMed.
- W. Lv, W. Z. Lv, Q. Zhao, M. M. Jiao, B. Q. Shao and H. P. You, Inorg. Chem., 2014, 53, 11985–11990 CrossRef PubMed.
- W. B. Park, S. P. Singh, C. Yoon and K. S. Sohn, J. Mater. Chem., 2012, 22, 14068–14075 RSC.
- S. Yamada, H. Emoto, M. Ibukiyama and N. Hirosaki, J. Eur. Ceram. Soc., 2012, 32, 1355–1358 CrossRef CAS.
- Y. Q. Li, N. Hirosaki, R. J. Xie, T. Takeda and M. Mitomo, Chem. Mater., 2008, 20, 6704–6714 CrossRef CAS.
- X. Qin, X. W. Liu, W. Huang, M. Bettinelli and X. G. Liu, Chem. Rev., 2017, 117, 4488–4527 CrossRef CAS PubMed.
- J. S. Zhong, D. Q. Chen, Y. Zhou, Z. Y. Wan, M. Y. Ding, W. F. Bai and Z. G. Ji, Dalton Trans., 2008, 45, 4762–4770 RSC.
- B. Wang, H. Lin, J. Xu, H. Chen and Y. S. Wang, ACS Appl. Mater. Interfaces, 2014, 6, 22905–22913 CrossRef CAS PubMed.
- D. Q. Chen, Y. Zhou, W. Xu, J. S. Zhong, Z. G. Jia and W. D. Xiang, J. Mater. Chem. C, 2014, 4, 1704–1712 RSC.
- H. Chen, H. Lin, Q. M. Huang, F. Huang, J. Xu, B. Wang, Z. B. Lin, J. C. Zhou and Y. S. Wang, J. Mater. Chem. C, 2016, 4, 2374–2381 RSC.
- X. Ding, Q. Wang and Y. Wang, Phys. Chem. Chem. Phys., 2016, 18, 8088–8097 RSC.
- X. Y. Jiang, Z. Chen, S. M. Huang, J. G. Wang and Y. X. Pan, Dalton Trans., 2014, 43, 9414–9418 RSC.
- Y. K. Xu and S. Adachi, J. Appl. Phys., 2014, 105, 013525–013530 CrossRef.
- T. Takahashi and S. Adachi, J. Electrochem. Soc., 2008, 155, E183–E188 CrossRef CAS.
- L. Huang, Y. W. Zhu, X. J. Zhang, R. Zou, F. J. Pan, J. Wang and M. M. Wu, Chem. Mater., 2016, 28, 1495–1502 CrossRef CAS.
- J. S. Zhong, D. Q. Chen, X. Wang, L. F. Chen, H. Yu, Z. G. Ji and W. D. Xiang, J. Alloys Compd., 2016, 662, 232–239 CrossRef CAS.
- B. Wang, H. Lin, F. Huang, J. Xu, H. Chen, Z. B. Lin and Y. S. Wang, Chem. Mater., 2016, 28, 3515–3524 CrossRef CAS.
- R. P. Cao, J. J. Huang, X. F. Ceng, Z. Y. Luo, W. Ruan and Q. L. Hu, Ceram. Int., 2016, 42, 13296–13300 CrossRef CAS.
- Y. H. Jin, Y. H. Hu, H. Y. Wu, H. Duan, L. Chen, Y. R. Fu, G. F. Ju, Z. F. Mu and M. He, Chem. Eng. J., 2016, 288, 596–607 CrossRef CAS.
- D. Q. Chen, S. Liu, Y. Zhou, Z. Y. Wan, P. Huang and Z. G. Jia, J. Mater. Chem. C, 2016, 4, 9044–9048 RSC.
- W. Shu, L. L. Jiang, S. G. Xiao, X. L. Yang and J. W. Ding, Mater. Sci. Eng., B, 2012, 177, 274–277 CrossRef CAS.
- K. Seki, S. Kamei, K. Uematsu, T. Ishigaki, K. Toda and M. Sato, J. Ceram. Process Res., 2013, 14, s67–s70 Search PubMed.
- Z. X. Qiu, T. T. Luo, J. L. Zhang, W. L. Zhou, L. P. Yu and S. X. Xun, J. Lumin., 2015, 158, 130–135 CrossRef CAS.
- S. J. Lee, J. Jung, J. Y. Park, H. M. Jang, Y. R. Kim and J. K. Park, Mater. Lett., 2013, 111, 108–111 CrossRef CAS.
- E. Ö ztürk and N. O. Kalaycioglu, Mater. Res. Bull., 2012, 47, 1138–1141 CrossRef.
- E. Ö ztürk and N. O. Kalaycioglu, Solid State Phenom., 2015, 230, 217–220 Search PubMed.
- E. Circir and N. O. Kalaycioglu, J. Therm. Anal. Calorim., 2012, 110, 1179–1183 CrossRef CAS.
- N. O. Kalaycioglu and E. Ö ztürk, J. Therm. Anal. Calorim., 2012, 111, 273–277 CrossRef.
- E. Ö ztürk, N. O. Kalaycioglu and S. Dayan, J. Therm. Anal. Calorim., 2014, 117, 573–578 CrossRef.
- R. Cao, Z. Shi, G. Quan, T. Chen, S. Guo, Z. Hu and P. Liu, J. Lumin., 2017, 188, 577–581 CrossRef CAS.
- M. Castellanos, A. R. West and W. B. Reid, Acta Crystallogr., Sect. C: Cryst. Struct. Commun., 2016, 41, 1707–1709 CrossRef.
- R. D. Shannon, Acta Crystallogr., Sect. A: Cryst. Phys., Diffr., Theor. Gen. Crystallogr., 2016, 32, 751–767 CrossRef.
- T. Sasaki, J. Fukushima, Y. Hayashi and H. Takizawa, J. Lumin., 2017, 188, 101–106 CrossRef CAS.
- L. Chen, X. Deng, E. Zhao, X. Chen, S. Xue, W. Zhang, S. Chen, Z. Zhao, W. Zhang and T.-S. Chan, J. Alloys Compd., 2014, 613, 312–316 CrossRef CAS.
- Y. Chen, M. Wang, J. Wang, M. M. Wu and C. X. Wang, J. Solid State Light., 2014, 1, 15 CrossRef.
- M. Brik, S. Camardello and A. Srivastava, ECS J. Solid State Sci. Technol., 2015, 4, R39–R43 CrossRef CAS.
- K. Li, H. Lian and R. V. Deun, Dalton Trans., 2017, 00, 1–4 Search PubMed.
- L. Li, Y. Pan, Z. Chen, S. Huang and M. Wu, RSC Adv., 2017, 7, 14868–14875 RSC.
- M. Medic, M. Brik, G. Dražić, Ž. Antić, V. Lojpur and M. Dramićanin, J. Phys. Chem. C, 2015, 119, 724–730 CrossRef CAS.
- R. Cao, J. Zhang, W. Wang, Z. Hu, T. Chen, Y. Ye and X. Yu, Mater. Res. Bull., 2017, 87, 109–113 CrossRef CAS.
- L. Wang, Z. Dai, R. Zhou, B. Qu and X. C. Zeng, Phys. Chem. Chem. Phys., 2018, 20, 16992–16999 RSC.
- H. Jing, C. Guo, G. Zhang, X. Su, Z. Yang and J. H. Jeong, J. Mater. Chem., 2012, 22, 13612–13618 RSC.
- S. Bhushan and M. Chukichev, J. Mater. Sci. Lett., 1988, 7, 319–321 CrossRef CAS.
| This journal is © The Royal Society of Chemistry 2019 |

