 Open Access Article
Creative Commons Attribution 3.0 Unported Licence
A novel nitrogen heterocycle platform-based highly selective and sensitive fluorescence chemosensor for the detection of Al3+ and its application in cell imaging†
Zengchen Liu *,
Shujing Li,
Genwu Ge,
Yanxia Li,
Chunxiang Zhao,
Hui Zhang* and
Zhiguang Yang
College of Chemistry and Chemical Engineering, Henan Key Laboratory of Rare Earth Functional Materials, International Joint Research Laboratory for Biomedical Nanomaterials of Henan, The Key Laboratory of Rare Earth Functional Materials and Applications, Zhoukou Normal University, Zhoukou 466001, PR China. E-mail: liuzengchen@zknu.cn; hxzhanghui2005@163.com
First published on 12th February 2019
Abstract
In the study, a highly selective and sensitive fluorescence sensor derived from nitrogen heterocycle was synthesized and characterized. By the fluorescence experiments, it was found to show a higher response toward Al3+ than other commonly coexistent metal ions in C2H5OH/H2O media (pH = 7.2). Moreover, the large binding constant (3.44 × 10¹⁴ M−1) between Al3+ and the sensor was calculated by fluorescence titration experiment. In addition, the synergistic effect mechanism due to photoinduced electron transfer (PET) and C![[double bond, length as m-dash]](https://www.rsc.org/images/entities/char_e001.gif) N isomerization was deduced according to the fluorescence behavior. In addition, the fluorescence imaging in living cells was studied systemically, which exhibited high fluorescence sensing activity toward Al3+.
N isomerization was deduced according to the fluorescence behavior. In addition, the fluorescence imaging in living cells was studied systemically, which exhibited high fluorescence sensing activity toward Al3+.
Introduction
Recently, the highly selective and sensitive fluorescence chemsensors for detecting metal ions have attracted significant attention.1–7 This is because some relevant metal elements such as copper, zinc, mercury, chromium, and aluminium play very important roles in different organisms and the environment, which are closely related to some health and pollution problems. Thus, the monitoring of metal ions is of great significance. Among these common metals, aluminium is a non-essential metal element for bio-organisms. According to the reports of the World Health Organization, the average daily human intake of aluminium is approximately 3–10 mg.8 At present, aluminium is a proven neurotoxin, and the abnormal content of aluminium can cause many health hazards such as osteomalacia, Alzheimer's disease, and breast cancer. It can also damage the brain and kidneys.9–11 In addition, beyond the permissible concentration criterion of aluminium, the environment is adversely affected because it can enter the living organisms through the biosphere to induce the death of plants, soil pollution, and even diseases in humans.12–17 Due to the inadequate understanding of aluminium, it remains an important research topic. Thus, there is a considerable need for designing highly selective fluorescence sensors, which can dynamically and in real-time detect and rapidly analyze the aluminium element in biological and environmental system. In the living organism's environment, aluminium is mainly in the form of ions. Its ionic form also widely exists in the natural environment. Moreover, aluminium ion mainly exists in the aqueous system under physiological pH value condition. Therefore, it is a significant task to design the fluorescence sensor for Al3+ in aqueous media. To date, some fluorescence sensors for aluminium ion derived from organic molecules have been designed and reported.18–21 Consequently, considerable efforts need to be devoted for developing fluorescence sensors for Al3+ in aqueous media.22,23When aiming at the rational development of highly selective fluorescence sensors for targeting aluminium ion, the choice of binding molecules is the dominant factor because in a complicated system many metal ions such as Fe3+, Co2+, and Cu2+ can interfere with the aluminium binding.24,25 Thus, it is very important to construct sensitive fluorescence chemosensors for aluminium ion in aqueous media. In continuation of our research topic based on metal ion fluorescence sensors,26,27 in the present investigation, a novel nitrogen heterocycle is developed to increase the selectivity and sensitivity for detecting Al3+. According to the spectral analysis, the fluorescence sensor exhibited high sensing property for Al3+ over other metal ions in the aqueous media (pH = 7.2). Compared with some reported fluorescence sensors for Al3+, the sensor derived from the heterocyclic compound exhibited unusual double ion coordination structures. Also, in the probe there are two highly efficient fluorophores, which are helpful in enhancing the luminescence efficiency. Moreover, the sensing mechanism was deduced to be due to the synergistic effect of photoinduced electron transfer (PET) and C![[double bond, length as m-dash]](https://www.rsc.org/images/entities/char_e001.gif) N isomerization, which arose from the coordination interaction between Al3+ and the sensor.
N isomerization, which arose from the coordination interaction between Al3+ and the sensor.
Results and discussion
Fluorescence selectivity and competition experiments
The fluorescence selectivity activities toward various metal ions (Al3+, Cu2+, Zn2+, Cd2+, Hg2+, Mg2+, K+, Mn2+, Co2+, Cr3+, Fe3+) were investigated in C2H5OH/H2O (4![[thin space (1/6-em)]](https://www.rsc.org/images/entities/char_2009.gif) :
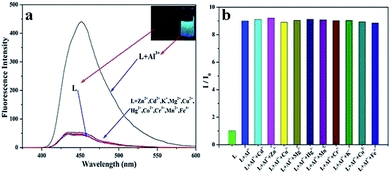
:![[thin space (1/6-em)]](https://www.rsc.org/images/entities/char_2009.gif) 1) solution. As shown in Fig. 1a, upon addition of various metal ions, only Al3+ lead to the significant blue fluorescence signal. Except for the fluorescence increase for Al3+, other metal ions could not cause obvious fluorescence changes in L. It proved that the interaction between Al3+ and L gave rise to the large enhancement of fluorescence. The fluorescence selectivity behavior primarily indicated that L could act as a fluorescence probe for Al3+ under C2H5OH/H2O environment and physiological pH. This aqueous condition was an obvious advantage of the sensor. Moreover, to illustrate the high selectivity of L toward Al3+, the fluorescence images were also taken (Fig. 1a inset). The sensor L exhibited no fluorescence under UV light. Upon the addition of Al3+, the solution showed a remarkable light blue fluorescence, which indicated that L could act as a highly selective fluorescence sensor for Al3+ in C2H5OH/H2O media.
1) solution. As shown in Fig. 1a, upon addition of various metal ions, only Al3+ lead to the significant blue fluorescence signal. Except for the fluorescence increase for Al3+, other metal ions could not cause obvious fluorescence changes in L. It proved that the interaction between Al3+ and L gave rise to the large enhancement of fluorescence. The fluorescence selectivity behavior primarily indicated that L could act as a fluorescence probe for Al3+ under C2H5OH/H2O environment and physiological pH. This aqueous condition was an obvious advantage of the sensor. Moreover, to illustrate the high selectivity of L toward Al3+, the fluorescence images were also taken (Fig. 1a inset). The sensor L exhibited no fluorescence under UV light. Upon the addition of Al3+, the solution showed a remarkable light blue fluorescence, which indicated that L could act as a highly selective fluorescence sensor for Al3+ in C2H5OH/H2O media.
The high selectivity of L toward Al3+ was also investigated by the fluorescence competitive experiments with other cations. 10 equivalent Al3+ was added to the C2H5OH/H2O solution of L, then equivalent amount of other metal ions were also added into the same solution. The change in the fluorescence intensities was recorded. The histogram of the fluorescence changes is shown in Fig. 1b. As shown in the histogram, with addition of other metal ions, no significant variation in the fluorescence emission was observed by comparison with the fluorescence of L + Al3+. All the results indicated the high fluorescence selectivity of L towards Al3+ over other coexistent metal ions.
Fluorescence titration and UV-Vis spectrum investigation
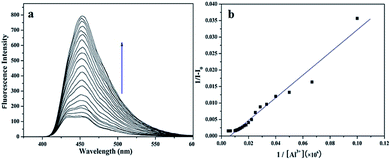
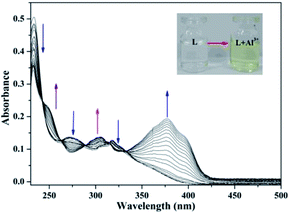
Fluorescence titration experiment (Fig. 2a) of the sensor with Al3+ was performed at room temperature. Upon the addition of Al3+, the fluorescence signal at 450 nm was significantly enhanced. It explicitly proved that the binding between the sensor and Al3+ induced the change in the fluorescence of the sensor, which was in concurrence with the increase of the fluorescence intensity. In addition, as shown in Fig. 2b, the association constant between the sensor and Al3+ was estimated to be 3.44 × 10¹⁴ M−1 by fitting the data to the Benesi–Hildebrand expression with a good linear relationship, which demonstrated the high binding affinity between sensor and Al3+.The UV-Vis absorption spectrum of the sensor and Al3+ (pH = 7.2) was shown in Fig. 3, which exhibited the characteristic absorption of molecule L in the range 200–330 nm. With the addition of Al3+, the intensity of the absorption peaks at 230 nm, 275 nm and 320 nm decreased significantly. Simultaneously, the absorption intensity at 250 nm, 300 nm and 375 nm increased. The characteristic changes in the peaks (red shift) clearly indicated the coordination interaction between L and Al3+. This is because the coordination between the sensor and Al3+ lead to the energy increase of the n–π* transition from L, which resulted in the change in the UV-Vis spectrum. In addition, the new absorption band at 375 nm corresponded to the pale yellow color of the L–Al3+ solution (Fig. 3 inset).
Fluorescence emission mechanism and detection limit
In accordance with the reported coordination sites, the fluorescence sensor was most likely to chelate with Al3+ via its hydroxyl O, imino N, and N atoms from L. The predicted coordination mode is shown in Fig. 4. In addition, the supposed fluorescence mechanism was proposed (Fig. 4), which is ascribed to the synergistic effect due to photoinduced electron transfer (PET) and C![[double bond, length as m-dash]](https://www.rsc.org/images/entities/char_e001.gif) N isomerization processes between L and Al3+. Before L coordinated with Al3+, the solution of L exhibited no fluorescence. With the addition of Al3+, the free rotation of the benzene ring of paeonol and quinoline ring was restained, which was accompanied by the enhancement of the planarity and appearance of fluorescence. To evaluate the sensitivity of the sensor for Al3+, the detection limit of the fluorescence sensor for recognizing Al3+ was also tested through fluorescence spectroscopy. The fluorescence titration experiment of L with Al3+ demonstrated that the detection of Al3+ was at the magnitude level of 0.01 ppm, which is suitable for detecting Al3+ in living organisms and environmental samples.
N isomerization processes between L and Al3+. Before L coordinated with Al3+, the solution of L exhibited no fluorescence. With the addition of Al3+, the free rotation of the benzene ring of paeonol and quinoline ring was restained, which was accompanied by the enhancement of the planarity and appearance of fluorescence. To evaluate the sensitivity of the sensor for Al3+, the detection limit of the fluorescence sensor for recognizing Al3+ was also tested through fluorescence spectroscopy. The fluorescence titration experiment of L with Al3+ demonstrated that the detection of Al3+ was at the magnitude level of 0.01 ppm, which is suitable for detecting Al3+ in living organisms and environmental samples.
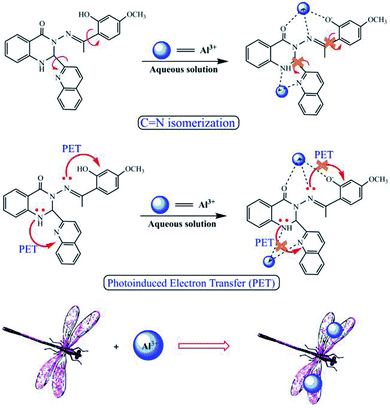 | ||
| Fig. 4 The deductive mechanism and fluorescence sensing process by L for Al3+ using fluorescence spectroscopy. | ||
NMR and MS titration experiments
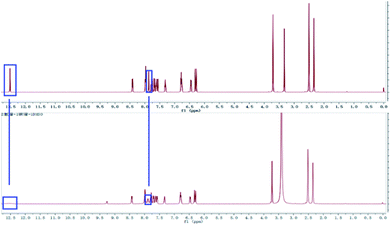
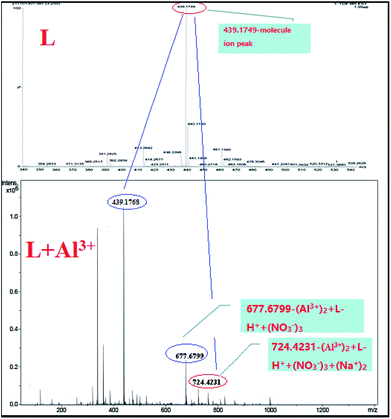
To confirm the coordination ratio between L and Al3+, the NMR and MS titrations were tested systemically. According to the 1H NMR titration of the sensor with Al3+ (Fig. 5), the chemical shift (δ = 12.52) due to the reactive hydrogen of the hydroxide radical disappeared. In addition, the chemical shift (δ = 7.87) due to the reactive hydrogen of the imino group saw a marked change with a decreasing trend. These changes in the NMR signals indicated that the two groups (–OH and –NH–) could be acting as the coordination sites for Al3+. Also, in the process of coordination, the reactive hydrogen atom from the –OH is released. Moreover, the coordination modes were demonstrated by the HRESI-MS titration (Fig. 6). The MS peak at 439.1749 was the molecular ion peak of L. After the addition of Al3+, the new MS peaks at 677.6799 ((Al3+)2 + L–H+ + (NO3−)3) and 724.4231 ((Al3+)2 + L–H+ + (NO3−)3 + 2Na+) were accompanied by the generation of a new metal complex molecule, which emerged from the 1![[thin space (1/6-em)]](https://www.rsc.org/images/entities/char_2009.gif) :
:![[thin space (1/6-em)]](https://www.rsc.org/images/entities/char_2009.gif) 2 coordination mode between L and Al3+.
2 coordination mode between L and Al3+.
Cell fluorescence microscopy, cytotoxicity, and simple filter paper chromatography analysis
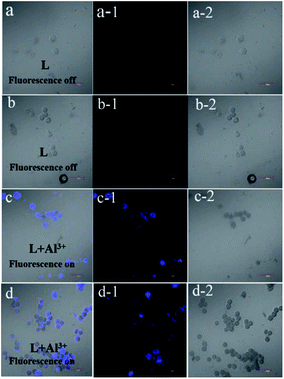
The fluorescence microscopy images of HeLa cells with L and L–Al3+ demonstrated the sensor's ability for sensing Al3+ in biological systems. The HeLa cells were treated with L for 30 min and the fluorescence signal was recorded. The HeLa cells showed no fluorescence signals. Then, the aqueous solution of Al3+ was added to the HeLa cells treated with a solution of L. As shown in Fig. 7, the HeLa cells showed intense blue fluorescence, and the cells were also labelled clearly. The results suggested that the sensor could permeate the plasma membrane of the HeLa cells and give specific blue fluorescence signal in the presence of Al3+. The experiment demonstrated that L could act as a highly selective fluorescence sensor for Al3+ in biological systems. Moreover, the cytotoxicity (HeLa cells and HepG2 cells) of L was tested by CCK8 methods. As shown in Fig. 8, with increasing concentration (10 μM, 20 μM, 30 μM, 40 μM, and 50 μM) of L, the inhibition rate was lower for the HeLa cells compared with the HepG2 cells. Under the condition of high concentration (50 μM), the inhibition rate for the HepG2 cells was still lower than 35%. This showed that the sensor was suitable for use for a variety of biological applications. In addition, simple paper chromatography was performed to evaluate the application of the sensor in environmental samples. As shown in Fig. 9, the paper chromatogram soaked by the sensor solution could detect Al3+ in a low concentration aluminium ion solution.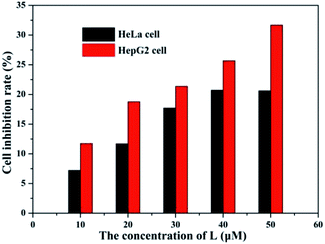 | ||
| Fig. 8 The cytotoxicity of L for the HeLa and HepG2 cells at various concentration (10, 20, 30, 40, and 50 μM). | ||
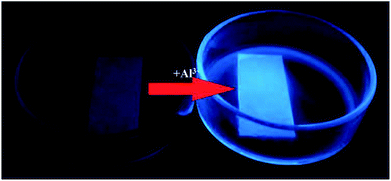 | ||
| Fig. 9 The fluorescence change of the filter paper in the process of sensing Al3+ in C2H5OH/H2O media. | ||
Experimental
Materials
All the chemicals containing solvents were of reagent grade and were used without further purification. The HeLa cells were provided by the Bioeagle Technology Limited Corporation, Wuhan, P. R. China.Synthesis and characterization of the nitrogen heterocycle (L)
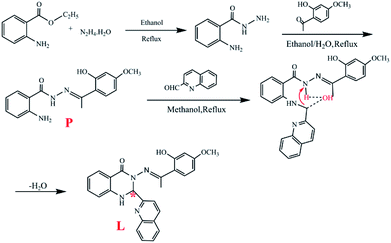
The synthetic routine is shown in Scheme 1.The precursor (P) of L was synthesized and characterized by the reported method and was used without further characterization.28
A methanol solution (5.0 mL) of quinoline-2-carbaldehyde (0.1 mol, 0.157 g) was added to another methanol solution (10 mL) containing P (0.1 mol, 0.327 g). Then, the solution was refluxed for 10 h and cooled to room temperature, which lead to the appearance of a white precipitate. The mixture was filtered and dried under vacuum. Recrystallization from CH3OH/H2O (v![[thin space (1/6-em)]](https://www.rsc.org/images/entities/char_2009.gif) :
:![[thin space (1/6-em)]](https://www.rsc.org/images/entities/char_2009.gif) v = 1
v = 1![[thin space (1/6-em)]](https://www.rsc.org/images/entities/char_2009.gif) :
:![[thin space (1/6-em)]](https://www.rsc.org/images/entities/char_2009.gif) 2) gave the target product L which was dried under vacuum. Yield: 75%, mp: 260–261 °C. 1H NMR (DMSO–d6 400 MHz, Fig. 5): δ 12.52 (1H, s, –O18–H), δ 8.10–8.12 (1H, d, –C9–H), δ 7.93–7.99 (2H, m, –C5,6–H), δ 7.87 (1H, s, –N8–H), δ 7.75–7.78 (2H, m, –C4,7–H), δ 7.67–7.69 (1H, d, –C1–H), δ 7.60–7.63 (1H, m, –C13–H), δ 7.56–7.58 (1H, d, –C10–H), δ 7.30–7.33 (1H, m, –C14–H), δ 6.75–6.79 (2H, m, –C2,3–H), δ 6.44–6.46 (1H, d, –C11–H), δ 6.27–6.31 (2H, d, –O12,15–H), δ 3.71 (3H, s, –C16–H), δ 2.31 (3H, s, –O17–H). 13C NMR (DMSO–d6 400 MHz, Fig. S1†): 174.06, 163.24, 161.90, 160.76, 158.94, 147.03, 137.93, 134.43, 131.54, 130.50, 120.42, 128.38, 128.03, 127.52, 119.48, 118.25, 114.99, 114.35, 112.14, 106.68, 101.64, 76.33, 55.77, 17.45. In the compound, there is a chiral carbon atom (Scheme 1, asterisk). HRESI-MS for C26H22O3N4: 439.1749 (molecular ion peak). The solid powder of L exhibited a relatively regular columnar configuration as seen in the SEM images (Fig. 10(C)–(C-2)).
2) gave the target product L which was dried under vacuum. Yield: 75%, mp: 260–261 °C. 1H NMR (DMSO–d6 400 MHz, Fig. 5): δ 12.52 (1H, s, –O18–H), δ 8.10–8.12 (1H, d, –C9–H), δ 7.93–7.99 (2H, m, –C5,6–H), δ 7.87 (1H, s, –N8–H), δ 7.75–7.78 (2H, m, –C4,7–H), δ 7.67–7.69 (1H, d, –C1–H), δ 7.60–7.63 (1H, m, –C13–H), δ 7.56–7.58 (1H, d, –C10–H), δ 7.30–7.33 (1H, m, –C14–H), δ 6.75–6.79 (2H, m, –C2,3–H), δ 6.44–6.46 (1H, d, –C11–H), δ 6.27–6.31 (2H, d, –O12,15–H), δ 3.71 (3H, s, –C16–H), δ 2.31 (3H, s, –O17–H). 13C NMR (DMSO–d6 400 MHz, Fig. S1†): 174.06, 163.24, 161.90, 160.76, 158.94, 147.03, 137.93, 134.43, 131.54, 130.50, 120.42, 128.38, 128.03, 127.52, 119.48, 118.25, 114.99, 114.35, 112.14, 106.68, 101.64, 76.33, 55.77, 17.45. In the compound, there is a chiral carbon atom (Scheme 1, asterisk). HRESI-MS for C26H22O3N4: 439.1749 (molecular ion peak). The solid powder of L exhibited a relatively regular columnar configuration as seen in the SEM images (Fig. 10(C)–(C-2)).
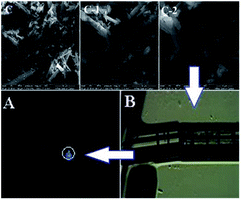 | ||
| Fig. 10 The SEM images (C, C-1, and C-2) and fluorescence microscopy images (A and B) of the crystal of L. | ||
Moreover, the X-ray diffraction measurement for L (size: 0.40 mm × 0.10 mm × 0.10 mm) was performed on a Bruker SMART APEX II CCD diffractometer equipped with a graphite monochromatized Mo Kα radiation (λ = 0.71073 Å) by using φ–ω scan mode. Semi-empirical absorption correction was applied to the intensity data using the SADABS program. The structure was solved by direct methods and refined by full matrix least-square on F2 using the SHELXTL-97 program. All non-hydrogen atoms were refined anisotropically. All H atoms were positioned geometrically and refined using a riding model. Details of the crystal parameters, data collection, and refinements for L are summarized in Table 1.
| L | |
| Empirical formula | C26H22N4O3 |
| Formula weight | 438.48 |
| T/K | 296 |
| Crystal system | Triclinic |
| Space group | P![[1 with combining macron]](https://www.rsc.org/images/entities/char_0031_0304.gif) |
| a/nm | 6.4124(14) |
| b/nm | 12.451(3) |
| c/nm | 14.248(3) |
| α/(°) | 101.099(4) |
| β/(°) | 102.349(3) |
| γ/(°) | 94.856(3) |
| V/nm3 | 1.0810(4) |
| Z | 2 |
| Dc (g cm−3) | 1.344 |
| Absorption coefficient/mm−1 | 0.090 |
| F (000) | 458.0 |
| Reflection collected, unique (Rint) | 3780, 2049 |
| Data, restraint, parameter | 2049, 0, 302 |
| Goodness of-fit (GOF) on F2 | 0.997 |
| Residuals R1, wR2 | 0.0563, 0.1514 |
Single crystal X-ray structure (Fig. 11 A, ORTEP drawing) analysis of L reveals that it crystallizes in the triclinic P![[1 with combining macron]](https://www.rsc.org/images/entities/char_0031_0304.gif) space group. The crystal structure of L is in accordance with the structure from NMR and HRESI-MS, which exhibited distorted non-planar configurations. In solution, L showed no fluorescence, however, its solid crystal (Fig. 10 B) showed blue fluorescence (Fig. 10 A). The distorted rotation (Fig. 11 B) of the quinoline ring and paeonol in solution was deduced to give rise to the fluorescence quenching.
space group. The crystal structure of L is in accordance with the structure from NMR and HRESI-MS, which exhibited distorted non-planar configurations. In solution, L showed no fluorescence, however, its solid crystal (Fig. 10 B) showed blue fluorescence (Fig. 10 A). The distorted rotation (Fig. 11 B) of the quinoline ring and paeonol in solution was deduced to give rise to the fluorescence quenching.
 | ||
| Fig. 11 The ORTEP drawing of L with 30% thermal ellipsoids (A); the molecular crystal structure of L and H-atoms are omitted for clarity (B). | ||
All spectroscopic measurements were performed in C2H5OH/H2O (4![[thin space (1/6-em)]](https://www.rsc.org/images/entities/char_2009.gif) :
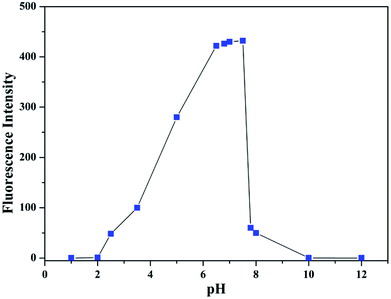
:![[thin space (1/6-em)]](https://www.rsc.org/images/entities/char_2009.gif) 1) solution. To evaluate the influence of pH on the fluorescence, the fluorescence intensity of L at various pH values in the presence of Al3+ was tested (Fig. 12). Under strongly acidic conditions (<2.0) and under alkaline conditions (>8.0), the fluorescence of Al3+–L disappeared. In the range of 6.5 to 7.5, the fluorescence exhibited was stronger. Therefore, by the fluorescence screening experiment, pH = 7.2 was chosen as the appropriate testing pH. In addition, the neutral pH is in concurrence with the pH in physiological conditions. The pH (pH = 7.2) of the solution was controlled by the HEPES buffer solution. Stock solutions (1.0 × 10⁻³ M) of metal ions (metal nitrate) were prepared in double-distilled water. The stock solution of 1.0 × 10⁻³ M was prepared in C2H5OH/H2O (4
1) solution. To evaluate the influence of pH on the fluorescence, the fluorescence intensity of L at various pH values in the presence of Al3+ was tested (Fig. 12). Under strongly acidic conditions (<2.0) and under alkaline conditions (>8.0), the fluorescence of Al3+–L disappeared. In the range of 6.5 to 7.5, the fluorescence exhibited was stronger. Therefore, by the fluorescence screening experiment, pH = 7.2 was chosen as the appropriate testing pH. In addition, the neutral pH is in concurrence with the pH in physiological conditions. The pH (pH = 7.2) of the solution was controlled by the HEPES buffer solution. Stock solutions (1.0 × 10⁻³ M) of metal ions (metal nitrate) were prepared in double-distilled water. The stock solution of 1.0 × 10⁻³ M was prepared in C2H5OH/H2O (4![[thin space (1/6-em)]](https://www.rsc.org/images/entities/char_2009.gif) :
:![[thin space (1/6-em)]](https://www.rsc.org/images/entities/char_2009.gif) 1) and the pH was controlled by the HEPES buffer solution (pH = 7.2). In the titration experiments, each time 2 mL aqueous solution containing 10 μL solution of L (1.0 × 10⁻³ M) was filled in a quartz optical cell of 1 cm optical path length. Then, 10 μL of Al3+ stock solution was added to the compound solution with a micro-pipette. Spectral data were recorded 0.5 min after the addition. In the selectivity experiment, the test samples were prepared by mixing appropriate amounts of the metal ion stock solution into 2 mL C2H5OH/H2O solution of L (10 μL). For fluorescence measurements, excitation wavelength was at 350 nm.
1) and the pH was controlled by the HEPES buffer solution (pH = 7.2). In the titration experiments, each time 2 mL aqueous solution containing 10 μL solution of L (1.0 × 10⁻³ M) was filled in a quartz optical cell of 1 cm optical path length. Then, 10 μL of Al3+ stock solution was added to the compound solution with a micro-pipette. Spectral data were recorded 0.5 min after the addition. In the selectivity experiment, the test samples were prepared by mixing appropriate amounts of the metal ion stock solution into 2 mL C2H5OH/H2O solution of L (10 μL). For fluorescence measurements, excitation wavelength was at 350 nm.
The binding constant for L–Al3+ was calculated by the linear Benesi–Hildebrand expression.29,30
Physical measurement
NMR spectra were recorded on a Varian VR400-MHz spectrometer with TMS as the internal standard. The melting points of the compounds were determined on a Beijing XT4-100X microscopic melting point apparatus. The UV-Vis spectra were recorded on a Perkin-Elmer Lambda-35 UV-Vis spectrophotometer. Fluorescence spectra were obtained on a Cary Eclipse spectrophotometer at room temperature. The fluorescence image of the HeLa cells was obtained using Olympus FV1300 laser confocal fluorescence microscope. The crystal data were collected by the Bruker Smart-Apex-II instrument. The SEM images were obtained by F250 thermal field emission scanning electron microscope.Cell imaging and cytotoxicity
The HeLa cells were cultured in a flask in Dulbecco's modified Eagle's medium supplemented with a heat-inactivated bovine serum (10%), 100 U mL−1 penicillin, and 100 U mL−1 streptomycin and were maintained at 37 °C in a humidified atmosphere (5% CO2 and 95% air). The cells were seeded in a six orifice plate and allowed to adhere for 12 h before treatment. Then, the cells were incubated with fresh media containing 100 μL of the sensor solution (dissolved in DMSO/C2H5OH (1![[thin space (1/6-em)]](https://www.rsc.org/images/entities/char_2009.gif) :
:![[thin space (1/6-em)]](https://www.rsc.org/images/entities/char_2009.gif) 4), 1 mM). After 0.5 h, the growth medium was removed, and the cells were washed with saline solution several times. The cover glass was then mounted on a microscope glass slide and was studied under a microscope. Then, 200 μL fresh water media containing Al(NO3)3 (dissolved in H2O, 1 mM) was added to the above cell solution containing L. After the cells were incubated for 0.5 h, they were washed with saline solution several times, and were then studied under a microscope. Imaging was performed using an Olympus FV1300 laser confocal fluorescence microscope (excitation wavelength: 355 ± 10 nm).
4), 1 mM). After 0.5 h, the growth medium was removed, and the cells were washed with saline solution several times. The cover glass was then mounted on a microscope glass slide and was studied under a microscope. Then, 200 μL fresh water media containing Al(NO3)3 (dissolved in H2O, 1 mM) was added to the above cell solution containing L. After the cells were incubated for 0.5 h, they were washed with saline solution several times, and were then studied under a microscope. Imaging was performed using an Olympus FV1300 laser confocal fluorescence microscope (excitation wavelength: 355 ± 10 nm).
The cytotoxicity of L towards the HeLa and HepG2 cells was evaluated by the following procedure. The cultured cells were placed in a sterilized phosphate buffer solution. After that, the cells were treated with the L solution (DMSO solvent) at various concentrations (10, 20, 30, 40, and 50 μM). After incubation for 12 h, 100 μL of CCK8 culture medium solution was added to the above solution, and incubated for 0.5 h. The absorption was measured at 450 nm. The cytotoxicity of L was evaluated by measuring the cell viability, which was achieved with a hemacytometer under a microscope. The cytotoxicity of the solvent was deducted.
Conclusions
In summary, we have fabricated a highly selective fluorescence sensor for Al3+ derived from a nitrogen heterocyclic compound. The fluorescence response mechanism due to the synergistic effect of photoinduced electron transfer (PET) and C![[double bond, length as m-dash]](https://www.rsc.org/images/entities/char_e001.gif) N isomerization was concluded by the fluorescence and energy change processes accompanying the no-fluorescence to intense blue fluorescence states. By structure analysis, it was found to exhibit the unusual double ion coordination configuration. Moreover, the sensor showed high sensitivity for sensing Al3+ in C2H5OH/H2O media. In addition, the cell fluorescence imaging was also investigated with HeLa cells, which exhibited high penetration depth. The coordination sites on the sensor L for binding Al3+ were confirmed by NMR and MS titrations. Such investigations endowed the potential application of sensor for tracking and detecting of Al3+ in biological and environment fields.
N isomerization was concluded by the fluorescence and energy change processes accompanying the no-fluorescence to intense blue fluorescence states. By structure analysis, it was found to exhibit the unusual double ion coordination configuration. Moreover, the sensor showed high sensitivity for sensing Al3+ in C2H5OH/H2O media. In addition, the cell fluorescence imaging was also investigated with HeLa cells, which exhibited high penetration depth. The coordination sites on the sensor L for binding Al3+ were confirmed by NMR and MS titrations. Such investigations endowed the potential application of sensor for tracking and detecting of Al3+ in biological and environment fields.
Conflicts of interest
There are no conflicts to declare.Acknowledgements
This work is supported by the National Science Foundation of China (21701203, 21401218), Youth Backbone Teacher Training Program in Henan Province (2017GGJS144), the Key Science Research Project of Colleges and Universities in Henan Province (Grant No. 17A150057), Young and Middle-aged Backbone Teachers Plan of Zhoukou Normal University, the Scientific Research Innovation Foundation of Zhoukou Normal University (ZKNUA201701), the Science and Technology Research Project of Henan Province (182102310623), supported by the School-based Program of Zhoukou Normal University (ZKNUB1201804).Notes and references
- Y. M. You, Y. J. Han, Y. M. Lee, S. Y. Park, W. W. Nam and S. J. Lippard, J. Am. Chem. Soc., 2011, 133, 11488 CrossRef CAS
.
- J. Han, X. Tang, Y. Wang, R. J. Liu, L. Wang and L. Ni, Spectrochim. Acta, Part A, 2018, 205, 597–602 CrossRef CAS
.
- H. H. Wang, Q. Gan, X. J. Wang, L. Xue, S. H. Liu and H. Jiang, Org. Lett., 2007, 9, 4995 CrossRef CAS PubMed
.
- B. Qiao, S. G. Sun, N. Jiang, S. Zhang and X. J. Peng, Dalton Trans., 2014, 43, 4626 RSC
.
- E. Ranyuk, C. M. Douaihy, A. Bessmertnykh, F. Denat, A. Averin, I. Beletskaya and R. Guilard, Org. Lett., 2009, 11, 987 CrossRef CAS PubMed
.
- M. Zhang, Y. Yang, L. Y. Liu, W. X. Chang and J. Li, Macromolecules, 2016, 49, 844 CrossRef CAS
.
- M. Shyamal, P. Mazumdar, S. Maity, G. P. Sahoo, G. Salgado-Morán and A. Misra, J. Phys. Chem. A, 2016, 120, 210 CrossRef CAS PubMed
.
- J. Barcelo and C. Poschenrieder, Environ. Exp. Bot., 2002, 48, 75 CrossRef CAS
.
- E. L. Que, D. W. Domaille and C. J. Chang, Chem. Rev., 2008, 108, 1517 CrossRef CAS PubMed
.
- A. Becaria, A. Campbell and S. C. Bondy, Toxicol. Ind. Health, 2002, 18, 309 CrossRef CAS PubMed
.
- T. P. Flaten, Brain Res. Bull., 2001, 55, 187 CrossRef CAS PubMed
.
- S. Zheng and J. Yang, Biol. Plant., 2005, 49, 3321 CrossRef
.
- G. Wei, C. J. Hough, Y. Li and J. M. Sarvey, Neurobiology, 2004, 125, 867 CAS
.
- P. F. Good, C. W. Olanow and D. P. Perl, Brain Res., 1992, 593, 343 CrossRef CAS
.
- P. Kidd, M. Llugany, C. Poschenrieder, B. Gunse and J. Barcelo, J. Exp. Bot., 2001, 52, 1339 CAS
.
- D. Perl and A. Brody, Science, 1980, 208, 297 CrossRef CAS
.
- A. Ghosh and D. Das, Dalton Trans., 2015, 44, 11797 RSC
.
- K. Aich, S. Goswami, S. Das and C. D. Mukhopadhyay, RSC Adv., 2015, 5, 31189 RSC
.
- D. F. Qiu, M. M. Li, Q. Zhao, H. W. Wang and C. X. Yang, Inorg. Chem., 2015, 54, 7774 CrossRef CAS
.
- R. Alam, T. Mistri, R. Bhowmick, A. Katarkar, K. Chaudhuri and M. Ali, RSC Adv., 2016, 6, 1268 RSC
.
- X. B. Li, J. Y. Chen and E. J. Wang, Chin. J. Chem., 2014, 32, 429 CrossRef CAS
.
- B. Das, S. Dey, G. P. Maiti, A. Bhattacharjee, A. Dhara and A. Jana, New J. Chem., 2018, 42, 9424 RSC
.
- Z. C. Liu, Y. X. Li, Y. J. Ding, Z. Y. Yang, B. D. Wang, Y. Li, T. R. Li, W. Luo, W. P. Zhu, J. P. Xie and C. J. Wang, Sens. Actuators, B, 2004, 197, 200 CrossRef
.
- H. Z. Su, X. B. Chen and W. B. Fang, Anal. Chem., 2014, 86, 891 CrossRef CAS PubMed
.
- K. Ostrowska, B. Musielak, E. Szneler, Ł. Dudek, M. Gryl and K. Stadnicka, Inorg. Chem., 2015, 54, 8423–8435 CrossRef CAS PubMed
.
- B. D. Wang, J. Hai, Z. C. Liu, Q. Wang, Z. Y. Yang and S. H. Sun, Angew. Chem., Int. Ed., 2010, 27, 4576 CrossRef PubMed
.
- Z. C. Liu, W. J. Yang, Y. X. Li, F. S. Tian and W. P. Zhu, RSC Adv., 2015, 5, 100482 RSC
.
- Z. C. Liu, K. Ren, Y. H. Chen, Y. X. Li, J. P. Xie, Y. J. Ding, L. L. Li, K. Li, W. P. Zhu, W. J. Yang and Z. H. Xu, RSC Adv., 2017, 7, 38160 RSC
.
- H. A. Benesi and J. H. Hildebrand, J. Am. Chem. Soc., 1949, 71, 2703 CrossRef CAS
.
- Z. C. Liu, W. P. Zhu, Y. H. Chen, Y. X. Li, Y. J. Ding, W. J. Yang and K. Li, Dalton Trans., 2015, 44, 16528 RSC
.
Footnote |
| † Electronic supplementary information (ESI) available: The 13C NMR of L. CCDC 1581281. For ESI and crystallographic data in CIF or other electronic format see DOI: 10.1039/c8ra10036e |
| This journal is © The Royal Society of Chemistry 2019 |

