 Open Access Article
Relation between superheated temperature and cooling rate for deep supercooled niobium melt
Hui Sun *a,
Zengyun Jiana,
Bingqing Jiangb,
Junfeng Xua and
Tiantian Zhanga
aSchool of Materials Science and Chemical Engineering, Xi'an Technological University, Xi'an, Shaanxi 710021, China. E-mail: shsszy@126.com
bSchool of Mechatronic Engineering, Xi'an Technological University, Xi'an, Shaanxi 710021, China
First published on 18th February 2019
Abstract
Research into the conditions for forming uniform melt-free crystal sites and the effect of the melt state on solidification behaviors is theoretically significant and has valuable applications. However, there are no quantitative data on these aspects due to rigorous experimental requirements. In this study, the variation of the melt structure at different superheating temperatures and the cooling rate during the deep solidification of cold niobium melt was investigated by a large-scale molecular dynamics simulation method. The solid/liquid coexistence method, the radial distribution function, an energy–temperature analysis, the average energy, an atomic cluster analysis, and a visualization analysis were adopted to analyze the variations in microstructure transitions. The temperature vs. undercooling plots of Nb melt at different superheating temperatures suggested that the metal melt structure should be classified into three regions (regions 1 and 2, each with different melt structures that vary with temperature, and region 3, whose melt structure does not change with temperature); the critical cooling rate of the crystal–amorphous transition was 1.0 × 1012.5 K s−1 and the solidification undercooling increased with increasing superheating temperature until maximal undercooling was obtained. Simultaneously, it was found that the maximal undercooling occurred at ∼0.432Tm (Tm is the melting point) and the maximal superheating occurred at ∼1.216Tm.
Introduction
It is of great significance to study the variation in melt structures with temperature in the deep undercooling of metal melt for understanding the mechanism of metal solidification and facilitating the process.1–7 The macroscopic properties of metals are mainly determined by their microstructure, while the solid structure of materials is closely related to the microstructure of their liquid matrix; therefore, the solid structure of a material is closely related to the microstructure of its parent liquid.8,9 Materials scientists have been researching the correlation between the liquid structure and its corresponding solid structure; however, this has not yet been established due to the uncertainty of the liquid metal structure and many difficulties associated with the determination.10–12 Due to the high melting points of niobium and its alloy,13 niobium is classified as a rare refractory metal in terms of its physical and chemical properties, resource development, and production. Nb has good ductility, thermal conductivity, corrosion resistance, heat resistance, and excellent machining performance, along with a low neutron capture cross section, good physiological resistance, and biocompatibility. Therefore, it is widely used in the steel, superconducting material, aerospace, atomic energy, and electronic industries; medical treatment; and other key fields. High-purity Nb is highly suitable for use in a nuclear reactor,14 as the cladding material of nuclear fuel, to form an alloy with nuclear fuel, and as the structural material of the heat exchanger in a nuclear reactor. Nb is widely used in the aerospace industry to manufacture aero-engine components, gas turbine blades, injection engines, gas turbine engines, rocket components, turbochargers, and heat-resistant burners. To develop and utilize the excellent properties of Nb and its alloys, the solidification process and the correlation between the structure and properties of Nb and its alloys must be studied. Therefore, it is of great significance to study the solidification of metallic Nb for further applications and popularization of the metal and its alloys.The deep undercooling of molten metal is governed by many factors, such as superheated temperature, cooling rate, and holding time. Lin et al.15 performed a simulation study to elucidate the effects of different cooling rates during the solidification of liquid Zn, and found that the glass transition temperature was decreased with decreasing cooling rate. Hou16 studied the effect of different initial temperatures on the microstructure of metallic Na during solidification, and found a nonlinear relationship between the crystallization temperature of Na metal melt and the initial temperature. By using molecular dynamics simulation, Jian et al.17 studied the changes in the microstructure of Al-11.6% Si alloy at different heating temperatures and heat preservation times. Li et al.18 used molecular dynamics simulations to study the process of rapid solidification in TiAl and found that the amorphous phase can be obtained when the cooling rate was not less than 0.02 K ps−1. Geng et al.19 studied the relationship between the solidification interface and temperature and reported that when the critical superheating temperature was higher than the initial temperature, the stability of the solidification interface decreased with increasing temperature. On the other hand, when the critical superheating temperature was lower than the initial temperature, the stability of the solidification interface of the metal melt decreased with increasing temperature. Si et al.20 simulated the influence of the initial temperature on the solidification process of an Al–Cu alloy and found that the homogeneous nucleation subcooling of the solidified alloy increased with increasing initial temperature. Hou et al.21 studied the effect of the cooling rate on the solidification process of liquid aluminum by a large-scale molecular dynamics method. Han et al.22 aimed to achieve deep insight into the phenomenon of phase transformation. Pure copper was taken as an example, the correlation between phase selection of crystal or glass and cooling rate was investigated.
Nb metal has wide application scope; however, it has been challenging to study the evolution and solidification of its liquid microstructure under experimental conditions. Herein we used molecular dynamics simulation to study the microstructure evolution of Nb melt during solidification at different cooling rates and superheating temperatures. The critical cooling rate of Nb metal melt was calculated using the classical nucleation theory (CNT).23 Finally, the melt type after solidification of the Nb metal melt was analyzed. The solid–liquid coexistence technique, an energy–temperature (E–T) curve, the radial distribution function (RDF),24 and atomic cluster and visualization analyses were used to study the microstructure of the solidified Nb melt. The atomic structure was characterized using the Ovito software. To record the different types of atomic structure, the change law of microstructure was analyzed under different conditions.
Computational details
In this study, the solidification process of Nb melt was simulated using the Large-scale Atomic/Molecular Massively Parallel Simulator (LAMMPS) software.25 The cubic primitive cell containing 31![[thin space (1/6-em)]](https://www.rsc.org/images/entities/char_2009.gif) 250 Nb atoms was studied under three-dimensional periodic boundary conditions and by using the EAM potential reported by Fellinger26 in 2010 and the Nosé–Hoover hot bath control temperature and pressure control method.27,28 The numerical integration adopts the Verlet algorithm in the form of velocity, the time step being 0.002 ps. According to the macroscopic constraint condition, the isothermal isobaric NPT ensemble was used for simulation studies.
250 Nb atoms was studied under three-dimensional periodic boundary conditions and by using the EAM potential reported by Fellinger26 in 2010 and the Nosé–Hoover hot bath control temperature and pressure control method.27,28 The numerical integration adopts the Verlet algorithm in the form of velocity, the time step being 0.002 ps. According to the macroscopic constraint condition, the isothermal isobaric NPT ensemble was used for simulation studies.
First, the influence of different cooling rates on the homogeneous nucleation undercooling of metal Nb was investigated. The simulation process was as follows. Crystalline Nb atoms (31![[thin space (1/6-em)]](https://www.rsc.org/images/entities/char_2009.gif) 250 in number) were heated to 3250 K by running 100
250 in number) were heated to 3250 K by running 100![[thin space (1/6-em)]](https://www.rsc.org/images/entities/char_2009.gif) 000 steps and then relaxed over 400
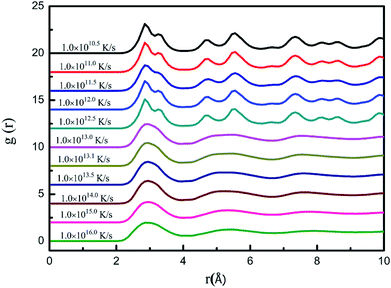
000 steps and then relaxed over 400![[thin space (1/6-em)]](https://www.rsc.org/images/entities/char_2009.gif) 000 steps to achieve a balanced state. Then, the melt was quenched to 50 K using different cooling rates: 1.0 × 1010.5, 1.0 × 1011.0, 1.0 × 1011.5, 1.0 × 1012.0, 1.0 × 1012.5, 1.0 × 1013.0, 1.0 × 1013.1, 1.0 × 1013.5, 1.0 × 1014.0, 1.0 × 1015.0, and 1.0 × 1016.0 K s−1 for 100
000 steps to achieve a balanced state. Then, the melt was quenched to 50 K using different cooling rates: 1.0 × 1010.5, 1.0 × 1011.0, 1.0 × 1011.5, 1.0 × 1012.0, 1.0 × 1012.5, 1.0 × 1013.0, 1.0 × 1013.1, 1.0 × 1013.5, 1.0 × 1014.0, 1.0 × 1015.0, and 1.0 × 1016.0 K s−1 for 100![[thin space (1/6-em)]](https://www.rsc.org/images/entities/char_2009.gif) 000 steps. Finally, the radial analysis, average energy calculation, atomic cluster analysis, and visualization analysis were performed.
000 steps. Finally, the radial analysis, average energy calculation, atomic cluster analysis, and visualization analysis were performed.
Second, the influences of different initial temperatures on the undercooling of the homogeneous nucleation and the structure were investigated. The simulation process can be described as follows. Nb with a BCC structure was heated to different desired superheating temperatures: 3040, 3050, 3054, 3058, 3060, 3065, 3075, 3125, 3135, 3140, 3175, 3195, 3210, 3221, 3234, 3240, 3260, 3274, 3300, 3320, 3343, 3345, 3350, 3364, 3375, 3400, 3410, 3416, 3420, 3427, 3437, 3450, 3500, 3546, 3570, 3610, 3670, 3700, and 3760 K over 100![[thin space (1/6-em)]](https://www.rsc.org/images/entities/char_2009.gif) 000 steps, and the temperature was held over 400
000 steps, and the temperature was held over 400![[thin space (1/6-em)]](https://www.rsc.org/images/entities/char_2009.gif) 000 steps to ensure gradual Nb melting. Then, the system was quenched to 50 K at a cooling rate of 1.0 × 1012.0 K s−1. Finally, the potential energy curves were analyzed to determine the solidification undercooling, and the influences of different superheating temperatures on the undercooling of homogeneous nucleation were investigated.
000 steps to ensure gradual Nb melting. Then, the system was quenched to 50 K at a cooling rate of 1.0 × 1012.0 K s−1. Finally, the potential energy curves were analyzed to determine the solidification undercooling, and the influences of different superheating temperatures on the undercooling of homogeneous nucleation were investigated.
Results and discussion
Verification of the veracity of potential function
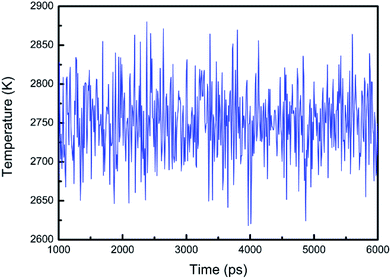
In this study, the solid/liquid coexistence method proposed by Morris et al.29 was mainly used to obtain the melting point of the system. If the initial temperature set by the system is higher than the actual melting temperature of the metal, part of the solid phase in the system will melt away and the kinetic energy of some atoms in the system will be converted into potential energy, following which the temperature of the system will inevitably decrease. If the initial temperature of the system is lower than the actual melting temperature of the metal, the partial liquid phase will solidify. The latent heat of crystallization is generated, following which part of the atomic potential energy in the entire system is converted into kinetic energy, and the temperature of the system increases. Therefore, the initial temperature of the system is higher or lower than the melting temperature of the system in a certain range. In such an NVT ensemble, the system will reach dynamic equilibrium, and the equilibrium temperature of the system will approach the melting point of the melt.The crystalline atoms were analyzed by the potential function proposed by Fellinger in 2010. The temperature is plotted as a function of time for Nb melt in Fig. 1. According to the potential function proposed by Fellinger in 2010, the simulation system contains 31![[thin space (1/6-em)]](https://www.rsc.org/images/entities/char_2009.gif) 250 crystalline Nb atoms, for which the temperature is plotted against the time, with the time step (Fig. 2). It can be seen from the diagram that the temperature of the system fluctuates in the vicinity of a certain temperature value with the passage of time, that is, the simulated melting point of the system is 2750 K. The actual theoretical melting point of metal Nb is 2741 K. The simulated melting point is higher than the experimental value primarily because the melting of the metal usually begins with surface pre-melting, and the temperature of surface pre-melting is lower than the thermodynamic melting point. The simulated melting point is only 0.328% higher than the actual melting point, which proves the feasibility of the method and the correctness of the potential function.
250 crystalline Nb atoms, for which the temperature is plotted against the time, with the time step (Fig. 2). It can be seen from the diagram that the temperature of the system fluctuates in the vicinity of a certain temperature value with the passage of time, that is, the simulated melting point of the system is 2750 K. The actual theoretical melting point of metal Nb is 2741 K. The simulated melting point is higher than the experimental value primarily because the melting of the metal usually begins with surface pre-melting, and the temperature of surface pre-melting is lower than the thermodynamic melting point. The simulated melting point is only 0.328% higher than the actual melting point, which proves the feasibility of the method and the correctness of the potential function.
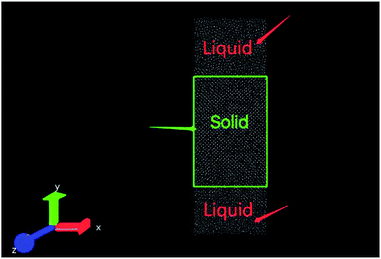 | ||
| Fig. 1 VMD diagram with the melting point of niobium determined via the solid/liquid coexistence method. | ||
Verification of initial liquid equilibrium
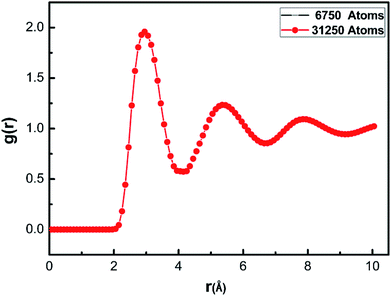
The initial liquid structure has a direct effect on the subsequent solidification process. The time required to reach the equilibrium state varies with the number of atoms in the simulation system. In order to verify whether the initial liquid structure of the simulation system is in the equilibrium state, we used 6750 and 31![[thin space (1/6-em)]](https://www.rsc.org/images/entities/char_2009.gif) 250 Nb atoms, respectively, as the research objects. The molten Nb was transformed to liquid in 100
250 Nb atoms, respectively, as the research objects. The molten Nb was transformed to liquid in 100![[thin space (1/6-em)]](https://www.rsc.org/images/entities/char_2009.gif) 000 steps at 3250 K, and relaxed in 400
000 steps at 3250 K, and relaxed in 400![[thin space (1/6-em)]](https://www.rsc.org/images/entities/char_2009.gif) 000 steps. The final state of the model was verified by comprehensive analysis of the RDF and E–T curve. At 3250 K, the radial distribution function curves (Fig. 3) of the Nb melts are the same even when the number of atoms is different, which indicates that the liquid structure of the two systems with different atom number is the same. Thus, the simulated Nb melt is in the equilibrium state.
000 steps. The final state of the model was verified by comprehensive analysis of the RDF and E–T curve. At 3250 K, the radial distribution function curves (Fig. 3) of the Nb melts are the same even when the number of atoms is different, which indicates that the liquid structure of the two systems with different atom number is the same. Thus, the simulated Nb melt is in the equilibrium state.
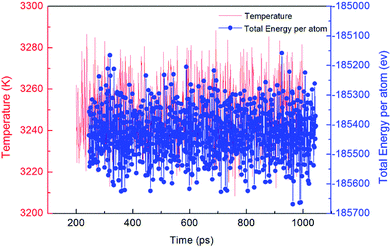
The E–T curve of molten metal Nb after melting relaxation (Fig. 4) shows that the energy and temperature of the system fluctuate greatly when melting commences; however, with the passage of time, the fluctuation decreases gradually, and the system tends to be stable. This is because when the system is heated to 3250 K, the equilibrium state of the system is destroyed, the temperature and energy increase rapidly, the atoms are disordered, and the melting entropy increases with time. The chaotic atoms slowly find a new equilibrium state, and the temperature and energy in the system gradually reduce, finally tending to certain values; thus, the stable structure of the initial state is obtained.
Effect of cooling rate on nucleation undercooling
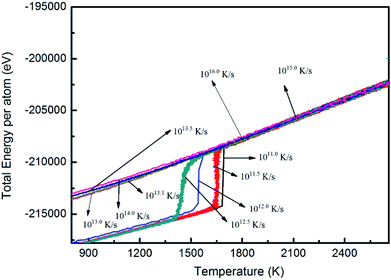
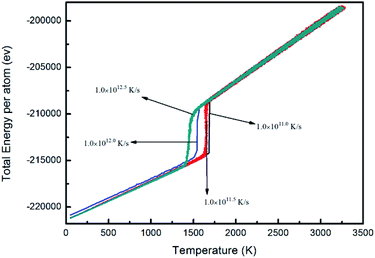
![[thin space (1/6-em)]](https://www.rsc.org/images/entities/char_2009.gif) 250 cooled to 50 K at cooling rates of 1.0 × 10¹¹, 1.0 × 1011.5, 1.0 × 1012.0, and 1.0 × 1012.5K s−1. The relationship between energy and temperature during solidification was analyzed (Fig. 7). The whole curve shows that the energy of the system decreases with decreasing temperature, and the energy catastrophe point appears at all four different cooling rates; further, the higher the cooling rate, the lower the temperature of the sudden change point.
250 cooled to 50 K at cooling rates of 1.0 × 10¹¹, 1.0 × 1011.5, 1.0 × 1012.0, and 1.0 × 1012.5K s−1. The relationship between energy and temperature during solidification was analyzed (Fig. 7). The whole curve shows that the energy of the system decreases with decreasing temperature, and the energy catastrophe point appears at all four different cooling rates; further, the higher the cooling rate, the lower the temperature of the sudden change point.
The undercooling degree of the Nb melt cooled to 50 K at different cooling rates is shown in Table 1. The nucleation temperature of Nb melt decreases gradually when the cooling rate increases to 50 K, and its undercooling value increases gradually. Furthermore, the effect of cooling rate on the undercooling of the Nb melt is obvious, and the undercooling degree increases with increasing cooling rate.
| Rc (K s−1) | Tm (K) | T (K) | ΔT (K) |
|---|---|---|---|
| 1.0 × 1011.0 | 2750 | 1696.51 | 1053.49 |
| 1.0 × 1011.5 | 2750 | 1647.03 | 1102.97 |
| 1.0 × 1012.0 | 2750 | 1609.40 | 1140.60 |
| 1.0 × 1012.5 | 2750 | 1537.44 | 1212.56 |
The change in cooling rate (Rc) and undercooling (ΔT) can be explained by the CNT,
 | (1) |
 | (2) |
In the equation, Av = 1041±1 m−3 s−1 represents the fixed ratio of homogenous nucleation, and ΔGA is the interfacial diffusion activation energy, which can be regarded as fixed. σ is the interface energy and ΔHv is the potential energy of metal crystallization. The physical and chemical parameters of Nb are listed in Table 2.
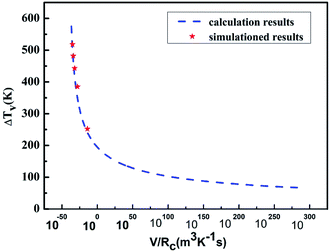
The reliability of the results obtained using molecular dynamics simulations alone is weak; therefore, the method of homogenous nucleation undercooling which considers the solid/liquid interface energy was considered to verify the reliability of the simulation results. Fig. 8 compares the simulated and calculated results. The solid lines indicate the relationship between the undercooling calculated from CNT and the cooling rate, while the blue lines show the change in the undercooling with different cooling rates. Thus, the results of theoretical computation fit those of the simulation well, proving the high reliability.
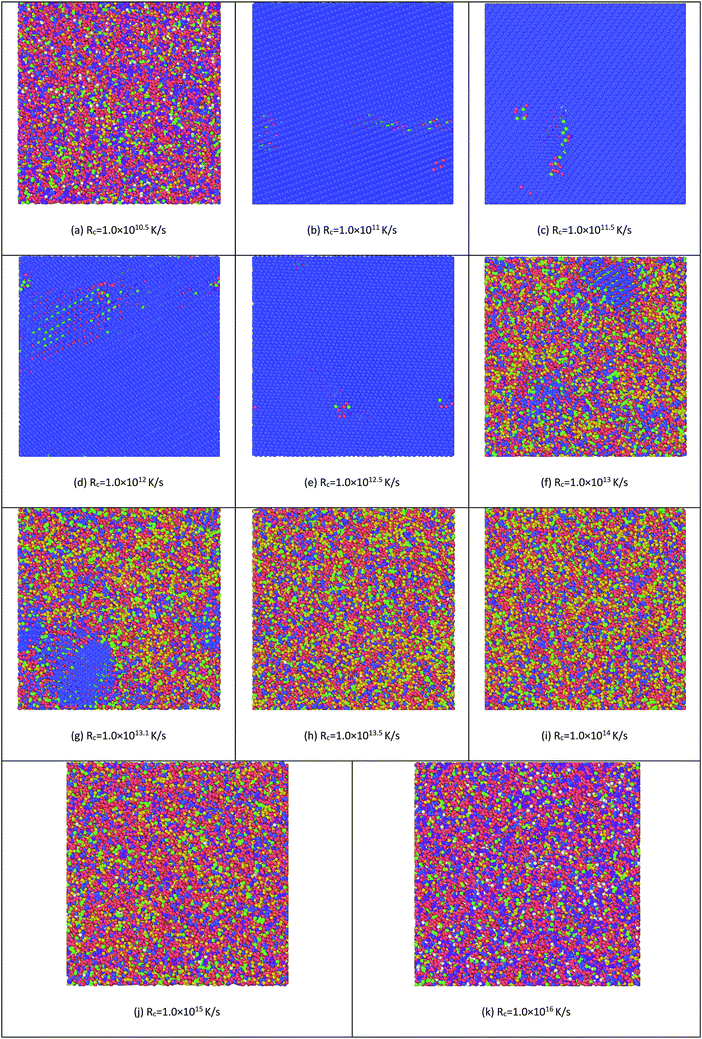 | ||
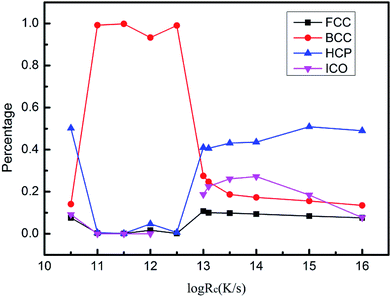
| Fig. 10 Atomic configurations of Nb melt under different cooling rates (blue represents BCC structure, green represents FCC structure, and red represents HCP structure). | ||
Analysis of the internal energy and atomic configuration reveals that the threshold cooling rate is 1.0 × 1012.5 K s−1: crystallization will occur at cooling rates lower than 1.0 × 1012.5 K s−1 and amorphous structures will be obtained at cooling rates higher than 1.0 × 1012.5 K s−1.
Effect of superheating temperature on undercooling
![[thin space (1/6-em)]](https://www.rsc.org/images/entities/char_2009.gif) 250 crystalline Nb atoms were run for 100
250 crystalline Nb atoms were run for 100![[thin space (1/6-em)]](https://www.rsc.org/images/entities/char_2009.gif) 000 steps at 3040, 3050, 3054, 3058, 3060, 3065, 3075, 3125, 3135, 3140, 3175, 3195, 3210, 3221, 3234, 3240, 3260, 3274, 3300, 3320, 3343, 3345, 3350, 3364, 3375, 3400, 3410, 3416, 3420, 3427, 3437, 3450, 3500, 3546, 3570, 3610, 3670, 3700, and 3760 K, respectively, so that the entire system is in a molten state. Then, the entire system was relaxed for 400
000 steps at 3040, 3050, 3054, 3058, 3060, 3065, 3075, 3125, 3135, 3140, 3175, 3195, 3210, 3221, 3234, 3240, 3260, 3274, 3300, 3320, 3343, 3345, 3350, 3364, 3375, 3400, 3410, 3416, 3420, 3427, 3437, 3450, 3500, 3546, 3570, 3610, 3670, 3700, and 3760 K, respectively, so that the entire system is in a molten state. Then, the entire system was relaxed for 400![[thin space (1/6-em)]](https://www.rsc.org/images/entities/char_2009.gif) 000 steps to allow the simulated system to reach the equilibrium state. Next, at a cooling rate of 1.0 × 10¹² K s−1, the temperature was decreased to 50 K, and the time step of heat preservation relaxation was introduced. By analyzing the E–T curve, the relationship between the energy of metal Nb melt and temperature was analyzed (Fig. 11).
000 steps to allow the simulated system to reach the equilibrium state. Next, at a cooling rate of 1.0 × 10¹² K s−1, the temperature was decreased to 50 K, and the time step of heat preservation relaxation was introduced. By analyzing the E–T curve, the relationship between the energy of metal Nb melt and temperature was analyzed (Fig. 11).
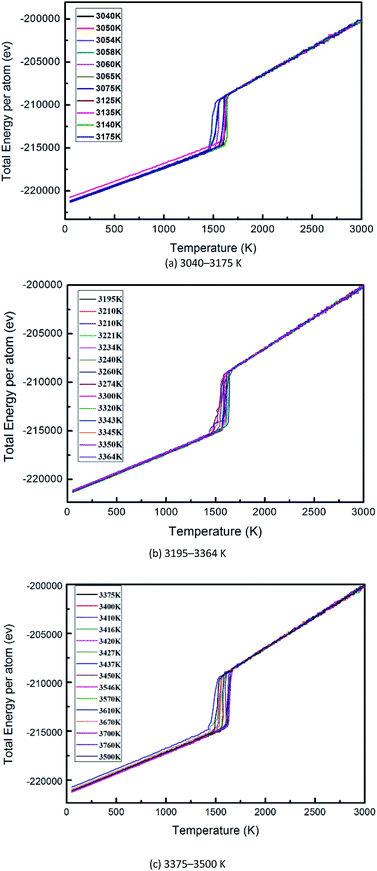 | ||
| Fig. 11 Potential energy per atom vs. temperature of Nb melt under different superheating temperatures. | ||
It can be seen from Fig. 11 that the energy of the system decreases with a decrease in temperature at different initial temperatures. At superheating temperatures of 3040, 3050, 3135, 3140, 3240, 3300, 3345, 3416, and 3670 K, the total energy of the system does not change with temperature and the system solidifies into crystals. When the superheating temperature increases from 3040 K to 3670 K, the inflection point temperature decreases gradually, indicating that the crystallization temperature of the melt decreases with an increase in the initial temperature. At superheating temperatures of 3345, 3416, and 3670 K, the system changes spontaneously to a stable low-energy state, and the energy of the system decreases with decreasing temperature. During this decrease, the slope of the curve at a certain inflection point increases instantaneously, and the energy decreases sharply. It can be seen from the graphs and Table 3 that when the superheating temperature is high enough, the crystallization temperature indicated by the inflection point does not change, and its nucleation undercooling reaches a fixed value.
| Rc (K s−1) | TS (K) | Tm (K) | T (K) | ΔT (K) |
|---|---|---|---|---|
| 1.0 × 1012.0 | 3040 | 2750 | 1646 | 1104 |
| 1.0 × 1012.0 | 3050 | 2750 | 1640 | 1110 |
| 1.0 × 1012.0 | 3135 | 2750 | 1631 | 1119 |
| 1.0 × 1012.0 | 3140 | 2750 | 1630 | 1120 |
| 1.0 × 1012.0 | 3240 | 2750 | 1624 | 1126 |
| 1.0 × 1012.0 | 3300 | 2750 | 1601 | 1149 |
| 1.0 × 1012.0 | 3338 | 2750 | 1561 | 1189 |
| 1.0 × 1012.0 | 3345 | 2750 | 1561 | 1189 |
| 1.0 × 1012.0 | 3369 | 2750 | 1561 | 1189 |
| 1.0 × 1012.0 | 3416 | 2750 | 1561 | 1189 |
| 1.0 × 1012.0 | 3670 | 2750 | 1561 | 1189 |
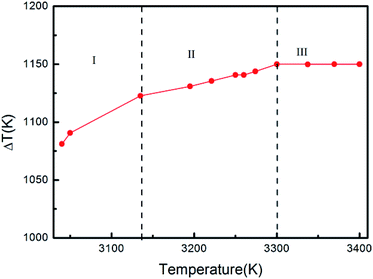
To more clearly and intuitively reflect the variation trend of the melt superheating temperature and the nucleation undercooling degree, Fig. 12 was plotted. It can be seen from the plot that the free energy of the system increases gradually with an increase in temperature due to the appearance of a crystal embryo during cooling crystallization of the molten metal Nb. At the same time, the appearance of a crystal embryo increases the system chaos and entropy, and the free energy decreases gradually. At this time, with an increase in superheating temperature, the supercooling degree tends to become stable after increasing and finally reaches a fixed value; thus, the system is in an equilibrium state, and the fixed value is the system's nucleation undercooling temperature of 1189 K.
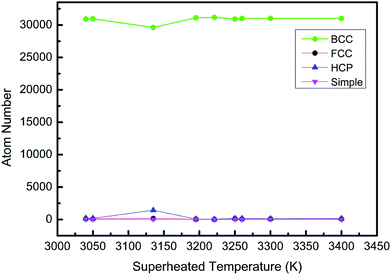
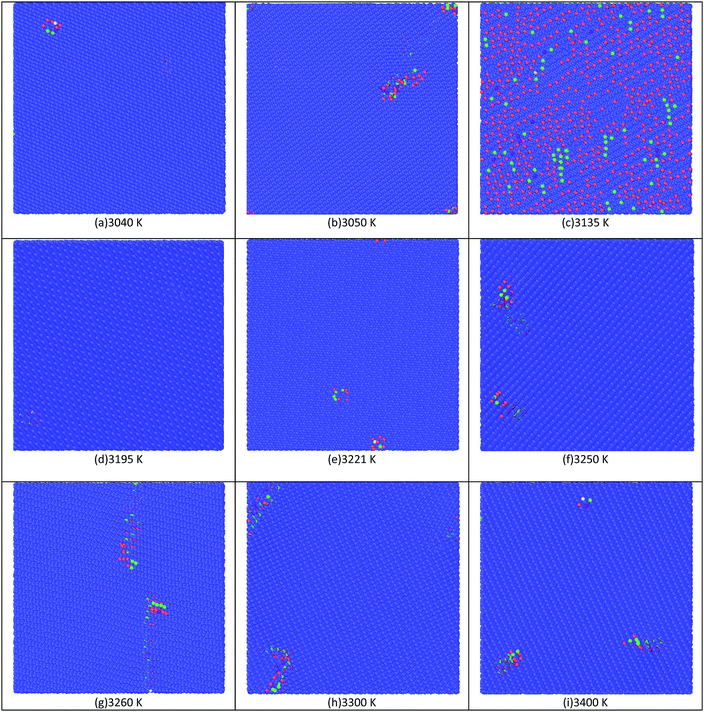
When the superheating temperature of the melt is in region I and II, the undercooling degree of the melt nucleation increases with an increase in the heating temperature; however, the change curve is discontinuous, which indicates that the melt structure in these two regions varies with temperature. Moreover, the discontinuity of the curve indicates that the melt structures of region I and II are different, and the boundary temperature of regions I and II can be regarded as the melting temperature of the residual crystal particles. Although there are no residual crystal particles in the melt of region II, there should be atomic clusters. The change in the supercooling degree of the melt in this region with the superheating temperature is a reflection of the change in the size and structure of the atomic clusters with the superheating temperature. When the melt is in region III, the supercooling degree at different superheating temperatures is a constant, which indicates that the temperature does not change in region III.
Conclusions
The simulation of the solidification of a Nb melt at different cooling rates shows that the superheating temperature and supercooled liquid have little influence on the solidification structure of Nb melt, and the effect is only apparent below the liquid–solid transition temperature. When Rc ≥ 1.0 × 1013.0 K s−1, an amorphous structure is preferably formed, while at Rc ≤ 1.0 × 1012.5 K s−1, a crystalline structure is preferably formed. Furthermore, when 1.0 × 1012.5 K s−1 ≤ Rc ≤ 1.0 × 1013.0 K s−1, crystal and amorphous structures coexist in the solidification structure of the Nb melt.The solidification undercooling of the Nb melt increased with cooling rate and can be explained by the classical nucleation theory. Further, the solidification undercooling increased with initial superheating temperature until the maximal undercooling was attained. It was found that the maximal undercoolings are close to 0.432Tm, and the maximal superheats are close to 1.216Tm. The findings of this study will serve as a foundation for further research on the relationship between the melt temperature and nucleation supercooling.
Conflicts of interest
There are no conflicts to declare.Acknowledgements
This work was financially supported by the Natural Science Foundation of China (No. 51671151 and 51401156), the Science and Technology Program of Shaanxi Province (No. 2016KJXX-87) and the State Key Laboratory of Solidification Processing in NWPU (No. SKLSP201812), Foundation of Shaanxi Provincial Department of Education (No. 18JS050).References
- T. Burgess and M. Ferry, Mater. Today, 2009, 12, 24–32 CrossRef CAS.
- A. Inoue, B. L. Shen, H. Koshiba, H. Kato and A. R. Yavari, Nat. Mater., 2003, 2, 661–663 CrossRef CAS PubMed.
- J. Chang, H. P. Wang, K. Zhou and B. Wei, Appl. Phys. A, 2012, 109, 139–143 CrossRef CAS.
- T. Zhang and A. Inoue, Mater. Trans. JIM, 1999, 40, 301–306 CrossRef CAS.
- A. Mortensen and M. C. Flemings, Metall. Mater. Trans. A, 1996, 27, 595–609 CrossRef.
- S. Y. Sung and Y. J. Kim, Intermetallics, 2006, 14, 1163–1167 CrossRef CAS.
- J. F. Xu, M. Xiang, B. Dang and Z. Y. Jian, Comput. Mater. Sci., 2017, 128, 98–102 CrossRef CAS.
- D. W. Qi, J. Lu and S. Wang, J. Chem. Phys., 1992, 96, 513–516 CrossRef CAS.
- R. S. Liu, D. W. Qi and S. Wang, Phys. Rev. B: Condens. Matter Mater. Phys., 1992, 45, 451–453 CrossRef CAS.
- K. W. Katahara, M. H. Manghnani and F. S. Fisher, J. Appl. Phys., 1976, 47, 434 CrossRef CAS.
- A. K. Singh and T. Kenichi, J. Appl. Phys., 2001, 90, 3269 CrossRef CAS.
- L. Koči, Y. Ma, A. R. Oganov, P. Souvatzis and R. Ahuja, Phys. Rev. B: Condens. Matter Mater. Phys., 2008, 77, 214101 CrossRef.
- R. E. Buxbaum and T. L. Marker, J. Membr. Sci., 1993, 85, 29–38 CrossRef CAS.
- A. I. Livshits, M. E. Notkin and A. A. Samartsev, J. Nucl. Mater., 1990, 170, 79–94 CrossRef CAS.
- Y. Lin, R. S. Liu, Z. A. Tian, Z. Y. Hou, L. L. Zhou and Y. B. Yu, Acta Phys.-Chim. Sin., 2008, 24, 250–256 CAS.
- Z. Y. Hou, R. S. Liu, C. S. Li, Q. Y. Zhou and C. X. Zheng, Acta Phys. Sin., 2005, 54, 5723–5729 CAS.
- Z. Y. Jian, Z. C. Wei, F. E. Chang and Y. S. Gao, J. Xi'an Technol. Univ., 2008, 28, 137–141 Search PubMed.
- P. T. Li, Y. Q. Yang, W. Zhang, X. Luo, N. Jin and G. Liu, RSC Adv., 2016, 6, 54763–54767 RSC.
- X. G. Geng, G. Chen and H. Z. Fu, Acta Metall. Sin., 2002, 38, 225–229 CAS.
- N. C. Si, L. G. Zhao and K. Q. Sun, Nonferrous Met., 2008, 60, 22–25 CAS.
- Z. Y. Hou, K. J. Dong, Z. A. Tian, R. S. Liu, Z. Wang and J. G. Wang, Phys. Chem. Chem. Phys., 2016, 1, 1–3 Search PubMed.
- J. J. Han, C. P. Wang, X. J. Liu, Y. Wang, Z.-K. Liu, T.-Y. Zhang and J. Z. Jiang, Sci. Rep., 2016, 6, 22391 CrossRef CAS PubMed.
- Z. Y. Jian, K. Kuribayashi and W. Q. Jie, Acta Mater., 2004, 52, 3323–3333 CrossRef CAS.
- S. P. Pan, J. Y. Qin, W. M. Wang and T. K. Gu, Phys. Rev. B: Condens. Matter Mater. Phys., 2011, 84, 092201 CrossRef.
- S. Plimpton, J. Comput. Phys., 1995, 117, 1–19 CrossRef CAS.
- M. R. Fellinger, H. Park and J. W. Wilkins, Phys. Rev. B: Condens. Matter Mater. Phys., 2010, 81, 144119 CrossRef.
- S. Nosé, Mol. Phys., 1984, 52, 255–268 CrossRef.
- W. G. Hoover, Phys. Rev. A, 1985, 31, 1695–1697 CrossRef.
- J. R. Morris, C. Z. Wang, K. M. Ho and C. T. Chan, Phys. Rev. B: Condens. Matter Mater. Phys., 1994, 49, 3109–3115 CrossRef CAS.
- F. T. Robert, Physica B Condens. Matter., 2007, 392, 79–91 CrossRef.
- E. A. Brandes and G. B. Brook, Smithells Metals Reference Book, Butterworth, Oxford, 1992 Search PubMed.
| This journal is © The Royal Society of Chemistry 2019 |

