 Open Access Article
Preparation and electrochemical studies of electrospun phosphorus doped porous carbon nanofibers
Chao Liua,
Gaofeng Shi*a,
Guoying Wanga,
Puranjan Mishrab,
Shiming Jia a,
Xia Jianga,
Peng Zhanga,
Yucan Donga and
Zhao Wanga
aSchool of Petrochemical Engineering, Lanzhou University of Technology, Lanzhou, 730050, China
bFaculty of Engineering Technology, Universiti Malaysia Pahang, Lebuhraya Tun Razak, 26300 Gambang, Kuantan, Pahang, Malaysia
First published on 28th February 2019
Abstract
An ultra-facile fabrication process for the preparation of phosphorus doped porous carbon nanofibers (P-PCNFs) through the electrospinning and heat treatment method has been studied. The materials were characterized by X-ray diffraction, scanning electron microscopy, and X-ray photoelectron spectroscopy. Studies showed that fabricated P-PCNFs have unique porous fibers structures, large specific surface area (462.83 cm2 g−1), and abundant microporous and mesoporous structures. X-ray photoelectron spectroscopy analyses revealed that the contents of phosphorus and electrochemical properties in a series of P-PCNF samples can be tuned by controlling the polyphosphoric acid concentration. The electrochemical properties of the materials were evaluated using cyclic voltammetry, galvanostatic charge–discharge, and electrochemical impedance spectroscopy. Studies showed that the specific capacitance of the fabricated P-PCNFs using the ultra-facile process reached up to 228.7 F g−1 at 0.5 A g−1 in 1 M H2SO4. Over 84.37% of the initial capacitance remains as the current density increases from 0.5 to 10 A g−1. Meanwhile, at a current density of 2 A g−1, no capacitance loss was observed in 5000 charge/discharge cycles. The highest voltage windows of sample P-PCNFs-1.0 in 1 M H2SO4 aqueous electrolyte can reach 1.4 V. These properties suggest that the fabricated P-PCNFs exhibit excellent electrochemical properties. Conclusively, the surface of carbon nanofibers can be modified by heteroatom doping or surface activation which can improve the electrochemical performance of the materials.
Introduction
In recent years, although mankind has made remarkable achievements in energy issues, a serious energy crisis is still likely. Methods to increase the use of renewable energy sources and the development of new environmentally friendly energy conversion and storage devices are particularly important. Supercapacitors are a new type of energy storage device, which are widely used in electric vehicles, portable electronic devices, aerospace, and military applications, and many other areas. Commonly used as electrodes for supercapacitor vessels are carbon-based materials (such as activated carbon, carbon nanotubes, carbon nanofibers, etc.), metal–organic frameworks1–3 and so on. Among these materials, carbon nanofibers have been widely considered as ideal functional materials for the synthesis of supercapacitor electrodes due to such excellent properties as hardness, electrical conductivity, optical properties, heat resistance, electrical insulation, and surface and interface properties.4–7 Traditional methods for preparing carbon nanofibers include chemical vapor deposition,8 the template method,9 the emulsion method,10 and so on. However, these traditional methods have disadvantages of complicated preparation processes, high cost, and uncontrollable process parameters. Compared with the traditional preparation method, the electrospinning method has attracted much attention due to its advantages such as simple equipment, and economic and convenient operation.11–13The carbon nanofibers prepared by the electrospinning method also have the advantages of large specific surface area, large length to diameter ratio, small number of defects, and compact structure. However, pure carbon nanofibers as an electrode materials still has disadvantages such as poor hydrophilicity, low specific surface area utilization, and low energy density. Fortunately, we have found that by modifying the surface of the carbon fibers (such as heteroatom doping) or surface activation, the above disadvantages can be eliminated.
Chemical doping with atoms is an effective approach to modify the properties of the carbon materials intrinsically. Recently, heteroatoms doping is mainly concentrated on non-metallic elements similar to the atomic radius of element C, such as B, N, P, S doping. Doping N atoms can change the inherent electrical properties and hydrophilicity of carbon, which is beneficial to improve the electrochemical properties of power characteristics. Feng14 et al. reported a nitrogen-doped graphene nanosheets (N-GNSs) synthesized by a facile solvothermal method. As an electro-active materials, the N-GNSs exhibited superior capacitive behavior with a high specific capacitance of 181.3 F g−1 in 2 M KOH electrolyte at the current density of 0.5 A g−1. Anthuvan15 et al. reported the open-ended N-doped CNTs have been obtained by pyrolysis of C2H2/NH3 mixture over lanthanum nickel LaNi5 alloy catalyst and subsequent acid treatment. The resultant open-ended N-doped CNTs tested as a supercapacitor electrode material by cyclic voltammetry and exhibited high specific capacitance of 146 F g−1. Simultaneously, the study revealed that the higher capacitance of open-ended N-doped CNTs attributed to the positive charge on the both graphitic or quaternary N as well as pyridine-N-oxide groups can advance the electron conductance through carbon network and lead to the increased capacitance. Doping B element can change the electron distribution of carbon materials, improve the interface capacitance and quantum capacitance of the materials, at the same time, it also can improve the hydrophilicity of the materials, improve the wettability of the materials, and form the electric double layer capacitor easily. Guo16 et al. prepared boron-doped porous carbon by a simple one-step synthesis method. Studies have shown that B-doping can enhance the wettability between the electrolyte and the electrode material and can also lead to the pseudocapacitive effect. Niu17 et al. prepared boron-doped graphene (BG) through pyrolysis of graphene oxide (GO) with boric acid (H3BO3) in an argon atmosphere at 900 °C. The research indicated that the enhanced electrochemical properties of BG can be attributed to the incorporation of boron atoms and the high percentage of oxygen atoms after boron-doping. Doping P atoms can stabilize oxygen functional groups during electrochemical charging, resulting in pseudocapacitance which improves capacitance performance. At the same time, the doping of P atoms can also make the electrode material to stand a higher voltage range in the aqueous electrolyte, which can increase the energy density of the supercapacitor.18–23 In addition to the above-mentioned single-atom and diatomic doping, the doping of three-atom heteroatoms has become a hot spot of current research. Wu24 et al. successfully prepared N, F, P ternary heteroatom doped carbon fiber materials (NFPC) by electrospinning and annealing. When used as electrocatalysts for ORR and OER, NFPC exhibits considerable bifunctional activities due to the large specific surface area with porous architecture and the synergistic effect of heteroatoms. Wang25 et al. synthesized N, B, F ternary doped carbon fibers materials (TD-CFs) by electrospinning and annealing techniques. When used as electrocatalysts for ORR and OER, this material has a higher catalytic activity than monoatomic doping. At the same time, as a zinc–air battery material. When compared to batteries with Pt/C + RuO2 and Vulcan XC-72 carbon black catalysts, the TD-CFs catalyzed batteries exhibit remarkable battery reversibility and stability over long charging/discharging cycles.
Commonly, surface activation methods include chemical activation, physical activation, and microwave radiation activation and so on.26–30 The research group used KOH activation method to prepare biomass-based carbon nanofibers with large specific surface area, and its electrochemical performance improved greatly. Although the KOH activation method can increase the specific surface area of the fibers, the amount of hetero atom functional groups on the surface of the fibers is largely reduced due to the strong corrosiveness of KOH. This is harmful to heteroatom doping. How to achieve simultaneous heteroatom doping and surface activation on the carbon nanofibers surface is particularly important. As a pore-making agent, polyethylene glycol (PEG) has attracted attention because of low price, good solubility, and no influence on spinning. Using this pore-making agent can not only increases the specific surface area of the fibers, optimizes the pore structure, but also has no effect on heteroatom doping.
In the present study, we have successfully prepared phosphorus-doped porous carbon nanofibers with excellent capacitance properties by electrospinning, using polyethylene glycol as pore-making agent and polyphosphoric acid as phosphorus source. The influence of the doping amount of polyphosphoric acid on the chemical composition and structure of the prepared carbon fiber is investigated. The prepared material is used as a supercapacitor electrode material to study its electrochemical performance, the specific capacitance of the fabricated P-PCNFs using the ultra-facile process reaches up to 228.7 F g−1 at 0.5 A g−1 in 1 M H2SO4. At current density of 2 A g−1, there is no loss in 5000 charge/discharge cycle capacitance. The highest voltage windows of the sample P-PCNFs-1.0 in the 1 M H2SO4 aqueous electrolyte can reach 1.4 V.
Experimental
Spinning dope preparation
The drugs used in the experiments were purchased commercially and used without further purification. First, 1.0 g of polyacrylonitrile (PAN) and 1.0 g of polyethylene glycol (PEG) were accurately weighed and dissolved in 15 mL of N,N-dimethylformamide (DMF) solution. Magnetic stirring was carried out for 6 hours at room temperature to obtain a colorless viscous liquid. Then, a certain amount of polyphosphoric acid (0.0, 0.3, 0.5, 1.0, 1.5 g) was weighed and added to the above viscous liquid, and ultrasonically dispersed for 1 hour to finally obtain a spinning solution.Electrospinning
The electrospinning process was performed on a conventional electrospinning device (Yongkang Leye, Beijing). A plastic syringe with a 20-gauge stainless steel needle was filled with the precursor solution and then connected to the high-voltage anode. No syringe pump was used in the spinning process. A tin foil-coated cylinder was used as a nanofibers collector. The conditions for electrospinning were: the distance from the spinneret to the collector was 20 cm; the advancing speed was 0.12 mm min−1; the negative high pressure was −2 kV; the positive high pressure was 15 kV; and the ambient temperature was 25 °C.Heat treatment of fibers
The nanofibers membrane prepared by the above electrospinning was fixed on a porcelain boat, and pre-oxidized a in a programmed temperature-controlled muffle furnace at 250 °C for 1 h, with a heating rate of 1 °C min−1. Then, the pre-oxidized fibers were mounted in a tube furnace, ramped to 800 °C at the heating rate of 2 °C min−1 under nitrogen atmosphere, and kept at 800 °C for 1 h. The corresponding samples were named P-PCNFs, P-PCNFs-0.3, P-PCNFs-0.5, P-PCNFs-1.0, and P-PCNFs-1.5 (the numbers represent the doping amount of polyphosphoric acid in the spinning solution). The entire preparation process is shown in Fig. 1.Structure characterization
The surface structure of the fibers was observed by using a JSM-6701 F cold field emission scanning electron microscope (SEM, Japan Electron Optics Corporation) and JEOL JEM-2010 transmission electron microscopy (TEM, Japan). The specific surface area and pore size distribution of the sample were tested by N2 adsorption and desorption at 77.3 K using a volumetric sorption analyser (micromeritics ASAP 2020). Powder X-ray diffraction (XRD) measurements were conducted on a MSAL-XD2 type diffractometer in the 2θ range of 5 to 80°. X-ray photoelectron spectra (XPS) was collected on an Escalab 250Xi spectrometer (Thermo Scientific, USA), using a mono-chromatized Al Kα X-ray source.Electrochemical characterization
In order to prepare a working electrode, the resulting material, acetylene black and polytetrafluoroethylene (PTFE) were uniformly mixed at a mass ratio of 80%![[thin space (1/6-em)]](https://www.rsc.org/images/entities/char_2009.gif) :
:![[thin space (1/6-em)]](https://www.rsc.org/images/entities/char_2009.gif) 15%
15%![[thin space (1/6-em)]](https://www.rsc.org/images/entities/char_2009.gif) :
:![[thin space (1/6-em)]](https://www.rsc.org/images/entities/char_2009.gif) 5% using anhydrous ethanol as the solvent.31 The paste was applied to a 2 cm × 1 cm stainless steel mesh with a coating area of 1 cm × 1 cm.32 The coated stainless-steel mesh was placed in an oven, dried at 80 °C for 12 hours, and then pressed into a sheet at a pressure of 3 MPa. In the electrochemical workstation (CHI660E, Shanghai Chenhua Instrument Co., Ltd.), we used cyclic voltammetry (CV), galvanostatic charge–discharge (GCD) and electrochemical impedance spectroscopy (EIS) methods to test the working electrode and evaluate electrochemical properties of materials. Among them, a platinum foil was used as a counter electrode with a saturated calomel electrode (SCE) as a reference electrode.
5% using anhydrous ethanol as the solvent.31 The paste was applied to a 2 cm × 1 cm stainless steel mesh with a coating area of 1 cm × 1 cm.32 The coated stainless-steel mesh was placed in an oven, dried at 80 °C for 12 hours, and then pressed into a sheet at a pressure of 3 MPa. In the electrochemical workstation (CHI660E, Shanghai Chenhua Instrument Co., Ltd.), we used cyclic voltammetry (CV), galvanostatic charge–discharge (GCD) and electrochemical impedance spectroscopy (EIS) methods to test the working electrode and evaluate electrochemical properties of materials. Among them, a platinum foil was used as a counter electrode with a saturated calomel electrode (SCE) as a reference electrode.
Results and discussion
Structural characterization
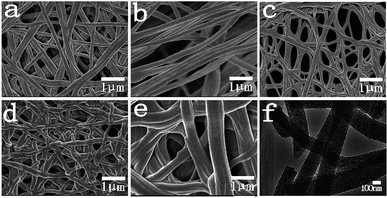
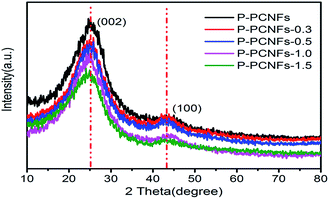
The morphology was demonstrated by the scanning electron microscopy (SEM) and transmission electron microscopy (TEM) images in Fig. 2, where the as-synthesized P-PCNFs series samples exhibited long fibrous morphology with uniform diameters ranging from 200 to 250 nm. It can be seen from the transmission electron microscopy (Fig. 2(f)) that many shadows appear inside the P-PCNFs-1.0 sample material, and the surface roughness of the sample increases. It is indicated that the carbon fiber prepared at high temperature is not a graphite structure, and it may be that the phosphorus element is successfully embedded on the surface of the carbon material. In addition, comparing the SEM images (Fig. 2(a–e)) of all samples, we found that with the increase of polyphosphoric acid, the spinnability of the spinning solution is not affected, and all the samples exhibit fibers morphology. However, as the polyphosphoric acid content continues to increase, the fibers fusion phenomenon of the prepared samples becomes more and more serious. This shows that the addition of polyphosphoric acid greatly affects the chemical composition of the spinning solution, leading to oxidative crosslinking between adjacent molecules inside the fibers and cyclization between cyano groups, thereby reducing the fibers rigidity and tensile strength.To further examine the structures of all the samples, XRD characterization was performed. The results are shown in Fig. 3. Two broad characteristic peaks appeared at 23.5° and 43° for the all samples, corresponding to the (002) crystal plane and the amorphous carbon (100) crystal plane, respectively, of the graphite layer,33,34 indicating that the materials prepared belongs to an amorphous graphite structure. On the other hand, we noticed that as the amount of phosphorus doping increases, the intensity of the diffraction peak of the carbon materials decreases, resulting in a decrease in the degree of graphitization of the materials and an increase in amorphousness. This may be because the doping of phosphorus hinders the formation of the ordered graphite layer, reduces the crystallite size and number of graphite, and makes the surface defects of the material more obvious.
In order to study the effect of polyethylene glycol (PEG) on the microstructure of materials, the porous properties of the as-prepared phosphorus doped porous carbon nanofibers (P-PCNFs-1.0) were investigated by evaluating the nitrogen adsorption–desorption isotherms measured at 77.3 K. At the same time, pure PAN-based carbon nanofibers (PAN) were used as a control for comparison. Fig. 4(a) shows the nitrogen adsorption and desorption isotherm and pore size distribution of the sample. According to the BDDT classification, the adsorption–desorption curve of the prepared sample belongs to the type IV nitrogen adsorption isotherm, indicating that using pore-making agent of polyethylene glycol, the prepared samples are mainly formed microporous structure on the surface.35,36 Hysteresis was observed upon desorption for the prepared carbon nanofibers (P-PCNFs-1.0), which is consistent with elastic deformation or swelling as a result of gas sorption. According to calculations, the prepared P-PCNFs-1.0 sample had a specific surface area of 462.83 cm2 g−1, which was 35% higher than pure PAN carbon nanofibers (298.34 cm2 g−1). Fig. 4(b) shows the pore size distribution (PSD) curves for the samples calculated by using Barrett–Joyner–Halenda (BJH) method. The prepared carbon nanofibers exhibited abundant micropore and mesopores structures, and the majority of which were distributed approximately 2.16 nm. Table 1, listed the BET specific surface areas, specific volumes of the micropores, and average pore sizes of the samples.
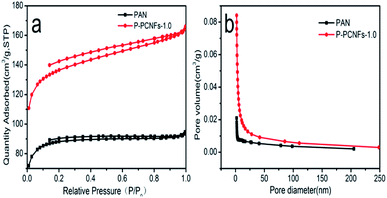 | ||
| Fig. 4 (a) Nitrogen adsorption/desorption isotherms of PAN and P-PCNFs-1.0; (b) pore size distributions of the samples calculated by BJH method. | ||
| Sample ID | Dav/nm | SBET/m2 g−1 | Vt/m3 g−1 | Vme/m3 g−1 | Vmi/m3 g−1 | Vmi/Vt |
|---|---|---|---|---|---|---|
| a Dav: average pore diameter; Vt: total pore volume; Vme: mesoporous volume; Vmi: microporous volume. | ||||||
| P-PCNFs-1.0 | 2.16 | 462.83 | 0.25 | 0.10 | 0.15 | 0.60 |
| PAN | 1.91 | 298.34 | 0.14 | 0.03 | 0.11 | 0.786 |
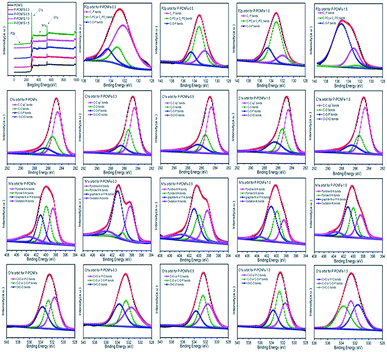
In order to determine the elemental composition and bonding of the sample, we performed X-ray photoelectron spectroscopy (XPS) analysis on all the samples. Fig. 5, shows the full spectrum of the samples and the high-resolution spectra of C1s, N1s, O1s, and P2p for each sample, which provides favorable evidence for analyzing the chemical composition of the surface of the carbon lattice. From the full spectrum, we can see that the surface of the five samples mainly contains four elements of C, O, N and P. The relative contents of each element are shown in Table 2. From the data in the table, as the amount of polyphosphoric acid increases, the content of phosphorus increases from 0.06% to 1.69%, indicating that phosphorus is successfully doped onto the fibers surface. In addition, we noticed that the oxygen content on the surface of carbon fibers increases with the increase of phosphorus doping amount, indicating that the phosphorus element on the surface of the materials exists in the form of bound oxygen. The presence of these oxygen-containing functional groups not only increases the surface hydrophilicity of the material, but also increases the pseudocapacitive of the materials.18,37
| Sample | C (%) | N (%) | O (%) | P (%) |
|---|---|---|---|---|
| P-PCNFs | 87.87 | 4.42 | 7.65 | 0.06 |
| P-PCNFs-0.3 | 92.77 | 2.65 | 4.26 | 0.32 |
| P-PCNFs-0.5 | 87.16 | 4.50 | 7.83 | 0.51 |
| P-PCNFs-1.0 | 84.68 | 4.04 | 10.91 | 0.37 |
| P-PCNFs-1.5 | 80.84 | 3.98 | 13.50 | 1.69 |
In case of C1s orbit, the high-resolution spectra of C1s orbit for all samples exhibits four individual component peaks around 284.6, 285.5, 286.5 and 289.3 eV, which are attributed to graphitic structure (C–Csp2), carbon–oxygen single bonds, carbon–oxygen–phosphorus single bonds (C–O–P) and carbon–oxygen double bonds (O–C![[double bond, length as m-dash]](https://www.rsc.org/images/entities/char_e001.gif) O), respectively.28,38,39 In general, the bonding form is mainly composed of graphitic structure (C–Csp2) at 284.6 eV. In addition, as the amount of phosphorus doping increases, the C–O bond gradually increases, indicating that phosphorus doping facilitates the formation of C–O bonds.
O), respectively.28,38,39 In general, the bonding form is mainly composed of graphitic structure (C–Csp2) at 284.6 eV. In addition, as the amount of phosphorus doping increases, the C–O bond gradually increases, indicating that phosphorus doping facilitates the formation of C–O bonds.
The N1s spectrum can be deconvoluted into four different components: the peaks at 398.5, 400.1, 401.1 and 403.5 eV are ascribed to pyridinic nitrogen (N-6), which is, a structure in which one carbon atom on the hexagonal ring of the graphite edge is replaced by a nitrogen atom; pyrrole nitrogen (N-5), which is a structural form in which one carbon atom on a five-membered heterocyclic ring in graphite is replaced by nitrogen atom; graphite nitrogen (N-Q) or P–N bond and pyridine-N-oxide (N–O).39–41 With the increasing amount of phosphorus doping, the content of graphite nitrogen (NQ) on the surface of the material increases gradually, which indicates that the doping of phosphorus hinders the formation of ordered graphite layer and reduces the crystallite size and number of graphite. This is consistent with the conclusions obtained by XRD characterization.
For O1s orbit, three peaks centered at 531.6, 532.7, and 533.7 eV can be recognized for all samples. The peak at 531.6 eV corresponds to oxygen double bonded to carbon (C![[double bond, length as m-dash]](https://www.rsc.org/images/entities/char_e001.gif) O) in quinone type groups or phosphorus (P
O) in quinone type groups or phosphorus (P![[double bond, length as m-dash]](https://www.rsc.org/images/entities/char_e001.gif) O) in the phosphate group, while the peak at 532.7 eV refers to singly bonded oxygen (–O–) in C–O and C–O–P groups, the peak at 533.7 eV is attributed to O
O) in the phosphate group, while the peak at 532.7 eV refers to singly bonded oxygen (–O–) in C–O and C–O–P groups, the peak at 533.7 eV is attributed to O![[double bond, length as m-dash]](https://www.rsc.org/images/entities/char_e001.gif) C–O in carboxyl type groups.42 Compared with P-PCNFs, the oxygen content of other samples at 531.6 eV and 532.7 eV increased, indicating that phosphorus element is introduced into the surface of carbon fibers by reacting with oxygen-containing functional groups on the surface of carbon material.
C–O in carboxyl type groups.42 Compared with P-PCNFs, the oxygen content of other samples at 531.6 eV and 532.7 eV increased, indicating that phosphorus element is introduced into the surface of carbon fibers by reacting with oxygen-containing functional groups on the surface of carbon material.
For the P2p XPS spectrum, these spectra have been deconvoluted into three components according to previous studies, which are assigned to the presence of C3–P type groups (132.2 eV); C–PO3 and C2–PO2 type groups (133.1 eV); (CO)3PO, P–O bond in the (CO)2PO2 or (CO)PO3 group (134.6 eV).43,44 The P2p high-resolution spectral analysis again proved that the phosphorus atom was successfully incorporated into the surface of the material. Table 3 lists the specific content of the bonding forms of the various elements of different phosphorus doping porous carbon nanofibers materials.
| Samples | P-PCNFs | P-PCNFs-0.3 | P-PCNFs-0.5 | P-PCNFs-1.0 | P-PCNFs-1.5 | |
|---|---|---|---|---|---|---|
| C1s | Content/at% | 87.87 | 92.77 | 87.16 | 84.68 | 80.84 |
| 284.5 eV | 55.42 | 55.29 | 57.49 | 47.45 | 45.22 | |
| 285.4 eV | 25.67 | 26.05 | 21.85 | 27.06 | 33.84 | |
| 286.5 eV | 14.49 | 16.88 | 17.31 | 22.17 | 17.84 | |
| 289.3 eV | 4.4 | 1.77 | 3.35 | 3.31 | 3.09 | |
| O1s | Content/at% | 7.65 | 4.26 | 7.83 | 10.91 | 13.50 |
| 531.6 eV | 39.59 | 36.85 | 40.55 | 34.32 | 35.5 | |
| 532.7 eV | 29.19 | 29.45 | 37.49 | 42.42 | 29.75 | |
| 533.7 eV | 30.65 | 33.69 | 21.96 | 23.26 | 34.74 | |
| N1s | Content/at% | 4.42 | 2.65 | 4.50 | 4.04 | 3.98 |
| 398.5 eV | 30.31 | 35.28 | 28.46 | 20.4 | 27.39 | |
| 400.1 eV | 32.42 | 24.58 | 25.02 | 28.03 | 28.17 | |
| 401.1 eV | 24.92 | 31.49 | 34.29 | 45.39 | 37.00 | |
| 403.5 eV | 12.34 | 8.63 | 12.22 | 6.17 | 7.43 | |
| P2p | Content/at% | 0.06 | 0.32 | 0.51 | 0.37 | 1.69 |
| 132.2 eV | — | 68.61 | 26.45 | 14.31 | 22.16 | |
| 133.1 eV | 37.44 | 17.15 | 57.06 | 21.64 | 3.60 | |
| 134.6 eV | 62.56 | 14.22 | 16.48 | 21.81 | 72.23 |
Electrochemical characterization
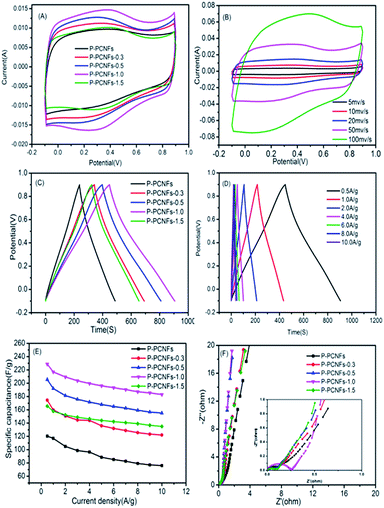
Fig. 6(A), shows a voltammogram of the P-PCNFs series samples in a three-electrode system with a voltage range of −0.1 to 0.9 V and a scan rate of 20 mV s−1 using 1 M H2SO4 solution as the electrolyte. As shown in the picture, the resulting CV curve presents a rectangular-like shape, and no significant redox peak was observed, indicating that the electrode capacity still exhibited an electric double layer capacitance. At the same time, we observed that a potential hump can be observed in the CV curve of the doped phosphorus samples, and the integrated area of the CV curve is much larger than that of P-PCNFs (no phosphorus doping). These phenomena indicate that the doping of phosphorus can increase the interfacial capacitance and pseudocapacitive effect of the material. In addition, we found that the P-PCNFs-1.0 sample had the largest CV curve area in all samples, indicating that the polyphosphoric acid addition amount was not the more the better, and should be controlled at 1.0 g as the optimum doping amount. Fig. 6(B) shows the cyclic voltammogram of the P-PCNFs-1.0 sample at different sweep speeds. The integral area of the CV curve of the P-PCNFs series samples becomes larger as the sweep speed increases, and the shape of the curve gradually deviates from the rectangle, indicating that its capacitance performance is declining. This is mainly due to the dispersion capacitance effect and drop in the ohmic voltage, and it took time for the current to reach a steady state. Fig. 6(C) shows the constant current charge–discharge data of each sample in a 1 M H2SO4 electrolyte solution at a current density of 0.5 A g−1. As seen from the figure, the length of discharge time is P-PCNFs-1.0 > P-PCNFs-0.5 > P-PCNFs-0.3 > P-PCNFs-1.5 > PCNFs. The specific capacitance values of the individual samples were calculated using according to the eqn (1) and shown in Table 4.
 | (1) |
| Sample | P-PCNFs | P-PCNFs-0.3 | P-PCNFs-0.5 | P-PCNFs-1.0 | P-PCNFs-1.5 |
|---|---|---|---|---|---|
| Specific capacitance (F g−1) | 120.4 | 174.45 | 205.4 | 228.7 | 165.6 |
From the data in the Table 4, the sample P-PCNFs-1.0 has the best capacitance performance, which is consistent with the results of the CV test. Fig. 6(D) shows the galvanostatic charge–discharge curves of the P-PCNFs-1.0 sample at different current densities. When the current density increases from 0.5 A g−1 to 10 A g−1, the charge–discharge curve has the linear and symmetric characteristics of the electric double layer capacitor. At the same time, when the current density is 0.5 A g−1, the specific capacitance reaches up to 228.7 F g−1. When the current density is increased to 10 A g−1, the specific capacitance can still be retained at 183 F g−1. These results indicate that the prepared sample has excellent electrochemical performance. Fig. 6(E) shows the comparison of the rate performances of the all samples. When the current density increases from 1 A g−1 to 10 A g−1, the specific capacitance retention rate is 65.01% for PCNFs, 76.39% for P-PCNFs-0.3, 80.72% for P-PCNFs-0.5, 84.37% for P-PCNFs-1.0 and 85.44% for P-PCNFs-1.5. It can be seen that the phosphorus doping has a certain promoting effect on the capacitance rate performance of the samples. This is because the doped phosphorus atom easily reacts with the oxygen-containing functional group on the surface of the carbon material to form a more stable phosphorus–oxygen compound, thereby being embedded on the surface of the carbon materials. During the charging and discharging process, the consumption of oxygen-containing functional groups on the surface of the carbon material is reduced, and the stability of the carbon material is increased. Fig. 6(F) shows an EIS spectrum of the four samples in a three-electrode system. It can be seen from the figure that a small semi-circular Faraday impedance arc is generated in the high-frequency region. In the low-frequency region, an approximately vertical Weber diffusion curve was observed.34,45 It can be explained with two aspects: addition of the pore-enlarging agent polyethylene glycol, a suitable pore structure is obtained; and the phosphorus doping can change the polarity of the carbon skeleton surface and improve the wettability of the materials. Combined with the double action of surface pore-making and element doping, it is beneficial to the rapid diffusion and transport of the electrolyte solution, thereby improving the electrochemical performance of the materials.
The long-term stability of P-PCNFs-1.0 was studied using galvanostatic charge/discharge measurement at 2 A g−1. The result is shown in Fig. 7(A). It can be seen from the figure that after 5000 cycles of charge and discharge, the specific capacitance of P-PCNFs-1.0 is not attenuated, indicating that the sample has excellent cycle stability. It is further explained that by surface pore-making and phosphorus doping, the pore size distribution of the material can be optimized, the surface wettability and the surface utilization can be enhanced. The rapid transfer of electrolyte ions in the pores of the surface of the material is ensured and material stability is improved. At the same time, we compared the rate performance of the samples before and after the cycle. As shown in Fig. 7(B), it can be clearly seen from the figure that after 5000 cycles, the specific capacitance of the sample is not only greatly increased, but also the rate performance is correspondingly improved, which proves that the wettability of the sample material and mass transfer rate of electrolyte is improved after 5000 cycles. This is consistent with the conclusion we can reach.
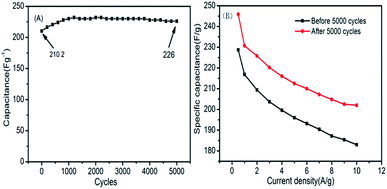 | ||
| Fig. 7 (A) Cycle characteristics of P-PCNFs-1.0 at 2 A g−1 current density; (B) comparison of magnification performance of sample P-PCNFs-1.0 before and after 5000 cycles. | ||
To evaluate applicability and practicability of the prepared supercapacitor, Table 5 lists our results compared to previously published carbon nanofiber electrode materials prepared by electrospinning.
| Electrode materials | Specific capacitance (current density) | Specific capacitance retention (cyclic times) | References |
|---|---|---|---|
| Nitrogen-doped porous carbon nanofibers | 202 F g−1 (1 A g−1) | 97% (3000) | 46 |
| Porous nitrogen and phosphorus co-doped carbon nanofiber | 280 F g−1 (1 A g−1) | 98% (10![[thin space (1/6-em)]](https://www.rsc.org/images/entities/char_2009.gif) 000) 000) |
47 |
| Coal-based activated carbon nanofibers | 230 F g−1 (1 A g−1) | 97% (3000) | 48 |
| Biomass-based carbon nanofibers | 211.4 F g−1 (1 A g−1) | 96.4% (1000) | 49 |
| Phosphorus doped porous carbon nanofibers | 216.9 F g−1 (1 A g−1) | No attenuation (5000) | This work |
Compared with above results, our material showed equal, or even better capacitive property. When the current density is 1 A g−1, its specific capacitance reaches 216.9 F g−1. And after 5000 charge and discharge at a current density of 2 A g−1, the specific capacitance is not attenuated. Therefore, the prepared electrode material has broad application prospects in practical applications.
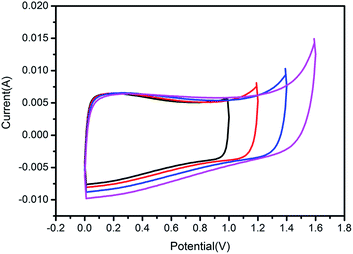
In addition, in order to study the effect of phosphorus doping on the voltage window, we used a two-electrode system to detect the voltage window of P-PCNFs-1.0 sample by cyclic voltammetry in 1 M H2SO4 electrolyte. The result is shown in Fig. 8, it is well known that the electrolysis voltage of water is close to 1.23 V, so the test voltage of the carbon material electrode in the aqueous electrolyte cannot exceed 1.2 V.50,51 However, it can be seen from the test results in Fig. 8 that as the voltage range increases from 1.0 V to 1.6 V, there is still no obvious characteristic peak of water electrolysis under the voltage window of 1.4 V. It is shown that the highest voltage windows of the sample P-PCNFs-1.0 in the 1 M H2SO4 aqueous electrolyte can reach 1.4 V, which is much higher than the theoretical voltage (1.23 V) the water decomposition. The broadening of the potential window is attributed to the fact that the phosphorus-containing groups on the surface of the material block unstable electrochemically active oxidation sites (e.g., quinone groups), minimizing the process of deterioration of the capacitance associated with free oxygen atoms.
Conclusion
Phosphorus-doped porous carbon nanofibers were successfully prepared by electrospinning a precursor liquid containing PAN, PEG and PPA, and subsequent heat treatment. By controlling the amount of polyphosphoric acid, the sample P-PCNFs-1.0 with the best electrochemical performance was obtained. In the sample three-electrode system, when the current density is 0.5 A g−1, the specific capacitance reaches 228.7 F g−1. When the current density is 10 A g−1, the specific capacitance is 183 F g−1, and the capacitance retention rate reaches 84.37%. After 5000 cycles of charging, the capacitance remains unchanged. At the same time, in the two-electrode system, the material can withstand higher voltage intervals in the aqueous electrolyte, increasing the power density and energy density of the material. The excellent electrochemical properties of the material are attributed to the proper pore structure and doping of phosphorus. They not only optimize the mass transfer rate of ions in the electrolyte, but also greatly improve the surface wettability and pseudocapacitive capacitance of the materials.Conflicts of interest
The authors declare no conflicts of interest.Acknowledgements
This work was supported by the National Natural Science Foundation of China (21567015), and the National Key Research and Development Program of China (2016YFC0202900).References
- S. Zheng, X. Li and B. Yan, et al., Transition-Metal (Fe, Co, Ni) Based Metal-Organic Frameworks for Electrochemical Energy Storage, Adv. Energy Mater., 2017, 7(18), 1602733 CrossRef.
- S. Zheng, H. Xue and H. Pang, Supercapacitors based on metal coordination materials, Coord. Chem. Rev., 2017, 373, 2–21 CrossRef.
- X. Xiao, Q. Li and X. Yuan, et al., Ultrathin Nanobelts as an Excellent Bifunctional Oxygen Catalyst: Insight into the Subtle Changes in Structure and Synergistic Effects of Bimetallic Metal-Organic Framework, Small Methods, 2018, 1800240 CrossRef.
- X. Mao, T. Hatton and G. Rutledge, A Review of Electrospun Carbon Fibers as Electrode Materials for Energy Storage, Curr. Org. Chem., 2013, 17(13), 1390–1401 CrossRef CAS.
- C. Kim and K. S. Yang, Electrochemical properties of carbon nanofiber web as an electrode for supercapacitor prepared by electrospinning, Appl. Phys. Lett., 2003, 83(6), 1216–1218 CrossRef CAS.
- K. Wang, Y. Wang and Y. Wang, et al., Mesoporous Carbon Nanofibers for Supercapacitor Application, J. Phys. Chem. C, 2009, 113(3), 1093–1097 CrossRef CAS.
- M. A. Chang, Y. Song and J. Shi, et al., Preparation and one-step activation of microporous carbon nanofibers for use as supercapacitor electrodes, Carbon, 2013, 51(1), 290–300 Search PubMed.
- Y. Hyun, H. Kim and C. S. Lee, Synthesis of Carbon Nanofibers on Iron and Copper Catalysts by Chemical Vapor Deposition, Adv. Mater. Res., 2013, 750–752 Search PubMed.
- M. Zheng, J. Cao and X. Ke, et al., One-step synthesis of new mesoporous carbon nanofibers through an easy template method, Carbon, 2007, 45(5), 1111–1113 CrossRef CAS.
- H. Zhang, F. Ye and H. Xu, et al., Synthesis of carbon hollow particles by a simple inverse-emulsion method, Mater. Lett., 2010, 64(13), 1473–1475 CrossRef CAS.
- Z. Zhang, X. Li and C. Wang, et al., Polyacrylonitrile and Carbon Nanofibers with Controllable Nanoporous Structures by Electrospinning, Macromol. Mater. Eng., 2010, 294(10), 673–678 CrossRef.
- F. Jian, H. T. Niu and T. A. Lin, Applications of electrospun nanofibers, Chin. Sci. Bull., 2008, 53(15), 2265–2286 Search PubMed.
- S. Ramakrishna, K. Fujihara and W. E. Teo, et al., Electrospun nanofibers: solving global issues, Mater. Today, 2006, 9(3), 40–50 CrossRef CAS.
- Y. Q. Feng, F. L. Tang and J. W. Lang, et al., Facile Approach to Preparation of Nitrogen-doped Graphene and Its Supercapacitive Performance, J. Inorg. Mater., 2013, 28(06), 677–682 CrossRef CAS.
- A. R. John and P. Arumugam, Open ended nitrogen-doped carbon nanotubes for the electrochemical storage of energy in a supercapacitor electrode, J. Power Sources, 2015, 277, 387–392 CrossRef CAS.
- H. Guo and Q. Gao, Boron and nitrogen co-doped porous carbon and its enhanced properties as supercapacitor, J. Power Sources, 2009, 186(2), 551–556 CrossRef CAS.
- L. Niu, Z. Li and W. Hong, et al., Pyrolytic synthesis of boron-doped graphene and its application as electrode material for supercapacitors, Electrochim. Acta, 2013, 108, 666–673 CrossRef CAS.
- X. Yan, Y. Yu and X. Yang, Effects of electrolytes on the capacitive behavior of nitrogen/phosphorus co-doped nonporous carbon nanofibers: an insight into the role of phosphorus groups, RSC Adv., 2014, 4(48), 24986 RSC.
- X. Yan, Y. Liu and X. Fan, et al., Nitrogen/phosphorus co-doped nonporous carbon nanofibers for high-performance supercapacitors, J. Power Sources, 2014, 248, 745–751 CrossRef CAS.
- G. Xu and B. Ding, et al., Porous nitrogen and phosphorus co-doped carbon nanofiber networks for high performance electrical double layer capacitors, J. Mater. Chem. A, 2015, 3(46), 23268–23273 RSC.
- D. Hulicova-Jurcakova, et al., Highly Stable Performance of Supercapacitors from Phosphorus-Enriched Carbons, J. Am. Chem. Soc., 2009, 131(14), 5026–5027 CrossRef CAS PubMed.
- P. A. Basnayaka, et al., High Performance Asymmetric Supercapacitors Based on Dual Phosphorus (P) and Nitrogen (N) Co-Doped Carbon and Graphene-Polyaniline Electrodes, ECS Journal of Solid State Science and Technology, 2017, 6(6), M3168–M3172 CrossRef CAS.
- J. Yi, Y. Qing, C. T. Wu, Y. Zeng, Y. Wu and X. Lu, et al., Lignocellulose-derived porous phosphorus-doped carbon as advanced electrode for supercapacitors, Journal of Power Sources, 2017, 351, 130–137 CrossRef CAS.
- M. Wu, Y. Wang and Z. Wei, et al., Ternary Doped Porous Carbon Nanofibers with Excellent ORR and OER Performance for Zinc-air Battery, J. Mater. Chem. A, 2018, 6, 10918–10925 RSC.
- L. Wang, Y. Wang and M. Wu, et al., Nitrogen, Fluorine, and Boron Ternary Doped Carbon Fibers as Cathode Electrocatalysts for Zinc–Air Batteries, Small, 2018, 14(20), e1800737 CrossRef PubMed.
- H. Jin, et al., Three-dimensional interconnected porous graphitic carbon derived from rice straw for high performance supercapacitors, Journal of Power Sources, 2018, 384, 270–277 CrossRef CAS.
- H. Zhao, L. Wang and D. Jia, et al., Coal based activated carbon nanofibers prepared by electrospinning, J. Mater. Chem. A, 2014, 2(24), 9338–9344 RSC.
- D. Zhang, et al., Ultra-facile fabrication of phosphorus doped egg-like hierarchic porous carbon with superior supercapacitance performance by microwave irradiation combining with self-activation strategy, J. Power Sources, 2017, 372, 260–269 CrossRef CAS.
- C. Saucier, et al., Microwave-assisted activated carbon from cocoa shell as adsorbent for removal of sodium diclofenac and nimesulide from aqueous effluents, J. Hazard. Mater., 2015, 289, 18–27 CrossRef CAS PubMed.
- K. Yang, et al., Preparation of high surface area activated carbon from coconut shells using microwave heating, Bioresour. Technol., 2010, 101(15), 6163–6169 CrossRef CAS PubMed.
- X. Zhao, et al., Preparation of porous carbon materials via direct carbonization of waste mineral water bottles and their super capacitive properties, Ionics, 2017, 23(5), 1239–1248 CrossRef CAS.
- Y. Chen, et al., Effects of transition metal ions on the electrochemical performance of polypyrrole electrode, J. Mater. Sci.: Mater. Electron., 2018, 29(13), 11020–11029 CrossRef CAS.
- C. Ma, et al., Preparation and molten salt-assisted KOH activation of porous carbon nanofibers for use as supercapacitor electrodes, J. Porous Mater., 2017, 24(6), 1437–1445 CrossRef CAS.
- Y. Ou, C. Peng, J. Lang, D. Zhu and X. Yan, Hierarchical porous activated carbon produced from spinach leaves as an electrode material for a electric double layer capacitor, New Carbon Mater., 2014, 77(3), 1196 CrossRef CAS.
- M. Thommes, Physisorption of gases, with special reference to the evaluation of surface area and pore size distribution (IUPAC technical report), Pure Appl. Chem., 2016, 38(1), 25 Search PubMed.
- X. Wang, Y. Zhao, W. Lingling, C. Zhang and J.-X. Jiang, Nitrogen-rich conjugated microporous polymers: impact of building block on porosity and gas adsorption, J. Mater. Chem. A, 2015, 3(42), 21185–21193 RSC.
- Z. Chen, K. Li and L. Pu, The performance of phosphorus (P)-doped activated carbon as a catalyst in air-cathode microbial fuel cells, Bioresour. Technol., 2014, 170, 379–384 CrossRef CAS PubMed.
- Y. Zhou, et al., Phosphorus/sulfur Co-doped porous carbon with enhanced specific capacitance for supercapacitor and improved catalytic activity for oxygen reduction reaction, J. Power Sources, 2016, 314, 39–48 CrossRef CAS.
- J. Zhou, et al., Nitrogen-doped hierarchical porous carbon materials prepared from meta-aminophenol formaldehyde resin for supercapacitor with high rate performance, Electrochim. Acta, 2015, 153, 68–75 CrossRef CAS.
- X. Yan, et al., Nitrogen/phosphorus co-doped nonporous carbon nanofibers for high-performance supercapacitors, J. Power Sources, 2014, 248, 745–751 CrossRef CAS.
- J. R. Pels, F. Kapteijn, J. A. Moulijn, Q. Zhu and K. M. Thomas, Evolution of nitrogen functionalities in carbonaceous materials during pyrolysis, Carbon, 1995, 33(11), 1641–1653 CrossRef CAS.
- Y. Wen, et al., Synthesis of Phosphorus-Doped Graphene and its Wide Potential Window in Aqueous Supercapacitors, Chem.–Eur. J., 2015, 21(1), 80–85 CrossRef CAS PubMed.
- A. M. Puziy, et al., XPS and NMR studies of phosphoric acid activated carbons, Carbon, 2008, 46(15), 2113–2123 CrossRef CAS.
- J. M. Rosas, et al., Kinetic study of the oxidation resistance of phosphorus-containing activated carbons, Carbon, 2012, 50(4), 1523–1537 CrossRef CAS.
- L. Wang, et al., Porous Graphitic Carbon Nanosheets Derived from Cornstalk Biomass for Advanced Supercapacitors, ChemSusChem, 2013, 6(5), 880–889 CrossRef CAS PubMed.
- L. F. Chen, X. D. Zhang and H. W. Liang, et al., Synthesis of Nitrogen-Doped Porous Carbon Nanofibers as an Efficient Electrode Material for Supercapacitors, ACS Nano, 2012, 6(8), 7092–7102 CrossRef CAS PubMed.
- G. Xu and B. Ding, et al., Porous nitrogen and phosphorus co-doped carbon nanofiber networks for high performance electrical double layer capacitors, J. Mater. Chem. A, 2015, 3(46), 23268–23273 RSC.
- H. Zhao and L. Wang, et al., Coal based activated carbon nanofibers prepared by electrospinning, J. Mater. Chem. A, 2014, 2(24), 9338–9344 RSC.
- W. Yang, Study on Preparation of Nanocarbon Fibers from Wheat-Straw Based on Electrostatic Spinning Method and its Application in Supercapacitor, Int. J. Electrochem. Sci., 2017, 5587–5597 CrossRef CAS.
- D. Carriazo, et al., Phosphate-Functionalized Carbon Monoliths from Deep Eutectic Solvents and their Use as Monolithic Electrodes in Supercapacitors, ChemSusChem, 2012, 5(8), 1405–1409 CrossRef CAS PubMed.
- C. Huang, T. Sun and D. Hulicova-Jurcakova, Wide Electrochemical Window of Supercapacitors from Coffee Bean-Derived Phosphorus-Rich Carbons, ChemSusChem, 2013, 6(12), 2330–2339 CrossRef CAS PubMed.
| This journal is © The Royal Society of Chemistry 2019 |


