 Open Access Article
Sn-encapsulated N-doped porous carbon fibers for enhancing lithium-ion battery performance†
Zhilong Xu,
Lei Fan*,
Xiangying Ni,
Jie Han * and
Rong Guo
School of Chemistry and Chemical Engineering, Yangzhou University, Yangzhou, Jiangsu 225002, P. R. China. E-mail: fanlei@yzu.edu.cn; hanjie@yzu.edu.cn
First published on 18th March 2019
Abstract
Tin (Sn) has wide prospects in applications as an anode electrode material for Li-ion batteries, due to its high theoretical specific capacity. However, the large volume expansion of Sn during the charge–discharge process causes a performance reduction of lithium-ion batteries (LIBs). Here, Sn encapsulated N-doped porous carbon fibers (Sn/NPCFs) were synthesized through an electrospinning method with a pyrolysis process. This structure was beneficial for the lithium ion/electron diffusion and buffered the large volume change. By adjusting the amount of Sn, the hybrid carbon fibers with different Sn/carbon ratios could be prepared, and the morphology, composition and properties of the Sn/NPCFs were characterized systematically. The results indicated that the Sn/NPCFs with a Sn-precursor/polymer weight ratio at 0.5![[thin space (1/6-em)]](https://www.rsc.org/images/entities/char_2009.gif) :
:![[thin space (1/6-em)]](https://www.rsc.org/images/entities/char_2009.gif) 1 showed the best cycling stability and specific capacity, preserving the specific capacity of 400 mA h g−1 at the current density of 500 mA g−1 even after 100 cycles.
1 showed the best cycling stability and specific capacity, preserving the specific capacity of 400 mA h g−1 at the current density of 500 mA g−1 even after 100 cycles.
Introduction
Lithium-ion batteries, due to their high capacity and long cycling life, have been presented as a meaningful prospect for applications in a variety of fields, including portable electronic devices, grid energy storage and electric vehicles.1 Currently, many anode materials have been developed, including graphite,2–4 silicon,5 tin (Sn)6 and ferroferric oxide.7 Among these materials, Sn, as a transition metal with high theoretical specific capacity, is widely used as an anode electrode for LIBs.8 However, Sn-based materials still have serious defects. One of the most urgent problems is volume expansion during the charge and discharge process, because the large volume expansion of Sn during the lithiation/delithiation process usually causes a performance reduction of lithium-ion batteries (LIBs).9–11 To address this drawback, two strategies have been proposed: one is to prepare small-sized Sn particles to reduce the absolute volume;12–14 and the other is to design a hollow structure in electrodes to provide the space for volume expansion.15–18 For example, some core/shell, yolk–shell, and multilayer structure Sn/carbon materials have been reported.19–22 Nevertheless, when they are used as electrode materials, it is often necessary to add binders and conductors to improve the electron transport ability, even though they make no contribution to the improvement of capacity. Considering this, one-dimensional (1D) nanomaterials (for instance: nanowires, nanotubes and nanofibers) may give an opportunity to improve the electrochemical performance and battery lifetime, due to their special electrical and physical properties.23–28Electrospinning is a common method to prepare 1D polymer fibers.29 Polyacrylonitrile (PAN) is the most widely used polymer in electrospinning, which is also used as a carbon fiber precursor.30 Dong et al.31 grew ZIF-67 nanocrystals on PAN/2-methylimidazole nanofibers and carbonized to obtain graded porous carbon nanofibers/Co3O4 composite nanomaterials, which showed excellent electrochemical performance. As to Sn/carbon materials, although some pore structures could be formed during the carbonization process, their pore size is generally small and could not provide sufficient space for the expansion of metal tin. Therefore, it is necessary to design a more reasonable Sn-based anode material to control the size and void volume.
In this paper, we reported the synthesis of Sn/NPCFs by electrospinning method with a carbonization process. The porous structure of Sn/NPCFs could promote the diffusion of lithium ions into their inward structure and transport of electrons during the charge/discharge process and provide space for volume expansion of Sn, which is benefit for the improvement of lithium-ion battery performance. Form the results we can find that the addition of Sn can increase the specific capacity of the anode materials, it still reveals a good cycle stability.
Experimental
Materials
Ethanol, N,N-dimethylformamide, sodium hydroxide, urea and ammonia water were sold by Sinopharm Chemical Reagent Co. Ltd. (China). Polyacrylonitrile (PAN), polyvinylpyrrolidone (PVP) and potassium stannate trihydrate (K2SnO3) were obtained from Shanghai Aladdin Biochemical Technology Co., Ltd. (China). Tetraethyl orthosilicate (TEOS) was sold by Sigma Aldrich (Shanghai) Trading Co., Ltd. The electrolyte solution with 1 M LiPF6/ethylene carbonate (EC)/diethyl carbonate (DMC)/ethyl methyl carbonate (EMC) (1![[thin space (1/6-em)]](https://www.rsc.org/images/entities/char_2009.gif) :
:![[thin space (1/6-em)]](https://www.rsc.org/images/entities/char_2009.gif) 1
1![[thin space (1/6-em)]](https://www.rsc.org/images/entities/char_2009.gif) :
:![[thin space (1/6-em)]](https://www.rsc.org/images/entities/char_2009.gif) 1 by volume) were purchased from Guangzhou Tinci Materials Technology Co., Ltd. (China).
1 by volume) were purchased from Guangzhou Tinci Materials Technology Co., Ltd. (China).
Synthesis of SiO2
SiO2 nanospheres were synthesized according to the literature.32 First, 3.15 mL of ammonia water was added to a mixed solution of 74 mL of absolute ethanol and 10 mL of deionized water, and then stirred for 1 h. Next, 6 mL TEOS was added to the above mixture and kept stirring for another 3 h at 50 °C. Finally, the SiO2 nanoparticles were separated by centrifugation, washed and dried for further use.Synthesis of SnO2/SiO2
SnO2/SiO2 nanospheres were synthesized according to the literature.33 20 mg SiO2, 50 mg K2SnO3, 450 mg CO(NH2)2 and 5.62 mL deionized water were added to a 25 mL beaker. The sample was homogenized by sonication with the addition of 9.38 mL ethanol. Next, the mixture was transferred into a Teflon-lined autoclave, reacted at 170 °C for 1 h. After cooled to room temperature, the product was gathered by centrifugation (6000 rpm, 8 min), then washed with distilled water and ethanol several times. Then black powders of SnO2/SiO2 were obtained after dried at 60 °C overnight.Synthesis of SnO2/SiO2/PVP/PAN fibers
A certain amount of SnO2/SiO2 was dispersed in 2.67 mL DMF. After the treatment with ultrasound for 1 h, 0.76 g PVP in 2.67 mL DMF was added slowly. Next, 0.76 g PAN was added into the above dispersion and stirred for 4–5 h. Then the above mixture was poured into a 10 mL syringe with an inner diameter of 6 mm. In the electrospinning process, the applied voltage was controlled at 15 kV, the distance was 15 cm with the flow rate of 0.2 mm min−1.Synthesis of Sn/NPCFs fibers
The above obtained fibers were then stabilized in N2 atmosphere at 250 °C for 1 h at 1 °C min−1, and then calcinated at 800 °C for 2 h at 5 °C min−1. After that, the fibers were soaked in 1 M NaOH for 2 h, washed with deionized water until pH = 7, and finally dried at 65 °C. The synthesis of carbon fibers without Sn were according to the literature.34 By controlling the different mass ratios of SnO2/SiO2 and PAN/PVP (SnO2/SiO2![[thin space (1/6-em)]](https://www.rsc.org/images/entities/char_2009.gif) :
:![[thin space (1/6-em)]](https://www.rsc.org/images/entities/char_2009.gif) PAN/PVP = 0.2
PAN/PVP = 0.2![[thin space (1/6-em)]](https://www.rsc.org/images/entities/char_2009.gif) :
:![[thin space (1/6-em)]](https://www.rsc.org/images/entities/char_2009.gif) 1, 0.5
1, 0.5![[thin space (1/6-em)]](https://www.rsc.org/images/entities/char_2009.gif) :
:![[thin space (1/6-em)]](https://www.rsc.org/images/entities/char_2009.gif) 1, 1
1, 1![[thin space (1/6-em)]](https://www.rsc.org/images/entities/char_2009.gif) :
:![[thin space (1/6-em)]](https://www.rsc.org/images/entities/char_2009.gif) 1), a series of Sn/NPCFs could be obtained and denoted as Sn/NPCFs-0.2, Sn/NPCFs-0.5, Sn/NPCFs-1, respectively.
1), a series of Sn/NPCFs could be obtained and denoted as Sn/NPCFs-0.2, Sn/NPCFs-0.5, Sn/NPCFs-1, respectively.
Electrochemical tests
We punched the carbon material into a circular shape with a diameter of 16 mm. Since the self-supporting structure the carbon fiber can be directly used as a anode electrode material without adding any binder. The CR2032 coin-type cells were assembled in argon-filled glove box. Cyclic voltammograms (CVs) was performed using an electrochemical workstation (VMP3, Bio-logic, France) at a scan rate of 0.1 mV s−1 between 0.01 and 3.0 V. Galvanostatic charge and discharge cycling of the cells were carried out using a battery test system (CT-3008W, Xinwei, China) and the current densities were between 0.01 and 3 V (vs. Li+/Li) at the current density of 0.5 A g−1. The thickness of the Sn/NPCFs electrode is 200 ± 20 μm and the average area mass loading of the active materials on the Sn/NPCFs electrodes is 1.5 ± 0.15 mg cm−2.Characterization
The morphology of the as-obtained Sn/NPCFs was obtained with scanning electron microscopy (SEM, Zeiss 55), transmission electron microscopy (TEM, JEM-2100), high-resolution TEM (HRTEM, Tecnai G2 F30 S-Twin). The crystal structure of the material was measured by X-ray diffraction (XRD, D8 Advance). The elemental valence was measured by X-ray photoelectron spectroscopy (XPS, ESCALAB 250Xi). The thermal stability of materials was inspected by thermogravimetric analysis (TGA, Pyris 1 TGA) from room temperature to 800 °C in an oxygen atmosphere using a temperature ramp of 5°C min−1. The specific surface area and pore size distribution were studied by the gas sorption analysis instrument (Beishide, 3H-2000PS2).Results and discussion
The synthetic steps are displayed in Scheme 1. First, the average size of the uniform SiO2 nanoparticles (Fig. S1†) was 200 nm.32 Next, SiO2/SnO2 nanoparticles were obtained through the hydrothermally reaction between SiO2, K2SnO3 and CO(NH2)2. Fig. 1a confirmed that SnO2 evenly distributed on the surfaces of SiO2 nanoparticles. It can be seen from Fig. S2† that SnO2 was uniformly scattered on the external of SiO2, and the energy dispersive X-ray spectroscopic (EDS) elemental analysis and EDS mapping had been used, and the results were also confirmed to be consistent with Fig. S2b–f.† After electrospinning, SiO2/SnO2 polymer fibers could be obtained, as displayed in Fig. 1b. Through the carbonization and NaOH etching, SnO2 was converted into Sn, yield of Sn/NPCFs (Fig. 1b). The SEM image of Sn/NPCFs-0.5, shown in Fig. 1c, indicated that the diameter of the carbon fibers was about 1.3 μm. Moreover, the obvious pores in the carbon fibers could be surveyed from the TEM image (Fig. 1d), and the number of pores in the fiber was increased with the SiO2/SnO2 content (Fig. S3 a and b†). The TEM image of Sn/NPCFs-0.5 clearly indicated that the Sn nanoparticles (in red circles) were in the porous carbon fibers (Fig. 1d illustration). Similarly, Sn nanoparticles could also be found in Sn/NPCFs-0.2 and Sn/NPCFs-1, and the amount of Sn nanoparticles in fibers increased with the mass ratio of SiO2/SnO2 increasing (Fig. S4†). The Fig. 2a exhibits the hollow interior explicitly. The composition of Sn/NPCFs could be further confirmed according to the elemental mapping. The EDS mapping of C, N, and Sn elements within a single hollow space was behave in Fig. 2b–e, indicating the elements distributed in the shell evenly. It was worth emphasizing that Sn were uniformly attached to the inner wall of the hole after carbonization. This porous structure is conducive to the transfer of lithium ions and provides the channels for the transmission of lithium ions into the inner part of the electrode material.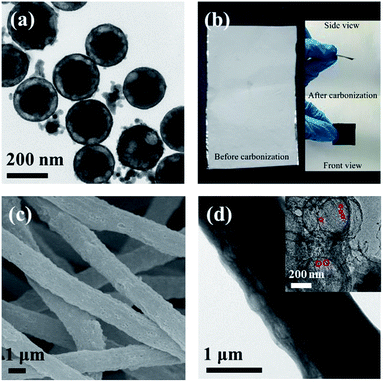 | ||
| Fig. 1 (a) TEM image of SiO2/SnO2, (b) the image of monolayer fiber before and after carbonization, (c) SEM image of Sn/NPCFs-0.5, (d) TEM image of Sn/NPCFs-0.5. | ||
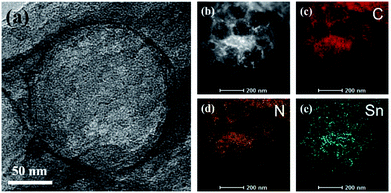 | ||
| Fig. 2 (a) HRTEM image of Sn/NPCFs-0.5. (b) HAADF-STEM image of Sn/NPCFs-0.5 and (c and d) EDS mappings of (c) C, (d) N and (e) Sn from Sn/NPCFs-0.5 particle given in panel (b). | ||
The crystal structures of Sn/NPCFs-0.2, Sn/NPCFs-0.5 and Sn/NPCFs-1 were determined through the XRD measurements and the results were presented in Fig. 3a. The typical peaks for Sn could be evidenced (JCPDS no: 86-2265). The content of Sn was then analyzed by TGA.35 With the increase of the SnO2/SiO2 ratio, the remaining amount of the Sn gradually increased from 18.6% to 24.1% (Fig. 3b). After 600 °C, the TGA curve has a slow upward trend, indicating that part of Sn was oxidized to SnO, and even oxidized to SnO2, which could further prove the existence of Sn in the fibers. The specific surface area (SSA) of Sn/NPCFs was measured with the multipoint Brunauer–Emmett–Teller (BET) method, the porous structure was calculated by using the Barrett–Joyner–Halenda (BJH) method. The nitrogen adsorption–desorption isotherm was shown in Fig. S5† and in a typical type IV curve. The SSAs of the NPCFs, Sn/NPCFs-0.2, Sn/NPCFs-0.5 and Sn/NPCFs-1 were 40.99 m2 g−1, 43.95 m2 g−1, 93.55 m2 g−1 and 155.4 m2 g−1, respectively. Meanwhile, the pore sizes were about 3.30 nm, 3.97 nm, 4.05 nm, 4.03 nm, respectively. It was easy to confirm that the mass ratio of SiO2/SnO2 was the main impact factor for the specific surface area of the material. The related data had been arranged in the Table S1.† From the Table S1,† it can be found that the Sn/NPCFs-0.5 has the biggest volume of pores, which was in favor of the transfer of lithium ions.
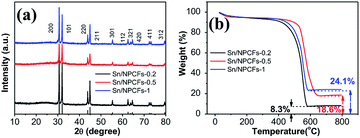 | ||
| Fig. 3 (a) XRD pattern of Sn/NPCFs-0.2, Sn/NPCFs-0.5 and Sn/NPCFs-1; (b) TGA of Sn/NPCFs-0.2, Sn/NPCcFs-0.5 and Sn/NPCFs-1. | ||
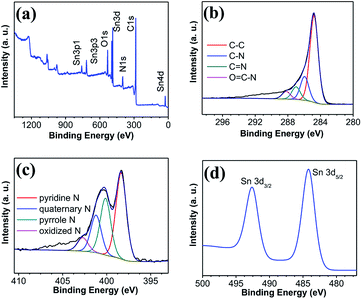
The XPS further confirmed that Sn/NPCFs-0.5 comprised the C, N, O, and Sn, respectively (Fig. 4a). This result was consistent with the EDS analysis (Fig. S6†). As denoted in Fig. 4a, the peaks appeared at 531 eV, 484 eV, 400 eV, and 284 eV corresponding to O 1s, Sn 3d, N 1s, and C 1s peaks originated from Sn and PAN were observed. The C 1s spectrum of Sn/NPCFs-0.5 was given in Fig. 4b. The peaks at 284.8, 286.0, 287.0, and 288.2 eV were ascribed to the binding energy of graphitized carbon, C–N group, C![[double bond, length as m-dash]](https://www.rsc.org/images/entities/char_e001.gif) N group and O
N group and O![[double bond, length as m-dash]](https://www.rsc.org/images/entities/char_e001.gif) C–N group bonds, respectively.36 The N 1s spectra of Sn/NPCFs-0.5 (Fig. 4c) could be analyzed into pyridine N (398.3 eV), pyrrole N (400.1 eV), quaternary N (401.2 eV) and oxidized N (402.7 eV).37 More open channels and active sites were created by pyridinic N and pyrrolic N, which were in favor for the Li+ insertion.38 The Sn 3d spectra of Sn/NPCFs-0.5 (Fig. 4d) was put down to Sn 3d5/2 (484.3 eV) and Sn 3d3/2 (492.6 eV).39 The spin energy separation between the two peaks is 8.5 eV, which verified the existence of Sn.40 In summary, the Sn/carbon fiber porous composite material was successfully framed, and the Sn/NPCFs electrode was electrochemically test.
C–N group bonds, respectively.36 The N 1s spectra of Sn/NPCFs-0.5 (Fig. 4c) could be analyzed into pyridine N (398.3 eV), pyrrole N (400.1 eV), quaternary N (401.2 eV) and oxidized N (402.7 eV).37 More open channels and active sites were created by pyridinic N and pyrrolic N, which were in favor for the Li+ insertion.38 The Sn 3d spectra of Sn/NPCFs-0.5 (Fig. 4d) was put down to Sn 3d5/2 (484.3 eV) and Sn 3d3/2 (492.6 eV).39 The spin energy separation between the two peaks is 8.5 eV, which verified the existence of Sn.40 In summary, the Sn/carbon fiber porous composite material was successfully framed, and the Sn/NPCFs electrode was electrochemically test.
The electrochemical reactivity of Sn/NPCFs-0.5 was evaluated by CVs at a sweep speed of 0.1 mV s−1 (Fig. 5a). The CV curves demonstrated that a broad irreversible peak occurs at the first cycle, owing to the Li+ formation during the migration process and the reaction between the anode electrode and the electrolyte leading to the solid electrolyte interface (SEI) film.41 The formation of SEI film leaded to the difference between the first and the second cathodic scans. During the cathodic sweep, the reduction peaks located at 0.21, 0.34, and 0.62 V were intrinsically attributed to the lithiation into Sn to form LixSn alloy.41,42 During the anodic scan, the oxidation peaks at 0.53 V, 0.67 V and 0.80 V were corresponding to the delithiation reaction of LixSn alloy.43 The good cycle stability of Sn/NPCFs is evidenced by the overlap of the CV curves after the second cycle.44 In the CV curve, there is a significant reduction peak at 1.1 V in the second pass, indicating that lithium is inserted into the carbon fiber matrix.45,46 Simultaneously, it could also be proved by a wide small oxidation peak at 1.3 V. Furthermore, an oxidation peak was appeared at about 2.95 V in the first scan, which disappears in the subsequent cycle. This is due to the disintegration of the SEI film.40,47,48 The charge–discharge voltage profiles of the pure NPCFs, Sn/NPCFs-0.2, Sn/NPCFs-0.5 and Sn/NPCFs-1 were shown in Fig. 5b–d and S3.† The coulombic efficiency (CE) of the initial cycle of Sn/NPCFs-0.2, Sn/NPCFs-0.5, Sn/NPCFs-1 were 65.5%, 62.9% and 59.6%, respectively. The CE difference of each Sn/NPCFs for initial cycle was not obvious. But the CE of Sn/NPCFs-0.5 for the subsequent cycles was 94.3%, which was higher than the CE of Sn/NPCFs-0.2 and Sn/NPCFs-1 (76.08% and 90.72%). In Fig. S7,† the charge and discharge capacity of NPCFs indicated that the porous N-doped carbon material had a positive effect on the capacity. It should be ascribed to the doped heteroatom (such as N) could enhance electrochemical reactivity and electron conductivity, as well as the performance of LIBs and supercapacitor with high energy and power density.49,50 The NPCFs material increases the coulombic efficiency, but the specific capacity was still unsatisfactory. The heteroatoms in the carbon structure can increase the conductivity and capacity of the carbon-based material, thereby increasing the coulombic efficiency of the NPCFs. In Fig. 5b, the charge/discharge of first cycle capacity of Sn/NPCFs-0.2 were improved to 744, 481 mA h g−1, respectively. By comparing the charge/discharge capacity data of Sn/NPCFs and NPCFs, it was found that the addition of Sn had a great improvement on the specific capacity of the material. The charge and discharge of the increased content of Sn were exhibited in Fig. 5c. The charge/discharge of second cycle of Sn/NPCFs-0.5 had a significant coulomb efficiency improvement over the first cycle. The irreversible capacity loss of Sn/NPCFs-0.5 was mainly caused by the first irreversible cycle, which agreed with the CV curves. After 4 cycles, the capacity of the electrode material was substantially not attenuated, and the specific capacity retention rate was 86%, which indicated that the stability of the electrode material was particularly good. Moreover, from the fourth cycle, the coulombic efficiency was almost 100%. In Fig. 5d, Sn/NPCFs-1 had no significant increase in specific capacity after thirty cycles of charging and discharging compared with Sn/NPCFs-0.5. The Sn/NPCFs-0.5 electrode delivered a lithium storage capacity of 375 mA h g−1 after 30 cycles, better than previously reported Sn/graphene nanocomposite.51 Without the Sn-encapsulated, NPCFs shows the worst specific capacity.
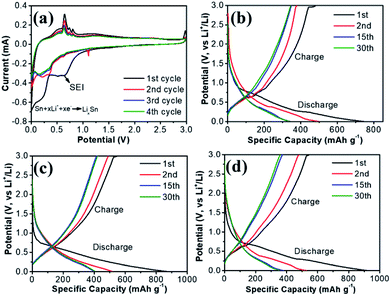 | ||
| Fig. 5 (a) Cyclic voltammograms (CVs) of Sn/NPCFs-0.5 at a scan rate of 0.1 mVs−1, voltage profiles of (b) Sn/NPCFs-0.2, (c) Sn/NPCFs-0.5, (d) Sn/NPCFs-1 at 0.5 A g−1. | ||
In order to study the cycling performance of materials, it was subjected to 100 cycles of charge and discharge. The discharge capacity of the Sn/NPCFs-0.2 electrode was significantly higher than that of the NPCFs after 100 cycles. Nevertheless, the Sn/NPCFs-0.5 electrode still hold comparatively high discharge capacity of 400 mA h g−1. The second cycle retains 82.1% of the first (Fig. 6a). In addition, the discharge capacity of the Sn/NPCFs-1 was 377 mA h g−1 (≈70.9% preservation of the second cycle). The carbon cycle stability was good, but the specific capacity was low. With the increase of Sn, the specific capacity had increased. Once the content of Sn was too much, the electrode cycle stability and specific capacity were not significantly improved. Fig. 6b shows the rate performance of Sn/NPCFs-0.5 when it cycles at different rates between 0.05 A g−1 and 2 A g−1. When the current density reverts to 0.1 A g−1 again, the specific capacity reached 639 mA h g−1 that was 85% of the original one. It demonstrated the good cycle stability and specific capacity retention. The cycle performance and capacity of Sn/carbon nanomaterials reported in previous works had been compared with the Sn/NPCFs in Table S2.† Our results indicated certain advantages at low and medium current density.
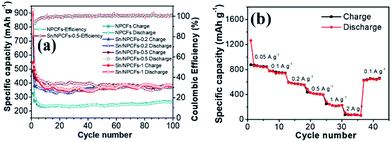 | ||
| Fig. 6 (a) Cycling performance of different electrode materials at 0.5 A g−1, (b) rate performance of Sn/NPCFs-0.5. | ||
Electrochemical impedance spectroscopy (EIS) was used to analyze the difference between Sn/NPCFs-0.5 and other Sn/NPCFs. Fig. S8† shows the impedance of Sn/NPCFs-0.5 on new coin cells on the basis of EIS. The frequency range was set between 100 kHz and 10 mHz with an AC amplitude of 10 mV. It can be seen that the four impedance spectra have similar features. From Fig. S8,† it was apparent that Sn/NPCFs-0.5 has a smaller semicircular arc, indicating that the charge transfer impedance (Rct) of Sn/NPCFs-0.5 is the smallest. According to the equivalent circuit, the Rct of Sn/NPCFs-0.5 is 133.5 Ω, which is smaller than the others (Rct-NPCFs = 235.2 Ω, Rct-Sn/NPCFs-0.2 = 160.3 Ω, Rct-Sn/NPCFs-1 = 140.3 Ω). At the same time, the faster rising linear tail of the low-frequency region indicated that Sn/NPCFs-0.5 has the smallest lithium ion diffusion impedance (Re).
To further understand the electrochemical performance of Sn/NPCFs-0.5, the electrode changes were observed after 5 cycles of charge and discharge at 0.5 A g−1. According to the SEM images, the formation of the SEI film on the electrode after several charge and discharge cycles had been confirmed (Fig. S9a and b†). It can be clearly seen from Fig. S9c† that the composite anode still retains the original appearance of the fibers. Meanwhile, there are also Sn nanoparticles in the fiber pores (Fig. S9d†). This proved that all the Sn nanoparticles are uniformly locked in the pores of the carbon fiber, and the unique structure of the Sn/NPCFs can buffer the volume expansion of the electrode material, thereby ensuring the stability. The excellent electrochemical performance of the Sn/NPCFs-0.5 electrodes might be attributed to the following factors. Firstly, the holes on the surface are beneficial for the lithium ions and electrons transferring to the inner part. Secondly, the porous structure provides a buffer for the volume expansion of lithium-ion batteries during charge and discharge. Finally, the synergistic effect of Sn and carbon composites was embodied in that the specific capacity of Sn is high and the cycle stability of carbon is good.
Conclusions
The Sn/NPCFs composite fiber was obtained by electrospinning method followed by carbonization process. The results express that the Sn/NPCFs-0.5 has the best cyclic stability and specific capacity. The average specific capacity is 400 mA h g−1 at 500 mA h g−1. Because of the high capacity and excellent cycle stability, the Sn/NPCFs composites are expected a promising anode material for lithium-ion batteries.Conflicts of interest
There are no conflicts to declare.Acknowledgements
This work was supported by the National Natural Science Foundation of China (21673202), the University Natural Science Foundation of Jiangsu Province (16KJD150004), The authors gratefully acknowledge financial support from the Priority Academic Program Development of Jiangsu Higher Education Institutions and Top-notch Academic Programs Project of Jiangsu Higher Education Institutions. We would also like to acknowledge the technical support received at the Testing Centre of Yangzhou University.Notes and references
- M. Armand and J. M. Tarascon, Nature, 2008, 451, 652 CrossRef CAS PubMed.
- M. Chhowalla, H. S. Shin, G. Eda, L. J. Li, K. P. Loh and H. Zhang, Nat. Chem., 2013, 5, 263 CrossRef PubMed.
- L. G. Bulusheva, S. G. Stolyarova, A. Chuvilin, Y. Shubin, I. P. Asanov, A. M. Sorokin, M. S. Mel'Gunov, S. Zhang, Y. Dong and X. Chen, Nanotechnology, 2018, 29, 134001 CrossRef CAS PubMed.
- R. Tjandra, W. Liu, L. Lim and A. Yu, Carbon, 2018, 129, 152 CrossRef CAS.
- K. Xiao, Q. Tang, Z. Liu, A. Hu, S. Zhang, W. Deng and X. Chen, Ceram. Int., 2018, 44, 3548 CrossRef CAS.
- N. Zhang, Y. Wang, M. Jia, Y. Liu, J. Xu, L. Jiao and F. Cheng, Chem. Commun., 2018, 54, 1205 RSC.
- R. Zhao, X. Shen, Q. Wu, X. Zhang, W. Li, G. Gao, L. Zhu, L. Ni, G. Diao and M. Chen, ACS Appl. Mater. Interfaces, 2017, 241, 391 Search PubMed.
- J. Hassoun, G. Derrien, S. Panero and B. Scrosati, Adv. Mater., 2008, 20, 3169 CrossRef CAS.
- J.-M. Tarascon and M. Armand, Nature, 2001, 414, 359 CrossRef CAS PubMed.
- A. Sivashanmugam, T. P. Kumar, N. G. Renganathan, S. Gopukumar, M. Wohlfahrt-Mehrens and J. Garche, J. Power Sources, 2005, 144, 197 CrossRef CAS.
- K. Ui, S. Kikuchi, Y. Kadoma, N. Kumagai and S. Ito, J. Power Sources, 2009, 189, 224 CrossRef CAS.
- X. He, W. Pu, L. Wang, J. Ren, C. Jiang and C. Wan, Solid State Ionics, 2007, 178, 833 CrossRef CAS.
- P. Limthongkul, H. Wang, E. Jud and Y.-M. Chiang, J. Electrochem. Soc., 2002, 149, A1237 CrossRef CAS.
- N. Li and C. R. Martin, J. Electrochem. Soc., 2001, 148, A164 CrossRef CAS.
- Y.-X. Yin, S. Xin, L.-J. Wan, C.-J. Li and Y.-G. Guo, J. Nanosci. Nanotechnol., 2012, 12, 2581 CrossRef CAS PubMed.
- H. Wu, G. Chan, J. W. Choi, I. Ryu, Y. Yao, M. T. McDowell, S. W. Lee, A. Jackson, Y. Yang and L. Hu, Nat. Nanotechnol., 2012, 7, 310 CrossRef CAS PubMed.
- Y.-D. Ko, J.-G. Kang, G.-H. Lee, J.-G. Park, K.-S. Park, Y.-H. Jin and D.-W. Kim, Nanoscale, 2011, 3, 3371 RSC.
- U. Lafont, S. Waichman, M. Valvo and E. Kelder, J. Nanosci. Nanotechnol., 2010, 10, 4273 CrossRef CAS PubMed.
- J. S. Chen and X. W. Lou, Small, 2013, 9, 1877 CrossRef CAS PubMed.
- J. Qin, C. He, N. Zhao, Z. Wang, C. Shi, E.-Z. Liu and J. Li, ACS Nano, 2014, 8, 1728 CrossRef CAS PubMed.
- C. Wang, Y. Li, Y.-S. Chui, Q.-H. Wu, X. Chen and W. Zhang, Nanoscale, 2013, 5, 10599 RSC.
- X. Zhou, L. Yu, X. Y. Yu and X. W. Lou, Adv. Energy Mater., 2016, 6, 1601177 CrossRef.
- Z. Xie, J. Zhao and Y. Wang, Electrochim. Acta, 2015, 174, 1023 CrossRef CAS.
- Y. Hu, Q.-R. Yang, J. Ma, S.-L. Chou, M. Zhu and Y. Li, Electrochim. Acta, 2015, 186, 271 CrossRef CAS.
- Y. J. Hong and C. K. Yun, Small, 2015, 11, 2157 CrossRef CAS PubMed.
- J.-C. Kim, G.-H. Lee and D.-W. Kim, Electron. Mater. Lett., 2013, 9, 775 CrossRef CAS.
- L. Hu, H. Wu, S. S. Hong, L. Cui, J. R. McDonough, S. Bohy and Y. Cui, Chem. Commun., 2011, 47, 367 RSC.
- J. Ren, X. He, K. Wang and W. Pu, Ionics, 2010, 16, 503 CrossRef CAS.
- Z.-a. Wang, N. Li, W.-y. Lu and W.-x. Chen, Acta Polym. Sin., 2018, 755 CAS.
- J. Namsaeng, W. Punyodom and P. Worajittiphon, Chem. Eng. Sci., 2019, 193, 230–242 CrossRef CAS.
- H. Wang, Y. Song, Y. Li, M. Wang, Q. Ma, W. Yu, D. Li, X. Dong, J. Wang and G. Liu, RSC Adv., 2018, 8, 30794 RSC.
- B. J. Ji, Z. Qiao, I. Lee, M. Dahl, F. Zaera and Y. Yin, Adv. Funct. Mater., 2012, 22, 166 CrossRef.
- X. W. Lou, C. Yuan and L. A. Archer, Small, 2007, 3, 261 CrossRef CAS PubMed.
- L. Fan, L. Yang, X. Ni, J. Han, R. Guo and C. Zhang, Carbon, 2016, 107, 629 CrossRef CAS.
- X. Li, X. Li, L. Fan, Z. Yu, B. Yan, D. Xiong, X. Song, S. Li, K. R. Adair, D. Li and X. Sun, Appl. Surf. Sci., 2017, 412, 170 CrossRef CAS.
- M. Wang, J. Han, Y. Hu and R. Guo, RSC Adv., 2017, 7, 15513 RSC.
- F. Yang, Z. Zhang, K. Du, X. Zhao, W. Chen, Y. Lai and J. Li, Carbon, 2015, 91, 88 CrossRef CAS.
- Y. Liu, N. Zhang, L. Jiao and J. Chen, Adv. Mater., 2015, 27, 6702 CrossRef CAS PubMed.
- S. Wang, Y. Fang, X. Wang and X. W. Lou, Angew. Chem., Int. Ed., 2019, 58, 760 CrossRef CAS PubMed.
- R. Dai, W. Sun and Y. Wang, Electrochim. Acta, 2016, 217, 123 CrossRef CAS.
- Y. Xu, Q. Liu, Y. Zhu, Y. Liu, A. Langrock, M. R. Zachariah and C. Wang, Nano Lett., 2013, 13, 470 CrossRef CAS PubMed.
- Z. Zhu, S. Wang, J. Du, Q. Jin, T. Zhang, F. Cheng and J. Chen, Nano Lett., 2014, 14, 153 CrossRef CAS PubMed.
- J. L. Tirado, R. Santamaría, G. F. Ortiz, R. Menéndez, P. Lavela, J. M. Jiménez-Mateos, F. J. Gómez García, A. Concheso and R. Alcántara, Carbon, 2007, 45, 1396 CrossRef CAS.
- B. Luo, T. Qiu, D. Ye, L. Wang and L. Zhi, Nano Energy, 2016, 22, 232 CrossRef CAS.
- X. Huang, S. Cui, J. Chang, P. B. Hallac, C. R. Fell, Y. Luo, B. Metz, J. Jiang, P. T. Hurley and J. Chen, Angew. Chem., Int. Ed., 2015, 54, 1490 CrossRef CAS PubMed.
- Y. Xu, Q. Liu, Y. Zhu, Y. Liu, A. Langrock, M. R. Zachariah and C. Wang, Nano Lett., 2013, 13, 470 CrossRef CAS PubMed.
- Y. Zou and Y. Wang, ACS Nano, 2011, 5, 8108 CrossRef CAS PubMed.
- B. Guo, J. Shu, K. Tang, Y. Bai, Z. Wang and L. Chen, J. Power Sources, 2008, 177, 205 CrossRef CAS.
- C. Hu, L. Wang, Y. Zhao, M. Ye, Q. Chen, Z. Feng and L. Qu, Nanoscale, 2014, 6, 8002 RSC.
- Z. Li, Z. Xu, X. Tan, H. Wang, C. M. B. Holt, T. Stephenson, B. C. Olsen and D. Mitlin, Energy Environ. Sci., 2013, 6, 871 RSC.
- G. Wang, B. Wang, X. Wang, J. Park, S. Dou, H. Ahn and K. Kim, J. Mater. Chem., 2009, 19, 8378 RSC.
Footnote |
| † Electronic supplementary information (ESI) available: Additional TEM, SEM, charge and discharge curves of NPCFS. See DOI: 10.1039/c8ra10201e |
| This journal is © The Royal Society of Chemistry 2019 |


