 Open Access Article
Creative Commons Attribution 3.0 Unported Licence
A ratiometric fluorescent probe for detection of exogenous mitochondrial SO2 based on a FRET mechanism†
Zhiyang Xu,
Zhen Chen,
Aikun Liu,
Ruixue Ji,
Xiaoqun Cao and
Yanqing Ge
 *
*
School of Chemistry and Pharmaceutical Engineering, Taishan Medical University, Tai'an 271000, PR China. E-mail: geyanqing2016@126.com; Tel: +86-538-6229741
First published on 18th March 2019
Abstract
A novel imidazo[1,5-a]pyridine-hemicyanine based ratiometric fluorescent probe for detection of mitochondrial SO2 was designed and synthesized. The probe is based on a fluorescence resonance energy transfer (FRET) mechanism. It exhibits high selectivity and sensitivity towards SO32− with a fast response time (3 min) and detection limit of 0.13 μM. Further, it showed low cytotoxicity and was successfully applied to image exogenous mitochondrial SO2 in cells.
Introduction
Sulfur dioxide (SO2), which used to be considered as a toxic environmental pollutant, is now considered to be a new possible signal molecule following nitric oxide, carbon monoxide and hydrogen sulfide.1–4 Cancers, neurological disorders and cardiovascular diseases could be caused by high exogenous SO2 levels. As exogenous SO2 is produced via oxidation of some sulphur-containing amino acids and hydrogen sulfide in mitochondria,5,6 it is extremely important to develop selective, sensitive and rapid methods for SO2 detection in mitochondria.When hydrated in aqueous media, SO2 can be transformed into its derivatives bisulfite (HSO3−) and sulfite (SO32−). Therefore, methods for the detection of HSO3−/SO32− such as electrochemistry, chromatography, titration and capillary electrophoresis have been developed.7–10 However, those methods can not realize imaging in cells.
Since the first sulfite fluorescent probe was reported by Chang group in 2010,11 numerous probes based on nucleophilic reactions with aldehydes, Michael additions, dequenching of levulinate and coordinative interactions have been developed in recent years.12–29 Despite the remarkable progress achieved, limitations such as long detection times and poor water solubility still remain. More importantly, those intensity-based probes are susceptible to factors like external environment, substrate concentration and instrument sensitivity.
Ratiometric fluorescent probes are more advantageous than intensity-based ones. Förster resonance energy transfer (FRET) mechanism is most widely used to construct well-performing ratiometric probes.30–32 To date, some well-behaved ratiometric fluorescent probes for SO2 derivatives have been developed.33–36 However, there is great room for improvement since these probes are still subject to some drawbacks such as unsatisfactory detection limits, long response time, and poor selectivity over H2S. Recently, we successfully synthesized the imidazole[1,5-a]pyridine via a tandem reaction.37–39 Some fluorescent probes based on this new fluorophore for Cu2+, and Hg2+ have been constructed subsequently.40,41 Continuing our efforts to search for new fluorophore and extend their applications,42–53 herein, we report a new FRET platform for the rapid detection of SO2. Imidazole[1,5-a]pyridine was selected as donor, hemicyanine dyad as receptor, and piperazine as connection unit. The probe IPIN-SO2 can detect SO32− rapidly (3 min) and sensitively in a wide pH range of 5–10. More importantly, IPIN-SO2 can be used for imaging exogenous mitochondrial SO2 in cells.
Experimental
Materials and apparatus
UV-vis spectra were recorded on a U-2600 UV-vis spectrometer (Hitachi) and fluorescence spectra were recorded on a RF-5301PC luminescence spectrophotometer (Shimadzu) at room temperature. 1H NMR and 13C NMR spectra were measured on a Bruker Avance 400 (400 MHz) spectrometer (CDCl3 as solvent and tetramethylsilane (TMS) as an internal standard). HRMS spectra were recorded on a Q-TOF6510 spectrograph (Agilent). Nikon fluorescence inverted microscope (Ti 2-U) was used to record cell imaging. All reagents and solvents were purchased from commercial sources and used without further purification. Metal ion solution was prepared by dissolving the deionized water with metal chloride as raw material. The anionic solution was prepared by dissolving sodium containing compounds into deionized water. Deionized water was used in the whole absorption and fluorescence detection process.Cell culture and imaging
Brain glioma cells were cultured in RPMI-1640 containing 10% bovine serum in a 5% CO2/95% air incubator at 37 °C. For cell imaging experiments, the growth medium was removed and replaced by RPMI-1640 without CS. The cells were incubated in a 1 μM IPIN-SO2 incubator at 37 °C and 5% CO2/95% air for 30 minutes. The cells were washed with PBS three times and cell images were obtained via an inverted fluorescence microscope from Ti 2-U (Nikon, ECLIPSE, equipped with FRET system, Mercury lamp light source). For the probe, the excitation light source is 395/25 nm and the emission collected through filter is 605/55 nm and 460/50 nm. The colocalization experiments have been carried out through Laser Scanning Confocal Microscope (FV1000, Olympus). For the probe, the excitation light source is 405 nm and the emission collected is 560–620 nm. For the MitoTracker@ Deep Red, the excitation light source is 633 nm and the emission collected through filter is 650–700 nm.Synthesis
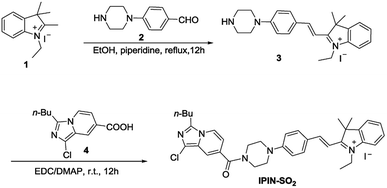
Compound 1 (315 mg, 1 mmol) was dissolved in ethanol (15 mL), then compound 2 (190 mg, 1 mmol) was added, and 3 drops of piperidine were added. After heating and refluxing for 12 hours, the solvent was removed under reduced pressure. A deep red solid was obtained which was used for the next step without further purification.
Compound 4 (253 mg, 1 mmol) was added to 30 mL dichloromethane and then DMAP (183 mg, 1.5 mmol) and EDC (288 mg, 1.5 mmol) were added. After stirring at room temperature for half an hour, compound 3 (488 mg, 1 mmol) was added and stirred for 12 hours at room temperature. Then the solvent was removed under reduced pressure to afford crude compound IPIN-SO2, which was purified on a silica gel column (C2H5OH![[thin space (1/6-em)]](https://www.rsc.org/images/entities/char_2009.gif) :
:![[thin space (1/6-em)]](https://www.rsc.org/images/entities/char_2009.gif) CH2Cl2 = 1
CH2Cl2 = 1![[thin space (1/6-em)]](https://www.rsc.org/images/entities/char_2009.gif) :
:![[thin space (1/6-em)]](https://www.rsc.org/images/entities/char_2009.gif) 100; yields: 68.9%). 1H NMR (400 MHz, CDCl3) δ 8.20 (d, J = 8.0 Hz, 2H), 8.09 (d, J = 12.0 Hz, 1H), 7.76 (d, J = 8.0 Hz, 1H), 7.58–7.50 (m, 7H), 7.02 (d, J = 8.0 Hz, 2H), 6.72 (d, J = 8.0 Hz, 1H), 4.86 (q, J = 8.0 Hz, 2H), 3.86 (s, 4H), 3.66 (s, 4H), 2.97 (t, J = 8.0 Hz, 2H), 1.81 (m, 6H), 1.60 (m, 5H), 1.44 (m, 2H), 0.97 (t, J = 8.0 Hz, 3H). 13C NMR (100 MHz, CDCl3) δ 179.3, 167.6, 154.9, 154.6, 142.6, 140.6, 138.7, 135.2, 129.5, 128.5, 124.1, 122.6, 120.9, 117.9, 114.2, 113.4, 112.3, 106.8, 51.4, 46.7, 44.5, 42.9, 29.0, 27.6, 26.3, 22.5, 22.0, 14.0, 13.8. HRMS: ([M]+); calcd for C36H41ClN5O: 594.2994; found: 594.3003.
100; yields: 68.9%). 1H NMR (400 MHz, CDCl3) δ 8.20 (d, J = 8.0 Hz, 2H), 8.09 (d, J = 12.0 Hz, 1H), 7.76 (d, J = 8.0 Hz, 1H), 7.58–7.50 (m, 7H), 7.02 (d, J = 8.0 Hz, 2H), 6.72 (d, J = 8.0 Hz, 1H), 4.86 (q, J = 8.0 Hz, 2H), 3.86 (s, 4H), 3.66 (s, 4H), 2.97 (t, J = 8.0 Hz, 2H), 1.81 (m, 6H), 1.60 (m, 5H), 1.44 (m, 2H), 0.97 (t, J = 8.0 Hz, 3H). 13C NMR (100 MHz, CDCl3) δ 179.3, 167.6, 154.9, 154.6, 142.6, 140.6, 138.7, 135.2, 129.5, 128.5, 124.1, 122.6, 120.9, 117.9, 114.2, 113.4, 112.3, 106.8, 51.4, 46.7, 44.5, 42.9, 29.0, 27.6, 26.3, 22.5, 22.0, 14.0, 13.8. HRMS: ([M]+); calcd for C36H41ClN5O: 594.2994; found: 594.3003.
Results and discussion
Synthesis of the probe IPIN-SO2
The synthetic route of probe IPIN-SO2 is shown in Scheme 1. Probe IPIN-SO2 was obtained as deep purple solid powder in 89.5% yield through classical condensation of compound 3 and compound 4. The probe IPIN-SO2 was characterized by 1H NMR, 13C NMR and HRMS.UV-vis and fluorescence spectra response of IPIN-SO2
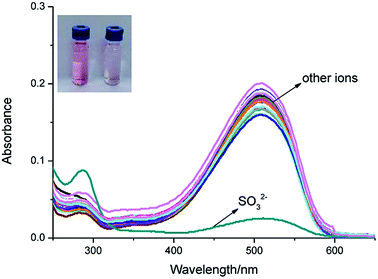
As shown in Fig. 1, IPIN-SO2 is more selective to SO32− compared with other competitive ions, which do not cause any significant absorption changes in the visible region, which can be used as a “naked eye” chemical colorimeter. When added 10 equiv. SO32−, the solution was obviously lighter from pink (Fig. 1, inset).The interaction between IPIN-SO2 and SO32− was further studied by UV-vis spectroscopic titration in 0.1 M PBS (pH = 7.4) buffer solution. IPIN-SO2 showed characteristic absorption at 500 nm. However, when the sulfite was added to the IPIN-SO2 solution, the absorption peak at 500 nm decreased rapidly with the increase of sulfite concentration as shown in Fig. S1.† When 10 equiv. amount of SO32− was added to IPIN-SO2 solution, the fluorescence intensity immediately increased at 475 nm and the fluorescence intensity at 580 nm decreased significantly. By contrast, the other competitive cations did not cause any significant fluorescence changes, indicating that IPIN-SO2 has a better selectivity for SO32− in the fluorescence spectrum as shown in Fig. 2.
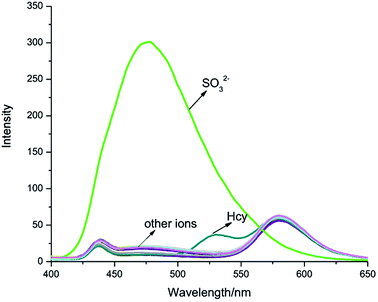 | ||
| Fig. 2 Fluorescence spectra of IPIN-SO2 (10 μM) in 0.1 M PBS (pH = 7.4) buffer solution with addition of 100 μM of various species (λex = 380 nm). | ||
As shown in Fig. 3, the fluorescence titration process of IPIN-SO2 was recorded. In IPIN-SO2 aqueous solution, with the increase of SO32− concentration, the fluorescence intensity increases at 475 nm and decreases at 580 nm, and the two emission peaks can be well separated (105 nm). The results show that the developed FRET system can effectively avoid the overlap of emission spectra and ensure the high resolution and accuracy of the determination. Moreover, when SO32− concentration increased from 0 μM to 30 μM, the fluorescence intensity ratio increased from 0.29 to 12.78, about 44 times. When SO32− concentration was in the range of 1.5–4.0 μM, there was a good linear relationship as shown in Fig. S2.†
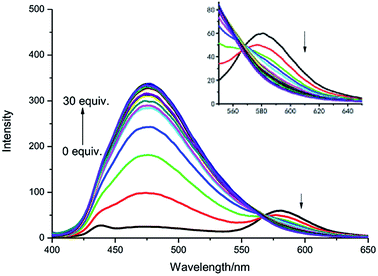 | ||
| Fig. 3 Fluorescence spectra of IPIN-SO2 (10 μM) with the addition of SO32− (0–30 equiv.) in 0.1 M PBS (pH = 7.4) buffer solution (λex = 380 nm). | ||
According to LOD = 3σ/k (σ is the standard deviation of ten blank solutions and k is the slope of the linear calibration plot between the fluorescence intensity and the concentration of SO32−), the detection limit was as low as 0.13 μM.
In addition, the interference experiments were carried out under the coexistence of various species (Fig. 4). Background ions did not interfere with fluorescence intensity. Sulfite-induced fluorescence enhancement (I475/I580) remained unaffected by the coexistence of other species.
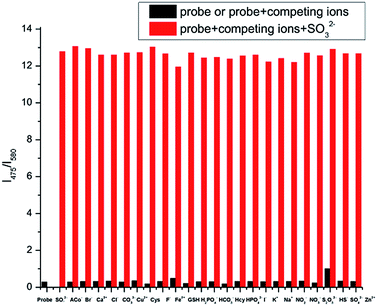 | ||
| Fig. 4 Ratiometric fluorescence responses I475/I580 of IPIN-SO2 (10 μM) upon the addition of 10 equiv. SO32− in the presence of 100 μM background ions in PBS (pH = 7.4) buffer solution. | ||
Kinetic study
In Fig. 5, the time course of fluorescence response of IPIN-SO2 aqueous solution with SO32− is shown. The fluorescence intensity ratio (I475/I580) reached the maximum value in 3 min when 10 equiv. SO32− was added and the fluorescence ratio of IPIN-SO2 almost remained unchanged with time, which indicates that IPIN-SO2 can be used as a fast response SO32− probe.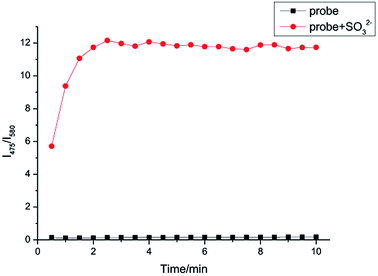 | ||
| Fig. 5 Time dependent increase of IPIN-SO2 (10 μM) fluorescence intensities after addition of 10 equiv. SO32− in PBS (pH = 7.4) solution (λex = 380 nm). | ||
Effect of pH
As shown in Fig. 6, in order to detect SO32− efficiently and selectively, the effect of different acid concentrations on IPIN-SO2 was studied to find the suitable pH range. In PBS buffer solution, the fluorescence titration curves of IPIN-SO2 and IPIN-SO2 have no obvious change between pH 5.0 and 10.0 of fluorescence intensity ratio (I475/I580), indicating that the sensor IPIN-SO2 and the sensor IPIN-SO2 existing in SO32− are stable within this pH range.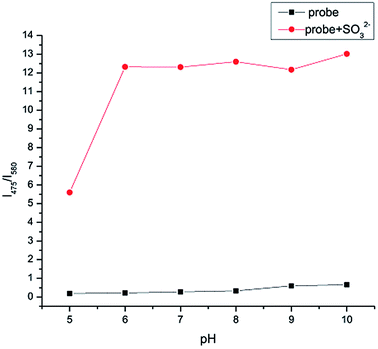 | ||
| Fig. 6 Ratio of fluorescent intensities at 475 nm and 580 nm for IPIN-SO2 (10 μM) in the presence of SO32− (10 equiv.) at varied pH values (λex = 380 nm). | ||
Mechanism
As shown in Scheme 2, once the IPIN-SO2 energy donor is excited, FRET will enter the hemicyanine group from the imidazole[1,5-a]pyridine fluorescent group, which may weaken or even quench the fluorescence of the imidazole[1,5-a]pyridine fluorescent group. Interruption of the p–π conjugation in the hemicyanine fluorophore results in increasing the energy of its first singlet level above that of the donor group. In addition, both the probe IPIN-SO2 and the donor can be activated at 380 nm, but the receptor cannot, which further confirms the FRET process in probe IPIN-SO2.To further clarify the proposed mechanism, HRMS of the reaction product was conducted. A clear mass (m/z 676.2735) of adduct appeared after the probe reacted with SO32− (Fig. S8†).
Cell imaging
As probe IPIN-SO2 shows excellent optical response to SO32− in vitro, cell imaging of IPIN-SO2 has been further studied in glioma cells. IPIN-SO2 fluorescence is stable in living cell (Fig. S3†) and cytotoxicity is negligible at 1–16 μM concentration (Fig. S4†). Because cationic cyanine dyes may accumulate in mitochondria,54,55 colocalization assays were performed with MitoTracker@ Deep Red FM and IPIN-SO2 (Fig. 7). The fluorescence of IPIN-SO2 and MitoTracker@ Deep Red FM has a significant overlap, and the overlap coefficient is 0.948 (Fig. 7d), indicating that IPIN-SO2 was well distributed in mitochondria.Then the probe IPIN-SO2 was applied to SO32− imaging in living glioma cells. When the glioma cells were incubated with probe IPIN-SO2 for 1 hour, the red channel showed strong fluorescence and blue channel weak fluorescence (Fig. S5†). When incubated for 0.5 hour with different concentrations of Na2SO3, the cells showed enhanced fluorescence of red channel and decreased fluorescence of blue channel.
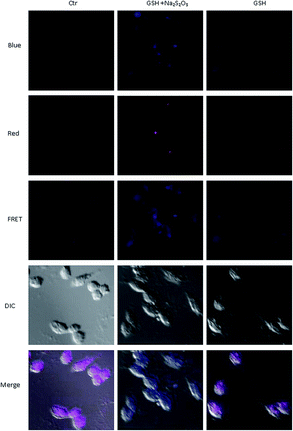
Furthermore, we studied whether the probes could be used to detect exogenous bisulfite in cells. Glioma cells were incubated with probe IPIN-SO2 for 1 hour, washed with PBS solution three times, incubated with 0.5 mM GSH (glutathione) and 0.25 mM Na2S2O3 for 0.5 hour, and then photographed with fluorescence inverted microscope to observe obvious fluorescence changes in glioma cells (Fig. 8). On the contrary, no significant fluorescence changes were observed when the glioma cells incubated with IPIN-SO2 were incubated only with GSH or Na2S2O3. These results indicate that the probe can detect exogenous bisulfite in glioma cells.
Conclusions
In summary, a novel FRET-based ratio fluorescence probe of imidazole[1,5-a]pyridine substituted hemicyanines has been developed. IPIN-SO2 has unique selectivity and high sensitivity (detection limit 0.13 μM) for SO32−, which can detect SO32− rapidly (3 min) over a wide pH range of 5 to 10. It is noteworthy that the new ratio fluorescence probe avoids automatic fluorescence, severe self-quenching and fluorescence detection errors. More importantly, the probe has been successfully applied to the identification of exogenous SO2 in mitochondria in cells.Conflicts of interest
There are no conflicts to declare.Acknowledgements
This work was supported by the Science Fund of Shandong Province for Excellent Young Scholars (ZR2017JL015), the Natural Science Foundation of China (21602153) and the Natural Science Foundation of Shandong Province (ZR2018LB014).Notes and references
- S. X. Du, H. F. Jin, D. F. Bu, X. Zhao, B. Geng, C. S. Tang and J. B. Du, Acta Pharmacol. Sin., 2010, 29, 923–930 CrossRef PubMed.
- Y. F. Liang, D. Liu, T. Ochs, C. S. Tang, S. Chen, S. Q. Zhang, B. Geng, H. F. Jin and J. B. Du, Lab. Invest., 2011, 91, 12–23 CrossRef CAS PubMed.
- Z. Xu and L. Xu, Chem. Commun., 2016, 47, 1094–1119 RSC.
- X. G. Yang, Y. B. Zhou, X. F. Zhang, S. Yang, Y. Chen, J. R. Guo, X. X. Li, Z. H. Qing and R. H. Yang, Chem. Commun., 2016, 52, 10289–10292 RSC.
- D. P. Li, Z. Y. Wang, X. J. Cao, J. Cui, X. Wang, H. Z. Cui, J. Y. Miao and B. X. Zhao, Chem. Commun., 2016, 52, 2760–2763 RSC.
- W. J. Zhang, T. Liu, F. J. Huo, P. Ning, X. M. Meng and C. X. Yin, Anal. Chem., 2017, 89, 8079–8083 CrossRef CAS PubMed.
- G. J. Mohr, Chem. Commun., 2002, 2646–2647 RSC.
- A. Isaac, A. J. Wain, R. G. Compton, C. Livingstone and J. Davis, Analyst, 2005, 130, 1343–1344 RSC.
- L. H. Yu, J. M. Kim and R. D. Schemid, Anal. Chim. Acta, 1992, 26, 317–323 Search PubMed.
- S. S. Hassan, M. S. Hamza and A. H. Mohamed, Anal. Chim. Acta, 2006, 570, 232–239 CrossRef CAS PubMed.
- M. G. Choi, J. Hwang, S. Eor and S. K. Chang, Org. Lett., 2010, 12, 5624–5627 CrossRef CAS PubMed.
- J. Yang, K. Li, J. T. Hou, L. L. Li, C. Y. Lu, Y. M. Xie, X. Wang and X. Q. Yu, ACS Sens., 2016, 1, 166–172 CrossRef CAS.
- J. C. Xu, J. Pan, X. M. Jiang, C. Q. Qin, L. T. Zeng, H. Zhang and J. F. Zhang, Biosens. Bioelectron., 2016, 77, 725–732 CrossRef CAS PubMed.
- W. Xu, L. T. Chai, J. Peng, D. Su, L. Yuan and Y. T. Chang, Biomaterials, 2015, 56, 1–9 CrossRef CAS PubMed.
- Y. Liu, K. Li, K. X. Xie, L. L. Li, K. K. Yu, X. Wang and X. Q. Yu, Chem. Commun., 2016, 52, 3430–3433 RSC.
- D. P. Li, X. J. Han, Z. Q. Yan, Y. Cui, J. Y. Miao and B. X. Zhao, Dyes Pigm., 2018, 151, 95–101 CrossRef CAS.
- K. Q. Xiang, S. Z. Chang, J. J. Feng, C. J. Li, W. Ming, Z. Y. Liu, Y. C. Liu, B. Z. Tian and J. L. Zhang, Dyes Pigm., 2016, 134, 190–197 CrossRef CAS.
- H. D. Li, Q. C. Yao, J. L. Fan, C. Hu, F. Xu, J. J. Du, J. Y. Wang and X. J. Peng, Ind. Eng. Chem. Res., 2016, 55, 1477–1483 CrossRef CAS.
- Y. Z. Zhu, W. Du, M. Z. Zhang, Y. Xu, L. L. Song, Q. Zhang, X. H. Tian, H. P. Zhou, J. Y. Wu and Y. P. Tian, J. Mater. Chem. B, 2017, 5, 3862–3869 RSC.
- Y. Liu, K. Li, M. Y. Wu, Y. H. Liu, Y. M. Xie and X. Q. Yu, Chem. Commun., 2015, 51, 10236–10239 RSC.
- Y. F. Wang, Q. T. Meng, R. Zhang, H. Jia, X. H. Zhang and Z. Q. Zhang, Org. Biomol. Chem., 2017, 15, 2734–2739 RSC.
- J. Xu, D. J. Zheng, M. M. Su, Y. C. Chen, Q. C. Jiao, Y. S. Yang and H. L. Zhu, Org. Biomol. Chem., 2018, 16, 6940–6946 CAS.
- G. Wang, H. Chen, X. L. Chen and Y. M. Xie, RSC Adv., 2016, 6, 18662–18666 RSC.
- Z. Chen, F. Z. Chen, Y. C. Sun, H. Liu, H. P. He, X. H. Zhang and S. F. Wang, RSC Adv., 2017, 7, 2573–2577 RSC.
- J. Yang, K. Li, J. T. Hou, C. Y. Lu, L. L. Li, K. K. Yu and X. Q. Yu, Sci. China: Chem., 2017, 60, 793–798 CrossRef CAS.
- W. L. Wu, H. L. Ma, M. F. Huang, J. Y. Miao and B. X. Zhao, Sens. Actuators, B, 2017, 241, 239–244 CrossRef CAS.
- L. J. Tang, P. He, X. M. Yan, J. Z. Sun, K. L. Zhong, S. H. Hou and Y. J. Bian, Sens. Actuators, B, 2017, 247, 421–427 CrossRef CAS.
- Q. Sun, W. B. Zhang and J. H. Qian, Talanta, 2017, 162, 107–113 CrossRef CAS PubMed.
- H. Huang, W. Liu, X. J. Liu, Y. Q. Kuang and J. H. Jiang, Talanta, 2017, 168, 203–209 CrossRef CAS PubMed.
- L. Yuan, W. Lin, K. Zheng and S. Zhu, Acc. Chem. Res., 2013, 46, 1462–1473 CrossRef CAS PubMed.
- M. H. Lee, J. S. Kim and J. L. Sessler, Chem. Soc. Rev., 2015, 44, 4185–4191 RSC.
- H. Zhu, J. L. Fan, B. H. Wang and X. J. Peng, Chem. Soc. Rev., 2015, 44, 4337–4366 RSC.
- F. Chen, A. Liu, R. Ji, Z. Xu, J. Dong and Y. Ge, Dyes Pigm., 2019, 165, 212–216 CrossRef CAS.
- D. Zhang, A. Liu, R. Ji, J. Dong and Y. Ge, Anal. Chim. Acta, 2019, 1055, 133–139 CrossRef CAS PubMed.
- G. Zhang, R. Ji, X. Kong, F. Ning, A. Liu, J. Cui and Y. Ge, RSC Adv., 2019, 9, 1147–1150 RSC.
- G. Song, A. Liu, H. Jiang, R. Ji, J. Dong and Y. Ge, Anal. Chim. Acta, 2019, 1053, 148–154 CrossRef CAS PubMed.
- Y. Q. Ge, B. Q. Hao, G. Y. Duan and J. W. Wang, J. Lumin., 2011, 131, 1070–1076 CrossRef CAS.
- Y. Q. Ge, T. Wang, G. Y. Duan, L. H. Dong, X. Q. Cao and J. W. Wang, J. Fluoresc., 2012, 22, 1531–1538 CrossRef CAS PubMed.
- Y. Q. Ge, J. Jia, T. Wang, H. W. Sun, G. Y. Duan and J. W. Wang, Spectrochim. Acta, Part A, 2014, 123, 336–341 CrossRef CAS PubMed.
- Y. Q. Ge, R. X. Ji, S. L. Shen, X. Q. Cao and F. Y. Li, Sens. Actuators, B, 2017, 245, 875–881 CrossRef CAS.
- Y. Q. Ge, X. J. Xing, A. K. Liu, R. X. Ji, S. L. Shen and X. Q. Cao, Dyes Pigm., 2017, 146, 136–142 CrossRef CAS.
- Y. Q. Ge, J. Jia, H. Yang, X. T. Tao and J. W. Wang, Dyes Pigm., 2011, 88, 344–349 CrossRef CAS.
- Y. Q. Ge, A. K. Liu, R. X. Ji, S. L. Shen and X. Q. Cao, Sens. Actuators, B, 2017, 251, 410–415 CrossRef CAS.
- R. X. Ji, A. K. Liu, S. L. Shen, X. Q. Cao, F. Li and Y. Q. Ge, RSC Adv., 2017, 7, 40829–40833 RSC.
- A. K. Liu, R. X. Ji, S. L. Shen, X. Q. Cao and Y. Q. Ge, New J. Chem., 2017, 41, 10096–10100 RSC.
- R. X. Ji, K. Qin, Y. Zhu and Y. Q. Ge, Tetrahedron Lett., 2018, 59, 2372–2375 CrossRef CAS.
- P. L. Yan, G. Y. Duan, R. X. Ji and Y. Q. Ge, Tetrahedron Lett., 2018, 59, 2426–2429 CrossRef CAS.
- C. Wang, D. Zhang, X. Huang, P. Ding, Z. Wang, Y. Zhao and Y. Ye, Sens. Actuators, B, 2014, 198, 33–40 CrossRef CAS.
- Y. Q. Ge, P. Wei, T. Wang, X. Q. Cao, D. D. Zhang and F. Y. Li, Sens. Actuators, B, 2018, 254, 314–320 CrossRef CAS.
- Y. Q. Ge, A. K. Liu, J. Dong, G. Y. Duan, X. Q. Cao and F. Y. Li, Sens. Actuators, B, 2017, 247, 46–52 CrossRef CAS.
- P. Zhang, H. Y. Lv, G. Y. Duan, J. Dong and Y. Q. Ge, RSC Adv., 2018, 8, 30732–30735 RSC.
- Y. Q. Ge, X. L. Zheng, R. X. Ji, S. L. Shen and X. Q. Cao, Anal. Chim. Acta, 2017, 965, 103–110 CrossRef CAS PubMed.
- X. L. Zheng, R. X. Ji, X. Q. Cao and Y. Q. Ge, Anal. Chim. Acta, 2017, 978, 48–54 CrossRef CAS PubMed.
- Y. Chen, C. Zhu, Z. Yang, J. Chen, Y. He, Y. Jiao, W. He, L. Qiu, J. Cen and Z. Guo, Angew. Chem., Int. Ed., 2013, 52, 1688–1691 CrossRef CAS PubMed.
- W. Xu, Z. Zeng, J. H. Jiang, Y. T. Chang and L. Yuan, Angew. Chem., Int. Ed., 2016, 55, 13658–13699 CrossRef CAS PubMed.
Footnote |
| † Electronic supplementary information (ESI) available: 1H NMR, 13C NMR and MS spectra of probe, and additional cell images. See DOI: 10.1039/c8ra10328c |
| This journal is © The Royal Society of Chemistry 2019 |

