 Open Access Article
Binder-free SnO2–TiO2 composite anode with high durability for lithium-ion batteries†
Hyeonseok Yoo a,
Gibaek Lee
 *b and
Jinsub Choi
 *a
*a
aDepartment of Chemistry and Chemical Engineering, Inha University, 22212 Incheon, Republic of Korea. E-mail: jinsub@inha.ac.kr
bChemical Engineering for Energy, School of Chemical Engineering, Yeungnam University, 38541 Gyeongsan, Republic of Korea. E-mail: gibaek@ynu.ac.kr
First published on 25th February 2019
Abstract
A SnO2–TiO2 electrode was prepared via anodization and subsequent anodic potential shock for a binder-free anode for lithium-ion battery applications. Perpendicularly oriented TiO2 microcones are formed by anodization; SnO2, originating in a Na2SnO3 precursor, is then deposited in the valleys between the microcones and in their hollow cores by anodic potential shock. This sequence is confirmed by SEM and TEM analyses and EDS element mapping. The SnO2–TiO2 binder-free anode is evaluated for its C-rate performance and long-term cyclability in a half-cell measurement apparatus. The SnO2–TiO2 anode exhibits a higher specific capacity than the one with pristine TiO2 microcones and shows excellent capacity recovery during the rate capability test. The SnO2–TiO2 microcone structure shows no deterioration caused by the breakdown of electrode materials over 300 cycles. The charge/discharge capacity is at least double that of the TiO2 microcone material in a long-term cycling evaluation.
Introduction
Technical demands for electrochemical energy storage systems such as lithium-ion rechargeable batteries (LIBs), fuel cells, and redox flow batteries have increased in parallel with the demands for clean and sustainable energy generation.1–3 In recent years, materials and processes used for LIBs have dramatically advanced, to meet the requirements of mobile applications and electric vehicles.3–5 However, various issues still need to be addressed for these uses; for example, the stability of anode materials when used at fast charging rates.6–9 In particular, graphite is still widely used in LIB anodes for economic reasons, despite having a relatively low theoretical specific capacity of 330 mA h g−1.8,9 Furthermore, lithium dendrites form on the surface of carbonaceous materials during rapid charging owing to low Li-ion diffusivity; these can lead to LIB fires or explosions.9TiO2-based anode materials, which show a theoretical electromotive force of about 1.7 V (vs. Li/Li+), are being intensively investigated as alternatives. Because of its very low volume expansion ratio (below 3%), TiO2 is termed “zero-strain” and is one of the most stable anode materials.10–14 However, its theoretical specific capacity is relatively low: for LixTiO2, it is 335 mA h g−1 for x = 1.0 (although x is usually 0.5 in applications).10–12 As a result, foreign elements with a high theoretical specific capacity are usually co-synthesized with TiO2.15 Furthermore, because of the low electrical conductivity of TiO2, it is essential to improve the physical properties of TiO2 batteries with a conducting material such as CuO, Co3O4, NiO, MoO3, Fe2O3, or SnO2.8,9,16–21
Although SnO2 has a lower theoretical capacity than the better-known SiO2 (780 mA h g−1, compared to 980 mA h g−1), its volume expansion ratio is also lower (∼150%, compared to ∼260%).22–31 However, since the volume change of SnO2 is still large, it is necessary to suppress the volume change-induced degradation by combining with zero-strain materials such as TiO2. Jean et al. fabricated high performance anodes for LIBs based on TiO2@SnO2@TiO2 triple-shell nanotubes prepared by a hydrothermal growth method.29 In addition, Wu et al. reported that in electrospun nanowires of SnO2 mixed with TiO2, the TiO2 successfully reduced the degradation resulting from SnO2 deformation.30 However, a further improvement of electrical conductivity was still needed because of the increased resistance in an electrode containing a binder.
TiO2 structures prepared by anodization allow the formation of a binder-free anode, providing highly active reaction sites for Li ions as a result of its nano- and micro-sized pores.32–34 In particular, TiO2 microcones, which have only been developed in recent years, are a quite promising material for anodes, having a conical shape as well as an internal hollow space on the micro scale.34,35 In this study, binder-free SnO2–TiO2 microcones were prepared for use as an LIB anode material. The hollow-containing TiO2 microcones were prepared by anodization, and subsequently, SnO2 was decorated into the hollow spaces by an anodic potential shock.36–39 The potential shock method is an economical and highly reproducible metal oxide decoration method on anodic TiO2 structures.
Results and discussion
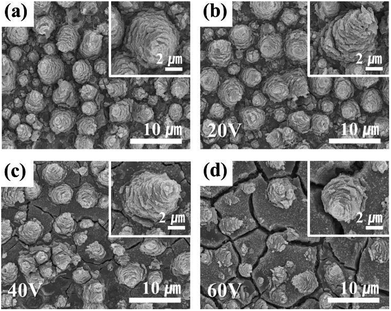
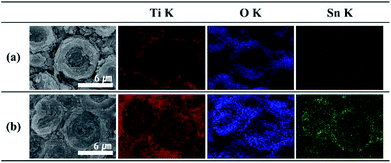
Representative FE-SEM images of the binder-free anode are presented in Fig. 1. As reported previously,34 samples with typical TiO2 conical structures (MCs) are prepared by anodization at 60 V for 60 min (Fig. 1a). TiO2 MCs exhibit a highly ordered distribution on the Ti substrate, composed of nanofragments with vacant spaces in the individual layers; the MCs increase the active surface area. Fig. 1b–d shows SnO2–TiO2 MCs for different potentials used as the anodic shock. Visually, a newly grown layer appears in the valleys between the TiO2 MCs for potentials of 40 V and higher (Fig. S1†). Eventually, most of the TiO2 MCs are covered with a newly deposited layer, including the cracks and surface boundary layers. When a shock voltage of 60 V or more is applied, the tin oxide layer may become unstable; Fig. 1d shows a severe crack on the surface. This is expected to be degraded during cycles. Nevertheless, most of TiO2 MCs retain their original structures without detachment from the Ti substrate or destruction during the voltage shock procedure.The main composition of these layers is revealed as tin oxides by EDS element mapping (Fig. S2†). Typically, the TiO2 MCs show a hollow structure inside, which is clearly indicated by the EDS element mapping, and is in good agreement with a previous report.34 The O element mapping for the truncated TiO2 MC represents the vacant space in the center of the structure. Furthermore, the lack of a titanium filling is confirmed by the Ti map (Fig. 2a). In the case of the Sn40-MC specimen, an O element distribution is observed similar to that for the pristine TiO2 MC (Fig. S2†). When the microcones of the Sn40-MCs electrode are completely removed, the entire EDS maps of Ti and O show identical aspects on the surface of the electrode (Fig. 2b). Furthermore, Sn is detected in all surface areas, with a distribution covering the microcones inside and outside. A possible reason for this is the fact that potential shock is normally carried out immediately after the anodization that creates the TiO2 MCs, without a process sequence including specimen exchange. Therefore, titanium will be anodized additionally during the application of the potential shock. These phenomena have been already reported in potential shock experiments on nanotubes.38,39,41 As a result, additional anodization of titanium inside the microcones, and tin oxide deposition, may occur simultaneously. This indicates that tin oxide in the core of the microcones is encapsulated by the shell of the MCs. We expect that the decrease in electrochemical performance caused by the volume expansion of tin oxide would be suppressed by the counteracting TiO2 MC shell. The average weight of electrode materials was measured in terms of the shock voltage and is reflected in the cycle measurements (Fig. S3†): the TiO2 MC electrodes originally had an average weight of 0.42 mg; after the potential shock, the tin oxide deposited showed a weight linearly increasing with the applied shock voltage.
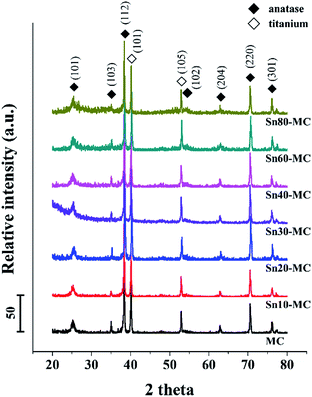
It has been reported that TiO2 MCs have a polycrystalline anatase phase, and it can be used for applications without any further heat treatment; post-annealing usually leads to a decrease in the cycle performance of TiO2 MCs.34,40 The polycrystalline TiO2 anatase on titanium metal is formed without an annealing step, regardless of the applied shock voltage, as demonstrated in the XRD analysis (Fig. 3). The peaks at 25.308°, 38.572°, 62.692°, and 70.303° correspond to (101), (112), (204), and (202), respectively (JCPDS PDF#01-071-1166). In the XRD patterns, there are no detectable peaks of tin composites; this strongly indicates that tin composites generated through potential shock might be amorphous (see the FE-TEM observations and XPS analysis below).
In the FE-TEM images, granular-like substances are deposited on the surface layers of microcone fragments (Fig. 4a). In more detail, the amorphous structure deposited on the polycrystalline surface (light blue) is well observed in the higher magnification image (Fig. 4b). The crystal planes are identified as TiO2 anatase, which are identified by 3.51 Å of reciprocal distance. The crystallographic information analyzed by selected area electron diffraction patterns also shows only TiO2 anatase (Fig. 4c), indicating that the tin oxide deposited on the TiO2 surface has an amorphous structure. The morphological structure of a single-layered nanofragment of tin oxide deposited on the TiO2 MCs was characterized using an energy-dispersive spectroscopy (EDS) analyzer. Fig. 4d displays the amount of Ti, Sn, and O elements, which are the major components in the electrode. EDS mapping indicates that Ti, Sn, and O are distributed evenly among individual microcones.
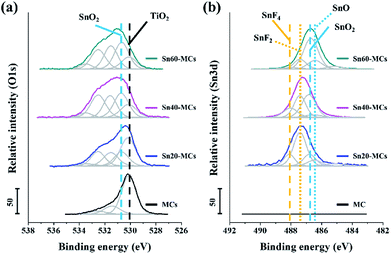
To confirm the surface chemical states of tin oxide in electrode, XPS analysis was performed, as shown in Fig. 5. In the O 1s spectra, it was found that the intensity of SnO2 at 530.6 eV increases as a function of applied shock voltage, and the amount of SnO2 on the surface was larger than that of TiO2 at 530.1 eV for a voltage shock above 40 V (Fig. 5a).40,42 The peaks located at 531.7 and 532.5 eV could be ascribed to oxygen vacancies and adsorbed Ox− species, respectively.43 SnO is an oxide of tin that could be formed during the potential shock process; however, the O 1s binding energy in SnO is situated in a similar energy region to that in TiO2, and it is therefore difficult to distinguish possible SnO peaks from those of TiO2.42 The Sn 3d spectrum provides useful information for identifying the formation of SnO (Fig. 5b); the peaks detected at 486.3 and 486.7 eV are at the relevant binding energies for SnO (Sn 3d7/2, Sn2+ for SnO) and SnO2 (Sn 3d7/2, Sn4+ for SnO2), respectively. This result agrees with previous analysis of the O 1s spectra.42,44 Interestingly, tin fluoride components such as SnF4 (488.1 eV of Sn 3d7/2) and SnF2 (487.4 eV of Sn 3d7/2) also exist on the surface.45,46 From the F 1s spectrum, it is seen that the tin fluoride composites clearly appear after the potential shock (Fig. S4†); these are attributed to residual F− ions, which were trapped inside the MCs. It has been reported that SnF2 can act as an anode material delivering a higher theoretical capacity (991 mA h g−1) than SnO2.47 However, the non-conductive SnF4 is known as a non-useful by-product in a Li ion battery, which may have originated from the reaction between a tin oxide-based anode and an F ion-containing electrolyte during cycling.45 In our system, the quantity of residual F− ions, which possibly leads to the formation of SnF4, is strongly determined by the concentration of HF in the anodizing electrolyte and the anodic shock voltage. Therefore, a shock of around 40 V, which generates more SnO2 and SnF2 than SnO and SnF4, was considered the optimum condition.
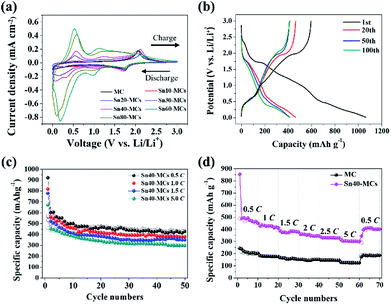
The electrochemical characteristics of TiO2 and SnO2 were analyzed via cyclic voltammograms (Fig. 6a). All redox reactions are explained by Li-ion insertion/extraction, and by Li/Sn alloying/de-alloying in the SnO2–TiO2 MC electrode. The anode reaction of TiO2 during the cycle is generally described by the following equation:34
| TiO2 + xLi+ + xe− ↔ LixTiO2 (0 ≤ x ≤ 1) | (1) |
The theoretical potential of eqn (1) is reported as around 1.75 V.16–18 Therefore, the peaks at 1.75 and 2.05 V (vs. Li/Li+) are related to the reversible lithiation/delithiation coupling in TiO2.34 For SnO2, two sequential anode reactions are assumed: the partial reversible reduction reaction of SnO2, and the sequential reversible alloying/de-alloying reaction of Sn:28
| SnO2 + 4Li+ + 4e− → Sn + 2Li2O | (2) |
| Sn + xLi+ + xe− → LixSn (0 ≤ x ≤ 4.4) | (3) |
A solid-electrolyte interface (SEI) layer was formed on all electrodes (from eqn (2)) under 1.5 V (vs. Li/Li+) of cathodic potential during the 1st cycle (Fig. S5†). From the second cycle onward, there were two remarkable redox couplings at 0.18/0.56 V and 1.02/1.21 V (vs. Li/Li+). It was confirmed that the current density for these reversible reactions was proportional to the applied shock voltage. The first redox couple of 0.18/0.56 V corresponds to the reversible alloying/de-alloying reaction of Sn in eqn (3).25–30 In addition, the second redox couple of 1.02/1.21 V is ascribed to the partial reversible reaction of SnO2 in eqn (2).28–30,48 For SnF2, it causes an irreversible reaction, providing additional electrochemical capacity according to eqn (4):
| SnF2 + 2Li+ + 2e− → Sn + 2LiF | (4) |
SnF2 is a significant tin-based compound located on the surface of the Sn20-MC electrode and was identified by the XPS and EDS element mapping. Nevertheless, the related electrochemical reaction in the potential range 0–1.0 V (vs. Li/Li+) appears small, and it is reasonable to assume that the tin fluoride content in the electrode is in fact very small. On the other hand, in Fig. S6,† the surface resistance is larger than that of pristine MCs at 10 and 20 V of applied shock voltages. The resistance begins to decrease if the shock voltage increases over 20 V, finally becoming the value lower than that of pristine MCs. It means that the non-conductive SnF4 affects the surface electron transfer rate of the electrode.
The SnO2–TiO2 MCs exhibits excellent cycling stability at a current density of 300 μA cm−2 (Fig. 6b). Charge/discharge profile which are extracted at 1st, 20th, 50th, and 100th cycles shows the plateaus of TiO2 and tin composites, meaning that all electrode components are well-connected. The initial specific capacity of all electrodes is reduced to half due to the irreversible reaction of SnO2 (eqn (2)) and the volume expansion during alloying/de-alloying (eqn (3)), as reported in previous studies.24–31 However, after the 1st cycle, the specific capacity remains constant over 100 cycles. The pristine TiO2 MC electrode exhibits an average capacity of 205.6 mA h g−1, whereas Sn30-MC, Sn40-MC, and Sn60-MC provide a markedly increasing capacity as a function of the shock voltage: 332.8, 466.5 and 481.2 mA h g−1 at the 50th cycle, respectively (Fig. S7†). Sn80-MC shows a drastically decreased capacity during cycling (366.3 mA h g−1 at 50th cycle). To optimize the cycle performance, the correlation between specific capacity and shock voltage was investigated (Fig. S8†). Even though Sn60-MC provides the highest specific capacity, its cycle retention proves unstable; this results from high stresses, seen in the surface morphology, leading to significant degradation during cycling. Therefore, the Sn40-MC electrode, which showed consistently stable cyclability, was chosen as the optimized electrode. Evaluation of the cycling stability was carried out for Sn40-MC anode at different current rates of 0.5, 1.5, 2.5, and 5.0C (Fig. 6c); the capacity decreases with increasing cycle rate. For a rate of 0.5C, the cell exhibits a capacity of 426 mA h g−1 at the 50th cycle. However, even when the C-rate is increased 10-fold (5.0C), a specific capacity of approximately 300 mA h g−1 remains after 50 cycles; this indicates that the Sn40-MC electrode could be used for fast charging in practical LIB applications. Moreover, the Sn40-MC electrode exhibits an excellent rate capability under rapid charge and discharge conditions. As shown in Fig. 6d, the electrode delivers reversible capacities of approximately 476, 420, 380, 350, 330, and 300 mA h g−1 at C-rates of 0.5, 1.0, 1.5, 2.0, 2.5, and 5.0C, respectively. The Sn40-MC electrode recovers and stabilizes at approximately 415 mA h g−1 (for 0.5C) following cycling at a high current rate (5C), suggesting that as-prepared SnO2–TiO2 electrodes could provide outstanding rate retention and cycle stability. The SEM image after the full-charging at 5C shows that the dendrite-free morphology is maintained, meaning strong structural stability (Fig. S9†). The well-established cycle retention in charge/discharge profiles are also in good agreement with other results (Fig. S10†). The seven major peaks for Sn40-MC electrode shown in the cyclic voltammogram (Fig. 6a) are matched as plateaus at identical location in charge/discharge profile during C-rate performance test for all scan rate.
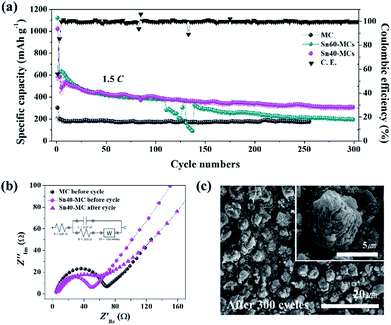
In the long-term cycle measurement (Fig. 7a), the cyclability of the Sn40-MC electrode is consistently maintained, delivering 307 mA h g−1 (212 μA h cm−2) after 300 cycles at the high current rate of 1.5C. In addition, the coulombic efficiency exhibited for most entire cycle is approximately 100%. In contrast, the Sn60-MC electrode shows an abrupt break with drastically reduced specific capacity at the 110th cycle, as predicted from the SEM morphology image (Fig. 1d). Even though the specific capacity recovers, it is not retained and exhibits a rapid fading. The optimized Sn40-MC electrode provides an excellent lifetime in a long-term fast charge/discharge environment, leading to favorable results in comparison to SnO2 and TiO2 anode materials in other studies (Table 1). In the electrochemical impedance spectroscopy measurements (Fig. 7b), the electrolyte resistance (Re) and surface film resistance (Rsf) show similar behavior, derived from Li-ion migration through the surface film. However, the charge resistance (Rct) of the SnO2–TiO2 MC anode (39.0 Ω) is smaller than that of pristine TiO2 MCs (69.1 Ω). After 300 cycles, the Rct of Sn40-MC is increased slightly due to the SEI formation, and is related to the constant phase elements (CPEsf). Nonetheless, it is not large compared with that of TiO2 MC electrode. Fig. 7c shows morphology images of Sn40-MC after 300 cycles. Most SnO2–TiO2 MC structures are successfully retained without surface cracks or damage following the high current and prolonged cycling. Furthermore, the SnO2–TiO2 MCs remain well-connected to the Ti substrate without evidence of fracture or deformation. Consequently, the SnO2–TiO2 MCs are shown to be a stable and suitable anode material for high-speed charging in Li-ion battery applications.
| Structure | Preparation method | The highest capacity | Cycle rate | Remarks |
|---|---|---|---|---|
| SnO2–TiO2 microcones | Potential shock on as-prepared TiO2 microcones | 307 mA h g−1 (212 μA h cm−2) at 300th cycle | 453 mA g−1 (300 μA cm−2 = 1.5C) | This study |
| TiO2–SnO2 nanotubes | Single-step anodization using Sn–Ti alloy | 427 μA h cm−2 at 420th cycle | 504 μA cm−2 (=1C) | Ref. 23 |
| Sn–SnO2–TiO2 nanoporous film | Hybrid electroplating method on Cu disk | 410 mA h−1g at 50th cycle | 100 mA g−1 | Ref. 24 |
| TiO2/SnO2/TiO2 nanotubes | Template-assisted atomic layer deposition (ALD) | 310 mA h g−1 at 50th cycle | C/10 | Ref. 25 |
| SnO2@TiO2 nanotubes | Electrodeposition on TiO2 | 250 μA h cm−2 at 70th cycle | 124 μA cm−2 | Ref. 26 |
| TiO2@SnO2@TiO2 triple-shell nanotube | Template-assisted plasma-enhanced atomic layer deposition (PEALD) | 550 mA h g−1 at 60th cycle | 50 mA g−1 | Ref. 29 |
| SnO2/TiO2 composite nanofibers | Electrospinning method | 320 mA h g−1 at 50th cycle | 100 mA g−1 | Ref. 30 |
Experimental
Electrode preparation
Titanium substrates (99.7% purity metal trace, 0.126 mm thickness, Sigma) were cut into 15 × 15 mm2 pieces for anodization. The substrates were washed in acetone, EtOH, and deionized water (DI) for 15, 10, and 5 min, respectively. The completely washed substrates were dried in ambient nitrogen. The cleaned titanium substrate and a platinum mesh were used as the working and counter electrodes, respectively, in a laboratory-made electrochemical cell. The anodization was carried out at 60 V for 60 min using a DC source (Keithley 2400 SourceMeter) in an electrolyte containing 1 M H3PO4 (85 wt% purity, Sigma) with 0.4 vol% of HF (48 wt%, Sigma), forming TiO2 microcones (MCs).34,40 After anodization, the titanium substrate was washed with DI. Subsequently, 0.4 mM Na2SnO3·H2O (Alfa Aesar) was used as electrolyte for SnO2 decoration on the as-prepared MCs by an anodic potential shock; the potential shock was carried out without altering the working and counter electrode configuration. Various shock voltages from 10 to 80 V were applied for 10 s. The completed electrodes were dried overnight in an oven maintained at 60 °C and used directly without annealing. The SnO2–TiO2 MCs specimens are denoted SnXX-MCs, where XX indicates the shock voltage; Sn10-MCs, for instance, means tin oxides were deposited using a shock of 10 V. MCs alone denotes samples that have been anodized but not shocked. The average weight of anode material is measured via thermoset epoxy, which can detach the anodic porous structure from titanium substrate.34 By weighting the difference of specimen before and after detachment, the exact weight for active materials can be measured. All measurements are repeated 5 times to calculated average weight of all conditions.Characterization
The morphological features of SnO2–TiO2 MCs were observed via high-resolution scanning electron microscopy (HR-SEM, SU8010, Hitachi) and field-emission transmission electron microscopy (FE-TEM, JEM-2100F, JEOL). The crystallographic nature of the electrodes was determined by X-ray diffraction (XRD, Rigaku D/max-RB, Cu K-alpha radiation), with detailed analysis using selected area electron diffraction (SAED) patterns from the FE-TEM. The spatial distribution of electrode elements was determined by in situ energy dispersive X-ray spectroscopy (EDS) mapping analysis. X-ray photoelectron spectroscopy (XPS, VGESCLALB 220i-XL, Fisons) with an Al K-alpha source was adapted to clarify the oxidation state of Sn situated on the surface and in the pore structure.Electrochemical measurements
The electrochemical properties of the SnO2/TiO2 MC electrodes were investigated in coin-type cells (CR2032, Wellcos Corporation); the anodized substrates were cut into 10 mm diameter discs for the working electrodes. The coin-type cells were fabricated in Ar-purged glove boxes to avoid unintended oxidation of the lithium metal foil (0.38 mm thickness, Sigma) that was used as the combined counter and reference electrode. The electrolyte was a 1 M LiPF6 solution in a 1![[thin space (1/6-em)]](https://www.rsc.org/images/entities/char_2009.gif) :
:![[thin space (1/6-em)]](https://www.rsc.org/images/entities/char_2009.gif) 1 ethylene carbonate (EC)
1 ethylene carbonate (EC)![[thin space (1/6-em)]](https://www.rsc.org/images/entities/char_2009.gif) :
:![[thin space (1/6-em)]](https://www.rsc.org/images/entities/char_2009.gif) diethyl carbonate (DEC) (Sigma) mixture containing 5 vol% of fluoroethylene carbonate (FEC). Cyclic voltammetry (CV) and electrochemical impedance spectroscopy (EIS) were carried out via a potentiostat technique (PGSTAT302N, Autolab). The CV was cycled at 0.2 mV s−1 for 5 times in the potential range of 0.01–3.0 V (vs. Li/Li+). For the EIS measurement, the frequency region 0.1–105 Hz was used, with 10 mV amplitude. The galvanostatic cycling test was conducted in an identical potential range as the CV traces using a cycler system (WBCS3000, WonATech).
diethyl carbonate (DEC) (Sigma) mixture containing 5 vol% of fluoroethylene carbonate (FEC). Cyclic voltammetry (CV) and electrochemical impedance spectroscopy (EIS) were carried out via a potentiostat technique (PGSTAT302N, Autolab). The CV was cycled at 0.2 mV s−1 for 5 times in the potential range of 0.01–3.0 V (vs. Li/Li+). For the EIS measurement, the frequency region 0.1–105 Hz was used, with 10 mV amplitude. The galvanostatic cycling test was conducted in an identical potential range as the CV traces using a cycler system (WBCS3000, WonATech).
Conclusions
In this study, a novel binder-free LIB anode using SnO2–TiO2 MCs for high capacity has been successfully prepared via the facile and economical processes of anodization and potential shock. Following anodization that creates the TiO2 microcones, SnO2 is deposited by potential shock in the valleys between the MCs as well as inside the hollow MCs. The shock plays a crucial role in the formation of the optimum structure and morphology of the SnO2–TiO2 MCs. In the charging/discharging cycle, the as-prepared SnO2–TiO2 MCs may suppress the structural deformation induced by volume expansion during lithiation; this results from the hollow MCs encapsulating the SnO2 layer. This achieves high cycle stability over extended high current cycling. There are still several challenges to further performance enhancement: removal of residual F− ions in TiO2 structures, and severe SEI layer formation from side reactions between TiO2 and the electrolyte at a low discharge potential. We have nevertheless demonstrated that SnO2–TiO2 MC material is a very promising candidate for LIB anodes.Conflicts of interest
There are no conflicts to declare.Acknowledgements
This work was supported by Inha University Research Grant.Notes and references
- R. T. Doucette and M. D. McCulloch, J. Power Sources, 2011, 196, 1163 CrossRef CAS.
- V. F. Pires, E. Romero-Cadaval, D. Vinikov, I. Roasto and J. F. Martins, Energy Convers. Manage., 2014, 86, 453 CrossRef.
- M. Agostini, S. Brutti, M. A. Navarra, S. Pnero, P. Reale, A. Matic and B. Scrosati, Sci. Rep., 2017, 7, 1104 CrossRef CAS PubMed.
- I. H. Son, J. H. Park, S. Park, K. Park, S. Han, J. Shin, S.-G. Doo, Y. Hwang, H. Chang and J. W. Choi, Nat. Commun., 2017, 8, 1561 CrossRef PubMed.
- S. Wang, W. Quan, Z. Zhu, Y. Yang, Q. Liu, Y. Ren, X. Zhang, R. Xu, Y. Hong, Z. Zhang, K. Amine, Z. Tang, J. Lu and J. Li, Nat. Commun., 2017, 8, 627 CrossRef PubMed.
- N. Kim, S. Chae, J. Ma, M. Ko and J. Cho, Nat. Commun., 2017, 8, 812 CrossRef PubMed.
- N. Takami, A. Satoh, M. Hara and T. Ohsaki, J. Electrochem. Soc., 1995, 142, 371 CrossRef CAS.
- S. Goriparti, E. Miele, F. D. Angelis, E. D. Fabrizio, R. P. Zaccaria and C. Capiglia, J. Power Sources, 2014, 257, 421 CrossRef CAS.
- N. Nitta, F. Wu, J. T. Lee and G. Yushin, Mater. Today, 2015, 18, 252 CrossRef CAS.
- B. G. Lee, S.-C. Nam and J. Choi, Curr. Appl. Phys., 2012, 12, 1580 CrossRef.
- M. Wagemaker and F. M. Mulder, Acc. Chem. Res., 2013, 46, 1206 CrossRef CAS PubMed.
- Z. Chen, I. Belharouak, Y. K. Sun and K. Amine, Adv. Funct. Mater., 2013, 23, 959 CrossRef CAS.
- Z. Hong and M. Wei, J. Mater. Chem. A, 2013, 1, 4403 RSC.
- E. C. Self, R. Wycisk and P. N. Pintauro, J. Power Sources, 2015, 282, 187 CrossRef CAS.
- G. Lee, S. Kim, S. Kim and J. Choi, Adv. Funct. Mater., 2017, 27, 1703538 CrossRef.
- G. Wang, Y. Siu, M. Zhang, M. Xu, Q. Zeng, C. Liu, X. Liu, F. Du and B. Zou, J. Mater. Chem. A, 2017, 5, 18577 RSC.
- W. Xu, X. Cui, Z. Xie, G. Dietrich and Y. Wang, Electrochim. Acta, 2016, 222, 1021 CrossRef CAS.
- W. Shi, H. Zhao and B. Lu, Nanotechnology, 2017, 28, 165403 CrossRef PubMed.
- Y. Zhong, Y. Ma, Q. Guo, J. Liu, Y. Wang, M. Yang and H. Xia, Sci. Rep., 2017, 7, 40927 CrossRef CAS PubMed.
- D. Guan, J. Li, X. Gao and C. Yuan, RSC Adv., 2014, 4, 4055 RSC.
- C. Wang, L. Wu, H. Wang, W. Zuo, Y. Li and J. Liu, Adv. Funct. Mater., 2015, 25, 3524 CrossRef CAS.
- Y. Wang, W. Zhou, L. Zhang, G. Song and S. Cheng, RSC Adv., 2015, 5, 63012 RSC.
- M. Madian, M. Close, A. Jaumann, A. Bevert, S. Oswald, N. Ismail, A. Eychmüller, J. Ecert and L. Giebeler, J. Mater. Chem. A, 2016, 4, 5542 RSC.
- S.-Z. Kure-Chu, A. Satoh, S. Miura, M. Mizuhashi and H. Yashiro, J. Electrochem. Soc., 2015, 162, D305 CrossRef CAS.
- M. Kim, J. Lee, S. Lee, S. Seo, C. Bae and H. Shin, ChemSusChem, 2015, 8, 2363 CrossRef CAS PubMed.
- X. Wu, S. Zhang, L. Wang, Z. Du, H. Fang, Y. Ling and Z. Huang, J. Mater. Chem., 2012, 22, 11151 RSC.
- X. Hou, X. Wang, B. Liu, Q. Wang, Z. Wang, D. Chen and G. Shen, ChemElectroChem, 2014, 1, 108 CrossRef.
- S.-Y. Lee, K.-Y. Park, W. S. Kim, S. Yoon, S.-H. Hong, K. Kang and M. Kim, Nano Energy, 2016, 19, 234 CrossRef CAS.
- J.-H. Jean, H. Kwak, W.-S. Kim, H.-C. Kim, K.-Y. Park, H. Kim, H.-S. Yang, W.-R. Yu, K. Kang and S.-H. Hong, J. Solid State Electrochem., 2017, 21, 2365 CrossRef CAS.
- T. Tran, K. McCormc, J. Li, Z. Bi and J. Wu, Electrochim. Acta, 2014, 117, 68 CrossRef CAS.
- Y. Jiang, S. Chen, D. Mu, Z. Zhao, C. Li, Z. Ding, C. Xie and F. Wu, ChemSusChem, 2018, 11, 2040 CrossRef CAS PubMed.
- D. Liu, P. Xiao, Y. Zhang, B. B. Garcia, Q. Zhang, Q. Guo, R. Champion and G. Cao, J. Phys. Chem. C, 2008, 8, 11175 CrossRef.
- Y. Wang, S. Liu, K. Huang, D. Fang and S. Zhuang, J. Solid State Electrochem., 2012, 16, 723 CrossRef CAS.
- O. Rhee, G. Lee and J. Choi, ACS Appl. Mater. Interfaces, 2016, 8, 14558 CrossRef CAS PubMed.
- J. Park, S. Kim, G. Lee and J. Choi, ACS Omega, 2018, 3, 10205–10210 CrossRef CAS.
- M. Seong, S. Kim, H. Yoo and J. Choi, Catal. Today, 2016, 260, 135 CrossRef CAS.
- H. Yoo, K. Oh, G. Lee and J. Choi, J. Electrochem. Soc., 2017, 164, H104 CrossRef CAS.
- S. Kim, H. Yoo, O. Rhee and J. Choi, J. Phys. Chem. C, 2015, 119, 21497 CrossRef CAS.
- Y. Jo, I. Jung, I. Lee, J. Choi and Y. Tak, Electrochem. Commun., 2010, 12, 616 CrossRef CAS.
- J. Park, G. Lee and J. Choi, J. Electrochem. Soc., 2017, 164, D640 CrossRef CAS.
- K. Lee and P. Schmuki, Electrochim. Acta, 2013, 100, 229 CrossRef CAS.
- J. Szuber, G. Czempik, R. Larciprete, D. Koziei and B. Adamowicz, Thin Solid Films, 2001, 391, 198 CrossRef CAS.
- W. Wan, Y. Li, X. Ren, Y. Zhao, F. Gao and H. Zhao, Nanomater, 2018, 8, 112 CrossRef PubMed.
- A. Palacious-Padrós, F. Caballero-Briones, I. Díez-Pérez and F. Sanz, Electrochim. Acta, 2013, 111, 837 CrossRef.
- S. Hong, M.-H. Choo, Y. H. Kwon, J. Y. Kim and S.-W. Song, J. Electrochem. Soc., 2014, 161, A1851 CrossRef.
- D. Shuttleworth, J. Phys. Chem., 1980, 84, 1629 CrossRef CAS.
- S. Bouazza, A. Saberi and M. Willert-Porada, Mater. Lett., 2011, 65, 1334 CrossRef CAS.
- O. Cevher and H. Akbulut, Acta Phys. Pol., A, 2017, 131, 204 CrossRef CAS.
Footnote |
| † Electronic supplementary information (ESI) available. See DOI: 10.1039/c8ra10358e |
| This journal is © The Royal Society of Chemistry 2019 |

