 Open Access Article
Tunable porous silica nanoparticles as a universal dye adsorbent
S. Irudhaya Raj a,
Adhish Jaiswal
 *a and
Imran Uddin
 b
b
aDepartment of Chemistry, Indira Gandhi National Tribal University, Amarkantak, MP, India. E-mail: adhish.jaiswal@igntu.ac.in
bInterdisciplinary Nanotechnology Centre, Z.H. College of Engineering & Technology, Aligarh Muslim University, Aligarh, India
First published on 10th April 2019
Abstract
Here, we report selective adsorption of cationic dyes methylene blue (MB) and rhodamine B (RB) and anionic dyes methyl orange (MO) and bromo cresol green (BCG) by modifying the surface of cetyl trimethyl ammonium bromide (CTAB) coated porous silica nanoparticles (PSN). We used a top down approach to synthesize PSN (porous silica nanoparticles) without high temperature calcination. X-ray diffraction study confirms the formation of pure phase silica nanoparticles. SEM analysis reveals that the particle morphology is spherical and the size range lies in-between 150–200 nm. We have studied the dye adsorption properties for three cases of PSN at varying calcination temperatures of 100 °C, 250 °C and 500 °C, respectively. Thermal study has been performed in the temperature range of 50–800 °C to check the calcination temperature. In this report, we have tuned the surface properties for selective adsorption of cationic and anionic dyes in water. In the first case, 100 °C calcined PSN selectively adsorb only anionic dyes, whereas in the second case, 500 °C calcined PSN adsorb only cationic dyes and finally, an optimized calcination temperature ≈250 °C could be used for all types of dye to be adsorbed irrespective of charges on the dyes. The mode of interaction of dyes with PSN has been explained with a proper mechanism in all three cases. The adsorptions of dyes are confirmed by UV-Vis spectroscopy. Adsorption capacity and regenerable performance of adsorbents have also been studied.
Introduction
Colors and colored products have fascinated human kind for aesthetic, social and commercial reasons. The signature of dyes is found in various fields such as textiles, leather tanning, paints, paper production, food products, laboratory research and cosmetics.1 Dyes are broadly classified as anionic, cationic and non-ionic. Due to the wide range of application in the industrial sector, the environmental pollution due to colored wastewater with organic loads released by industries is undoubtedly a major problem to the developed and developing countries. The organic and inorganic compounds present in dyes cause a high and undesirable level of dissolved solids and oxygen demand in water. Moreover, these synthetic dyes are found to be toxic, carcinogenic and mutagenic to humans and aquatic life.2There are several methods used for dye removal, namely chemical coagulation, flocculation, chemical oxidation, photochemical degradation, electrochemical incineration, adsorption, membrane filtration and biological degradation.2–5 At this juncture, choosing a water treatment method which is effective, efficient and economical is vital. Based on the above prospects usage of adsorbents is an ideal option for remediation of coloured waste water.6 Activated carbon has been used as commercial adsorbent for remediation of waste water for many decades due to its high removal efficiency and capacity. However, its cost, regeneration difficulties, use of carbon source and carbon emission associated with the production and application of activated carbon has been a challenge. Therefore, there is a need for low cost, environment friendly materials, regenerable and reusable adsorbents for remediation of industrial waste water.
The silica nanoparticles have attracted significant attention as nano adsorbent on account of their regular structural characteristics, larger surface area, tunable pore diameters, good thermal and chemical stabilities, ease of surface modification, selectivity of organic pollutants, economical regeneration and reusability.7,8 Morphology controlled nanomaterials like hollow, mesoporous and tunable nanoporous silica nanoparticles play crucial role in drug delivery application.9–11 Therefore fine-tuning of particle size, surface functionalization and porous structure is very critical for environmental and medical applications.12–15 Obviously, the final porous structure, morphology, dimension and surface property of the silica nanoparticles are highly dependent on various reaction parameters such as solvent, temperature, pH, surfactant/silica molar ratio, co-surfactant and stirring rates.8,16,17
Templating of silica nanoparticles with cationic surfactants, is very typical due to the electrostatic interaction between cationic head group of surfactants and negative surface of silica, further the silica self assembles around the template producing ordered channels.18,19 The cationic surfactant CTAB acts as dispersing and pore templating agent; however, its concentration regulates the final porous framework.7,19 The surfactant template on silica nanoparticles acts as a hydrophobic site around the silica surface, forming a mono, bi or aggregates depending on the concentration of surfactant.20–22 The real structure of CTAB templated silica surface is more complex and intriguing.23,24 The interfacial properties of the silica and surfactant layer plays a vital role in the adsorption of dyes. Bryleva et al. demonstrated the behaviour of different indicator dyes in CTAB modified silica nanoparticles and confirmed the existence of similarity between CTAB templated silica nanoparticles and common spherical surfactant micelle.21 Biggs et al. have reported that above, the critical micelle concentration (CMC) the micelle directly adsorbs on the silica surface.25 The adsorbed CTAB layer has considerable attraction and repulsion to counter ions present in the medium. Generally, the ‘as-synthesized’ silica nanoparticles retain the surfactant template within the silica network. However, if the surfactant molecules are not needed, it can be removed by calcination in air at or above 500 °C, solvent extraction or microwave digestion.7 In this context, silica nanoparticles templated with surfactant layer are removed to open the pores for dye adsorption,8,14 enzyme immobilization,14 surface functionalisation13 and drug delivery.13 It is also noteworthy that uncalcined mesoporous silica materials are used as efficient adsorbent for removal of organic pollutants from the aqueous media.7,26,27 Hence, it is of significant interest to examine the effect of surfactant template and calcination temperatures in the dye adsorption behavior of silica nanoparticles. However, the report about the structural evolution during the surfactant removal process is scarce; hence it is of significant interest to examine the role and mechanism of dye adsorption by silica nanoparticles in detail.
In our present work, porous silica nanoparticles (PSN) with tunable surface properties were synthesized by top-down approach using silica gel as precursor and CTAB as template. Further, the as-synthesized PSN were calcined at various temperatures to remove the partial and complete surfactant layer from the PSN surface. A detailed study on dye adsorption behavior by the as-synthesized PSN particles calcined at 100 °C, 500 °C and optimized ≈250 °C and their mechanistic path of interaction has been reported. The calcined products were tuned according to their specific properties and structure for the desired application. Our insight into the structural evolution and removal of surfactant layer were investigated using scanning electron microscopy (SEM) and thermo-gravimetric analysis (TGA). Furthermore, the selective dye adsorption, adsorption efficiency and regeneration and reusability of adsorbent were confirmed by a series of adsorption experiments.
Materials & methods
All of the chemicals were of an analytical grade and purchased from Merck Ltd. with more than 98% purity. The aqueous solutions were prepared with double distilled water for all of the experiments.Top down approach
In the typical synthesis, the stock silica gel solution was prepared by mixing of silica gel self-indicating coarse (1.0 g) with 70 mL of ammonia solution and heated to 80 °C, the silica gel turned blue with popping sound and became soluble. In another beaker CTAB (2 g, 0.005 moles) was mixed in water (50 mL) at room temperature with constant stirring. The prepared silica gel stock solution (30 mL) was slowly mixed with CTAB solution (50 mL), and then the reaction mixture was stirred, heated to 60 °C for 30 min and aged for 24 h. After aging, the flocculated PSNs were isolated by centrifugation and dried at room temperature for 12 h. Finally, the samples were calcined at 100 °C, 250 °C and 500 °C for the partial, optimized and complete removal of CTAB template for the desired application. Hereafter, we refer to the individual samples as PSN-100, PSN-250 and PSN-500.Results and discussion
We speculate that the possible formation mechanism of PSNs involves electrostatic ion interaction. In our typical synthesis procedure, micron size porous silica gel reacted with ammonia solution at a certain temperature leading to the formation of silica–ammonia complex.28 Further, on heating silica–ammonia complex with CTAB solution, the ammonia molecules were expelled out, thereby polar head group of CTAB were attached over the negatively charged silica surface. Therefore, electrostatic force of attraction is the operating mechanism for the formation of PSN.Phase & morphology
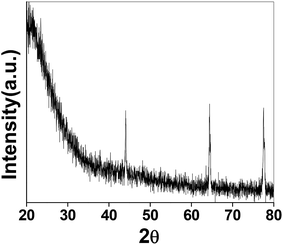
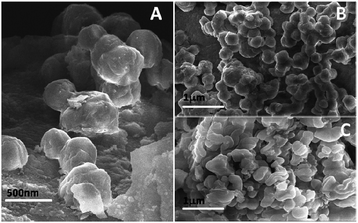
The as-synthesized PSN ware characterized by XRD techniques for the exact phases and purity of the samples as shown in Fig. 1. Powder X-ray diffraction pattern (XRD) of the as-synthesized PSN were recorded by a PANalytical X’PERT PRO instrument using an iron-filtered Cu-Kα radiation (λ = 1.5406 Å) in the 2θ range of 10–80° with a step size of 0.02°. Phase and purity was confirmed by the reference taken from JCPDS card no. 421401.Further size and morphology were characterised through SEM analysis. The SEM analysis on the samples was done using the Quanta 200 3D from FEI operating at 20 kV energy. Fig. 2A–C shows SEM images of PSN-100, PSN-250 and PSN-500 particles, respectively. A detailed SEM investigation of particle surfaces indicates that PSN-100 particles were spherical in shape, size in-between the range of 150–200 nm and well separated. After calcination treatment around 250 °C and 500 °C, spherical particles were started to fuse together to form agglomerated larger size particles. It is clear that as the calcinations temperature increases, agglomeration increases due to the removal of CTAB layer from the surface of PSN.
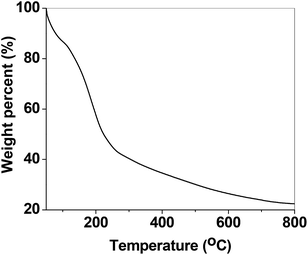
Furthermore, TGA analysis was performed by PerkinElmer Pyris TGA instrument for PSN-100 particles between the temperature range 50–800 °C. In Fig. 3, TGA study shows a small initial drop in weight from 50–100 °C. This initial drop in weight is generally credited to the release of water adsorbed on the surface. After the initial drop, a sharp decrease in weight occurs until approximately 250 °C. This sharp decrease in weight can be associated with the partial removal of CTAB structure from the surface. With increasing temperature, a gradual decrease in weight exist up to a limit of 800 °C, this can be related with the complete removal of CTAB entity from the surface.
Generally, porous materials have shown good adsorption property for the removal of dyes. Therefore, we had performed experiments of dye adsorption by using the synthesized porous materials (PSN-100, PSN-500 and PSN-250) which were monitored using UV-Vis spectrophotometer (Shimadzu, UV-1800) over a scanning range from 190–800 nm at resolution of 2 nm.
Dyes adsorption
All the adsorption experiments were carried out at room temperature. First, we have selected four sample dyes to test the selective adsorption performance of absorbent: methyl orange (MO), bromocresol green (BCG), Methylene Blue (MB) and Rhodamine B (RB), respectively. MO and BCG are water soluble anionic dyes, whereas RB and MB are water soluble cationic dyes. In a series of typical experiments, 10 mg each of PSN-100, PSN-250 & PSN-500 was soaked into 10 mL each of four dyes with concentration 300 mg L−1 and pH value was between 6.5 and 7.5. After certain time intervals, we have collected absorption data by using UV-Vis Spectrophotometer.The experimental results of selective adsorption experiment using four sample dye solutions using PSN-100, 500 & 250 adsorbents has been shown in Fig. 4. Firstly, we observed that the color of MO and BCG solutions before and after PSN-100 adsorption changed from orange, pale blue to transparency, whereas no substantial color change was observed for RB and MB as shown in Fig. 4B, indicating the adsorption of only anionic dyes. Secondly, in PSN-500 it was observed that color of RB and MB solutions before and after adsorption changed from purple, blue to transparency, whereas no substantial color change for MO and BCG, indicating the adsorption of cationic dyes as shown in Fig. 4C. Finally, in the optimized case of PSN-250 adsorbent, the color of MO, BCG, RB and MB solutions before and after adsorption changed from orange, pale blue, purple and blue to transparency, indicating the adsorption of both anionic and cationic dyes as shown in Fig. 4D.
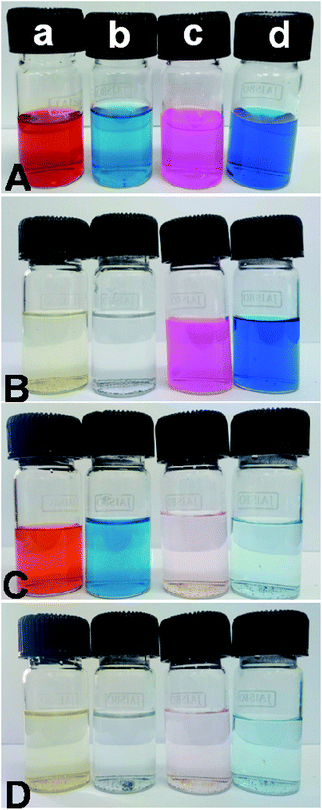 | ||
| Fig. 4 (A) Shows color of dyes (a) MO, (b) BCG, (c) RB and (d) MB before adsorption, whereas (B, C and D) shows colour of dyes after adsorption by PSN-100, PSN-500 and PSN-250, respectively. | ||
Confirmation of dye adsorption by UV-Vis spectroscopy.
The adsorption of dyes by the different synthesized adsorbents was further checked by UV-Vis spectroscopy. From Fig. 5, it can be seen that the drop in concentration of dyes with time was observed for MO and BCG with PSN-100; RB and MB with PSN-500; MO, BCG, RB and MB with PSN-250 adsorbents. In all the adsorption experiments, the drop in absorbance maxima for MO, BCG, RB and MB were analyzed at 464, 617, 561 and 661 nm, respectively. Spectroscopic study also confirmed that only anionic dyes were absorbed by PSN-100 and cationic dyes were absorbed by PSN-500, whereas both the dyes were absorbed by PSN-250. Those dyes which were not adsorbed by adsorbents the change in absorption spectra remains insignificant. Both spectroscopic as well as visual detection experiments clearly validate the selective adsorption of anionic, anionic and cationic, and cationic dyes by PSN-100, optimized PSN-250 and PSN-500 adsorbents, respectively.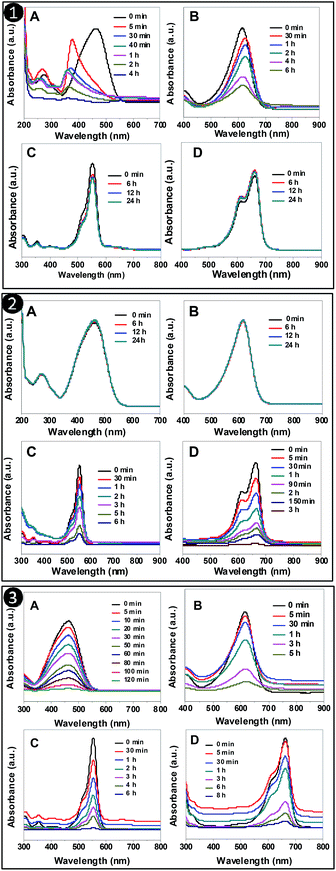 | ||
| Fig. 5 UV-Vis absorption spectra of organic dyes (A) MO (B) BCG (C) RB (D) MB after interaction with: (1) PSN-100 (2) PSN-500 and (3) PSN-250 at different time interval. | ||
Adsorption mechanism
It is essential to identify the structural evolution and possible mechanism for dye adsorption by synthesized adsorbents. The adsorption performance of an adsorbent is highly dependent on its surface area, pore size, pore volume and its selectivity depends on its surface charge and electrostatic attraction. The mechanism of adsorption of surfactant on silica surface can be summarised in the following steps: in the first step, when small quantity of CTAB molecule interact with silica particle, there is a formation of surfactant monolayer by electrostatic attraction between the positively charged head group of surfactants and negative charged silica surface. This result in the formation of PSN stabilized by hydrophobic environment. In the second step, after the addition of slight excess of CTAB (more than CMC) there would be formation of surfactant bilayer through the interaction of hydrophobic tail group of CTAB molecules which results, the formation of positive charge on surface of PSN.20–22It is already reported that during the process of calcination the surfactant layer would be exfoliated slowly which favor particle aggregation and pore size growth. On the basis of this hypothesis and experimental results, we speculate the possible dye adsorption mechanism and structural evolution for PSN-100, PSN-250 and PSN-500 adsorbent into three stages as shown in Fig. 6. In the first stage, the calcination of PSN at 100 °C would have positive surface charge with surfactant bilayers as shown in Fig. 6A. Therefore in PSN-100, electrostatic attraction between positively charged adsorbent and anionic dyes was primarily responsible for adsorption of anionic dyes. In the second stage, the calcination process at or above 500 °C removed the surfactant layer completely from the silica surface and left negatively charged silica particles. Moreover, the electrostatic attraction between the negative and positive surface charge of adsorbent and dyes were key driving force for the adsorption of cationic dyes as shown in Fig. 6B. In third stage, the optimized calcination (240–250 °C) have resulted to partial removal of surfactant bilayer which favour adsorption of both cationic and anionic dyes, this peculiar property could be explained by the electrostatic attraction as shown in Fig. 6C. TGA study also confirms that there is loss in weight and partial removal of surfactant layer above 200 °C which will open the door for adsorption of both anionic & cationic dyes. Moreover, the surfactant bilayer would not be much stable above 200 °C and it would favor the aggregation of the PSN particles and minimize the repulsion of cationic head group of surfactant and cationic dyes to a certain extent. This leads to adsorption of both cationic dyes and anionic dyes with PSN-250 adsorbent.
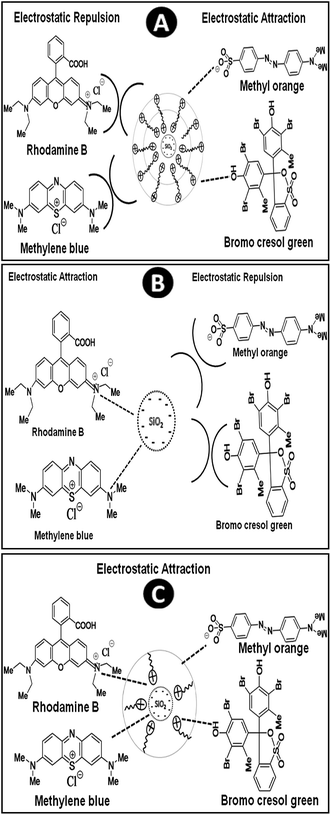 | ||
| Fig. 6 Proposed mechanism of interaction of organic dyes with: (A) PSN-100 (B) PSN-500 and (C) PSN-250. | ||
MO–CTAB interaction
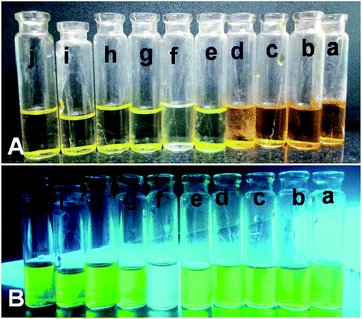
We have observed interesting facts during the adsorption of dyes that absorption spectra of dyes showed blue shift after interaction with cationic part of the surfactant. To deeply evaluate the interaction, fixed concentration (1.0 × 10⁻⁵ M) of MO was added into varying concentration of CTAB solution and absorbance spectra was recorded using UV-Vis spectroscopy. We observed a pronounced blue shift in λmax of MO from 464 nm to 375 nm. Similar behavior was also observed by various research groups.29–31 In Fig. 7 we have shown that as the concentration of CTAB increases in the mixture of MO–CTAB solution, λmax shifted from 460 nm to 375 nm between the concentration range of 10−4 to 10−5 M; furthermore, it reached 420 nm at much higher concentration range of 10−3 to 10−1 M.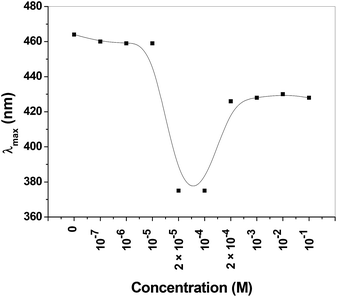 | ||
| Fig. 7 Behavior of absorption maxima (λmax) of methyl orange after mixing with various concentration of CTAB. | ||
Hence, the blue shift spectral signature as depicted in Fig. 7 was an affirmation for the interaction of MO with the CTAB templated PSN adsorbents. We further examined the tunability of emission colour of MO–CTAB mixture under UV light at 365 nm as shown in Fig. 8B. We observed greenish colour at wide range of varying concentration of CTAB from 1 × 10⁻⁸ M to 1 × 10⁻¹ M, but exceptionally transparent at 1 × 10⁻⁴ M.
This might be due to the cis-trans-cis photo isomerization of azo bond of MO and change in micro-environment of dye in micellar medium.31 The change in emission colour of MO–CTAB mixture required further study using various other tools, which was beyond the scope of our present experiment.
Adsorption capacity and dye removal efficiency
Based on the results of adsorption studies, we carried out batch experiments to test the adsorption capacity and dye removal efficiency of PSN-100, PSN-250 & PSN-500. In set of parallel experiments, 50 mg of respective adsorbents were added into 50 mL respective aqueous dye solutions as follows: PSN-100 with MO and BCG; PSN-250 with MO, BCG, RB and MB; PSN-500 with RB and MB with variable initial concentration (100, 200, 300, 400, 500 mg L−1). Next, the adsorbent–dye mixtures was stirred for a certain time and left undisturbed for 24 h. After reaching equilibrium, the adsorbents was separated from the dye solutions by filtration and the remaining concentration of dyes in the filtrates was determined by using a UV-Vis spectrophotometer.The adsorption capacity of adsorbent (Qe mg g−1) was calculated using the following equation:
 | (1) |
The dye removal efficiency at equilibrium time was calculated using the following equation:
 | (2) |
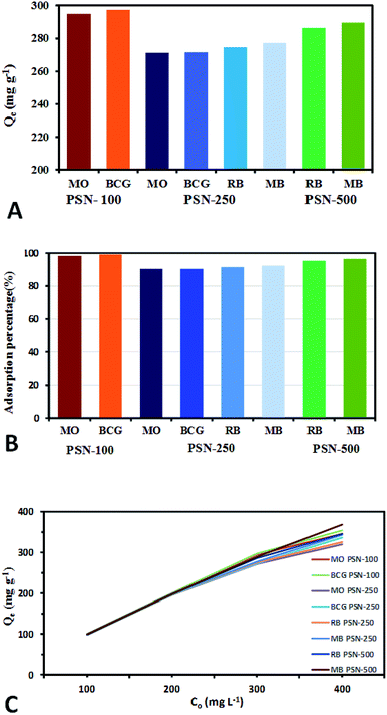
Calibration experiments were performed to assess the amount of adsorbed dye after a given time using the absorbance of the standard aqueous solutions of dyes. Based on eqn (1) after 24 h, the equilibrium concentration (Qe) were as follows: MO and BCG on adsorbent PSN-100 were 295.05 mg L−1 and 297.54 mg L−1; MO, BCG, RB and MB on adsorbent PSN-250 were 271 mg L−1, 272 mg L−1, 274 mg L−1 and 277 mg L−1; RB and MB on adsorbent PSN-500 were 286 mg L−1 and 290 mg L−1 for respective dyes as shown in Fig. 9A. Based on eqn (2) the adsorption percentage were as follows: MO and BCG on adsorbent PSN-100 were 98.35% and 99.18%; MO, BCG, RB and MB on adsorbent PSN-250 were 90.46%, 90.58%, 91.56% and 92.43%; RB and MB on adsorbent PSN-500 were 95.45% and 96.5%, respectively as shown in Fig. 9B. With the initial increase in concentration from 100 to 400 mg L−1, the equilibrium adsorptions (Qe) gradually increases, and the maximum adsorptions for MO, BCG on PSN-100; MO, BCG, RB, MB on PSN-250; RB, MB on PSN-500 were 345.67, 354.52, 320.49, 336.67, 325.42, 342.65, 345.08 and 368.68 mg g−1, respectively as shown in Fig. 9C. All the above mentioned experimental findings indicate calcination triggered versatile, tunable and selective dye adsorption property of synthesized adsorbent.
Regeneration and reusability of adsorbent
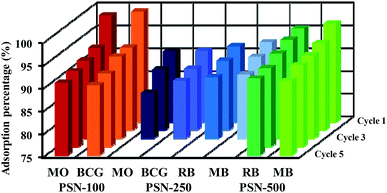
For readsorption experiments, 50 mg of PSN-100, 250 and 500 samples loaded with dyes was washed by desorption solutions, dried and redisposed into 50 mL of dye solution with concentration 300 mg L−1. An important property of adsorbent is to possess good sorption and excellent regenerative capacity. In brief, after dye adsorption, anionic dye (MO & BCG) adsorbed by PSN-100 and PSN-250, cationic dye (RB & MB) adsorbed by PSN-250 and PSN-500 were collected and washed with distilled water for removing the unabsorbed dyes. After washing, the dye loaded PSN-100, PSN-250 & PSN-500 samples were soaked in 10 mL of desorption solutions for 1 h and agitated at 400 rpm for 10 min. For anionic dyes (MO and BCG) basic medium of aqueous NH3 in 50% (v/v) ethanol, while for cationic dyes (RB and MB) acidic medium of 0.5 M HCl in 50% (v/v) ethanol was selected as the desorption solution. In basic pH, increase in number of hydroxyl ions, destabilizes the electrostatic attraction between positively charged surface of surfactant and the anionic dyes. While in acidic pH, the hydrogen ions stabilizes the negatively charged surface of silica and provides favorable environment for desorption of cationic dyes. This result indicated that main chemical reaction during the adsorption/desorption is the electrostatic ion mechanism. Finally the regenerated PSN-100, 250 & 500 were dried and reused in the next cycle of dye adsorption experiments.The adsorption–desorption experiments have been shown in Fig. 10. We observed the adsorption capacity of PSN-100, PSN-250 & PSN-500 decreased after five, three and five consecutive cycles respectively and the removal efficiency was still greater than 90% for PSN-500 & 100, while for PSN-250 a slight decrease around 85–90% after third cycle. We speculate that the decrease in efficiency of PSN-500 and PSN-250 was due to pore filling mechanism, whereas for PSN-100 was due to destabilization of surfactant layer. Therefore, the prepared adsorbents has a good versatility in dye adsorption, regeneration and reusability which is suitable for coloured waste water cleanup with high-efficiency.
Conclusion
In summary, CTAB coated PSN particles were successfully synthesized by top down approach by controlled calcination. The, CTAB template has considerable influence on adsorption of dyes has been demonstrated. Experimental results indicated that tunable morphology of porous silica nanoparticles showed selective adsorption of cationic and anionic dyes with specificity: (1) PSN-100 showed specificity towards anionic dyes (2) PSN-500 showed specificity towards cationic dyes (3) PSN-250 showed specificity towards both cationic and anionic dyes. Mode of interaction of dyes and its selectivity with PSN have been successfully explained through the electrostatic interaction. Adsorption–desorption experiment has been performed to check its regenerable ability and reusability. Further, PSN adsorption behaviour can be exploited in medical and biomedical applications. We have to work on the fluorescence property of MO in micellar medium, mechanistic path of formation of PSN and adsorption isotherm in more details, which will further help to explore this field.Conflicts of interest
There are no conflicts to declare.Abbreviations
| CTAB | Cetyl trimethyl ammonium bromide |
| MO | Methyl orange |
| BCG | Bromo cresol green |
| MB | Methylene blue |
| RB | Rhodamine B |
| CMC | Critical micelle concentration |
| PSN | Porous silica nanoparticles |
| PSN-100 | Porous silica nanoparticles calcined 100 °C |
| PSN-250 | Porous silica nanoparticles calcined 250 °C |
| PSN-500 | Porous silica nanoparticles calcined 500 °C |
Acknowledgements
Adhish Jaiswal and Raj acknowledge financial support from IGN Tribal University, Amarkantak and Raj acknowledges the IGNTU for providing research fellowship.References
- A. Ahmad, S. H. Mohd-Setapar, C. S. Chuong, A. Khatoon, W. A. Wani, R. Kumar and M. Rafatullah, RSC Adv., 2015, 5, 30801–30818 RSC.
- A. Bafana, S. S. Devi and T. Chakrabarti, Environ. Rev., 2011, 19, 350–371 CrossRef CAS.
- S. P. S. Markandeya and D. Mohan, Res. J. Environ. Toxicol., 2017, 11, 72–89 CrossRef.
- L. Labiadh, A. Barbucci, M. P. Carpanese, A. Gadri, S. Ammar and M. Panizza, J. Electroanal. Chem., 2016, 766, 94–99 CrossRef CAS.
- K. Lokesh and R. Sivakiran, J. Biochem. Technol., 2014, 3, 177–180 Search PubMed.
- M. T. Yagub, T. K. Sen, S. Afroze and H. M. Ang, Adv. Colloid Interface Sci., 2014, 209, 172–184 CrossRef CAS PubMed.
- L. T. Gibson, Chem. Soc. Rev., 2014, 43, 5173–5182 RSC.
- S. Kachbouri, N. Mnasri, E. Elaloui and Y. Moussaoui, J. Saudi Chem. Soc., 2018, 22, 405–415 CrossRef CAS.
- Y. Li, N. Li, W. Pan, Z. Yu, L. Yang and B. Tang, ACS Appl. Mater. Interfaces, 2017, 9, 2123–2129 CrossRef CAS PubMed.
- R. K. Singh, K. D. Patel, K. W. Leong and H. W. Kim, ACS Appl. Mater. Interfaces, 2017, 9, 10309–10337 CrossRef CAS PubMed.
- R. Duan, F. Xia and L. Jiang, ACS Nano, 2013, 7, 8344–8349 CrossRef CAS PubMed.
- F. Lu, S. H. Wu, Y. Hung and C. Y. Mou, Small, 2009, 5, 1408–1413 CrossRef CAS PubMed.
- M. Bouchoucha, M. F. Côté, R. C. -Gaudreault, M. A. Fortin and F. Kleitz, Chem. Mater., 2016, 28, 4243–4258 CrossRef CAS.
- R. Jiao, Y. Tan, Y. Jiang, M. Hu, S. Li and Q. Zhai, Ind. Eng. Chem. Res., 2014, 53, 12201–12208 CrossRef CAS.
- Q. Cai, Z. S. Luo, W. Q. Pang, Y. W. Fan, X. H. Chen and F. Z. Cui, Chem. Mater., 2001, 13, 258–263 CrossRef CAS.
- Y. D. Chiang, H. Y. Lian, S. Y. Leo, S. G. Wang, Y. Yamauchi and K. C. W. Wu, J. Phys. Chem. C, 2011, 115, 13158–13165 CrossRef CAS.
- A. Maity, A. Das, D. Sen, S. Mazumder and V. Polshettiwar, Langmuir, 2017, 33, 13774–13782 CrossRef CAS PubMed.
- X. K. Ma, N. H. Lee, H. J. Oh, J. W. Kim, C. K. Rhee, K. S. Park and S. J. Kim, Colloids Surf., A, 2010, 358, 172–176 CrossRef CAS.
- Y. Li, B. P. Bastakoti, M. Imura, J. Tang, A. Aldalbahi, N. L. Torad and Y. Yamauchi, Chem.–Eur. J., 2015, 21, 6375–6380 CrossRef CAS PubMed.
- E. Santini, J. Krägel, F. Ravera, L. Liggieri and R. Miller, Colloids Surf., A, 2011, 382, 186–191 CrossRef CAS.
- E. Y. Bryleva, N. A. Vodolazkaya, N. O. Mchedlov-Petrossyan, L. V. Samokhina, N. A. Matveevskaya and A. V. Tolmachev, J. Colloid Interface Sci., 2007, 316, 712–722 CrossRef CAS PubMed.
- W. Wang, B. Gu, L. Liang and W. A. Hamilton, J. Phys. Chem. B, 2004, 108, 17477–17483 CrossRef CAS.
- T. P. Goloub, L. K. Koopal, B. H. Bijsterbosch and M. P. Sidorova, Langmuir, 2002, 12, 3188–3194 CrossRef.
- R. Atkin, V. S. J. Craig, E. J. Wanless and S. Biggs, Adv. Colloid Interface Sci., 2003, 316, 712–722 Search PubMed.
- R. Atkin, V. S. J. Craig and S. Biggs, Langmuir, 2000, 16, 9374–9380 CrossRef CAS.
- H. Sepehrian, J. Fasihi and M. K. Mahani, Ind. Eng. Chem. Res., 2009, 48, 6772–6775 CrossRef CAS.
- Y. X. Zhao, M. Y. Ding and D. P. Chen, Anal. Chim. Acta, 2005, 542, 193–198 CrossRef CAS.
- G. A. Blomfield and L. H. Little, Can. J. Chem., 1973, 51, 1771–1781 CrossRef CAS.
- F. Quadrifoglio and V. Crescenzi, J. Colloid Interface Sci., 1971, 35, 447–459 CrossRef CAS.
- K. K. Karukstis, D. A. Savin, C. T. Loftus and N. D. D'Angelo, J. Colloid Interface Sci., 1998, 203, 157–163 CrossRef CAS.
- A. Dutta and R. K. Dutta, Spectrochim. Acta, Part A, 2014, 126, 270–279 CrossRef CAS PubMed.
| This journal is © The Royal Society of Chemistry 2019 |

