 Open Access Article
Fabrication of graphite via electrochemical conversion of CO2 in a CaCl2 based molten salt at a relatively low temperature†
Liwen Hu *ab,
Wanlin Yang
 ab,
Zhikun Yangab and
Jian Xuab
aCollege of Materials Science and Engineering, Chongqing University, Chongqing 400044, People's Republic of China. E-mail: lwh0423@cqu.edu.cn
bChongqing Key Laboratory of Vanadium-Titanium Metallurgy and Advanced Materials, Chongqing University, Chongqing 400044, China
First published on 14th March 2019
Abstract
Fabrication of graphite by electrochemical splitting of CO2 in a CaCl2 molten salt is a promising approach for the efficient and economical utilization of CO2. Systematically understanding the graphitization mechanism is of great significance to optimize the process. In this work, how pulse parameter and type of anode affect morphologies and crystallinity of graphite nanostructures were both investigated. The results indicate that the optimum current efficiency, energy consumption and highest degree of graphitization can be achieved by employing an appropriate pulse current parameter (Ton![[thin space (1/6-em)]](https://www.rsc.org/images/entities/char_2009.gif) :
:![[thin space (1/6-em)]](https://www.rsc.org/images/entities/char_2009.gif) Toff = 120
Toff = 120![[thin space (1/6-em)]](https://www.rsc.org/images/entities/char_2009.gif) :
:![[thin space (1/6-em)]](https://www.rsc.org/images/entities/char_2009.gif) 5), and with the utilization of a RuO2–TiO2 inert anode. The microstructure and morphologies show noticeable change by varying electrolytic conditions. In addition, the present study provides an insight into facile ways to improve the graphitization degree by electrochemical conversion of CO2 at a relatively low temperature.
5), and with the utilization of a RuO2–TiO2 inert anode. The microstructure and morphologies show noticeable change by varying electrolytic conditions. In addition, the present study provides an insight into facile ways to improve the graphitization degree by electrochemical conversion of CO2 at a relatively low temperature.
1. Introduction
Carbon nanostructures of different allotropes of carbon including graphite, activated carbon, diamond, graphene and carbon nanotubes have been identified.1,2 Graphite nanostructures have found their applications in many diverse areas; including drug delivery,3 electronics,4 composite materials,5 sensors,6 field emission devices,7 energy storage and conversion, etc.,8–10 due to their outstanding chemical, mechanical, electrical and thermal properties. Traditionally, two general artificial methods are employed to synthesize graphite including: (1) transforming carbon materials directly into graphite under high temperature (3000 °C or even higher) and high pressure.11 (2) Catalytic graphitization by chemical reactions between non-graphitized carbon and metal catalysts (i.e. Fe, Co, Ni, Mn, etc.) at a relatively low temperature (around 1000 °C).12 As part of efforts to address global climate change, the synthesis of carbon nanostructures through electrochemical conversion of CO2 electrolysis has attracted great attention as a greener and environmentally friendly synthesis method. As an alternative approach, molten salt electrolytes for the capture and electrochemical conversion of CO2 have been widely used, as molten salts are low cost, with a wide potential window, high ionic conductivity and low vapor pressure.13,14 Up to now, various value-added carbon nanostructures such as carbon nanofibers, carbon nanotubes (CNTs), hollow carbon spheres, graphene like ultrathin graphite sheets and graphene have been successfully synthesized via molten salt electrolysis by controlling the electrolytic conditions.15–18 In most cases, amorphous carbon was the main product in lithium ions containing molten alkali carbonates. For example, Yin et al. obtained amorphous carbon in Li2CO3–Na2CO3–K2CO3 and Happiness et al. also got amorphous carbon in Li2CO3–K2CO3.13,19 By adding trace transition metals to act as CNF nucleation sites or adding zinc as an initiator in molten salt, and with the control of current density, carbon nanofibers were generated.20 Anna douglas deposited CNTs with good quality and higher purity (99%), by introducing Fe and coordinated control of current density and melt composition.21 Hollow carbon spheres have been fabricated assisted by micro-bubble effect formed by CO.18 In our previous work, high-yield synthesis of well-developed CNTs was achieved by using glassy carbon as the cathode in molten CaCl2–NaCl–CaO at 750 °C.15 Moreover, graphene and ultrathin graphite sheets were also prepared by electrochemical conversion of CO2 in molten CaCl2–NaCl–CaO and CaCl2–CaO above 750 °C.16,17 All these investigations showed that in order to realize controllable preparation of carbon materials with unique structure and morphologies, reaction conditions, such as temperature, cell voltage, type of cathode used and melt composition should be strictly selected.22,23 Recently, researches have been focus on electrochemically transformation of amorphous carbons to crystalline graphite and electrochemical conversion of CO2 to crystalline graphite with the assistance of sulfur. Essentially, the transformation of amorphous carbons to crystalline graphite involves a deep de-oxidation of amorphous carbons. So the oxygen ions generated and accumulated during the reduction of CO32− at the cathode are quite unfavorable for obtaining graphite.Pulsed current (PC) electrodeposition has become an essential tool for producing metal and alloy coatings in a wide range of industries, as it can significantly influence the control of metal electrocrystallisation.24 The reason for this phenomenon is that pulse current applied can largely perturb the adsorption–desorption phenomena occurring at the coating-catholyte interface, leading to the production of smooth surfaces with improved properties.25 The pulsed current can have a significant influence on the composition, morphology and properties of electrodeposited products. Therefore, pulse current electrolysis rather than traditional constant current electrodeposition was employed to prepare graphite nanostructures, as it can improve concentration polarization. In pulse electrodeposition, each pulse consists of an on-time during which current is applied and an off-time during which zero current is applied. It is possible to control the deposited layer composition and thickness in an atomic order by regulating the pulse parameters. The microstructures, morphology and current efficiency was evaluated by XRD, Raman, SEM and TEM.
2. Experimental
The experimental setup was shown in Fig. S1,† including an alumina crucible containing the molten salt placed in an alumina tube with cooling water circulating around the lid. Anhydrous CaCl2, NaCl and LiCl were of analytical purity and were purchased from Sinopharm Chemical Reagent Co., Ltd. The CaO was obtained by calcinating of CaCO3 at 1423 K for 15 min. The RuO2·TiO2 anode was prepared and assembled as our previous work. The graphite rod with a diameter of 3 mm was used as the cathode during electrolysis.It has been found that the graphitization degree of electrodeposited carbon can be evidently improved by introducing Li+. Therefore 3 wt% LiCl was added into the melt. About 200 g anhydrous CaCl2–NaCl–LiCl–CaO was added into an alumina crucible, which was placed in a sealed vertical tubular reactor. The salt was dried at 300 °C under vacuum for up to 24 h to remove moisture before it was slowly heated up to the target temperature.
To obtain the TiO2·Ni anodes, the TiO2 and nickel powder (∼4 g) were blended in a mortar, then pressed into pellets with 20 mm diameter and about 3 mm thickness using a uniaxial pressure of 10 MPa, and finally sintered at 1400 °C under argon atmosphere for 12 h in a tubular furnace.
Pulse current electrolysis was carried out between TiO2·RuO2/TiO2·Ni anode and graphite rod (3 mm in diameter) cathode in the molten CaCl2–NaCl–LiCl–CaO with the utilization of power supply (Princeton 2287). Before electrolysis experiment, CO2 was continuously bubbled into the melt through an alumina tube for 30 minutes and then the alumina tube was withdrawn to the upper part of the furnace and the atmosphere of CO2 was maintained over the melt continuously. After electrolysis, the electrodes were withdrawn to the upper cooler part of the reactor. The cathodic product was taken out and immersed into 1 mol L−1 HCl solution to remove the residuals and impurities, and then dried in a drying oven at 120 °C.
The obtained products on the cathode were characterized by scanning electron microscopy (SEM, JEOL-JSM-7800F, FEI NOVA NANOSEM 400), transmission electron microscopy (TEM, ZEISS, LIBRA 200), high-resolution Raman spectroscopic analysis (HORIBA Jobin Yvon S.A.S HR evolution) with excitation at 532 nm and X-ray diffractometer (XRD, Panalytical X'Pert Powder, Panalytical B.V.).
3. Results and discussions
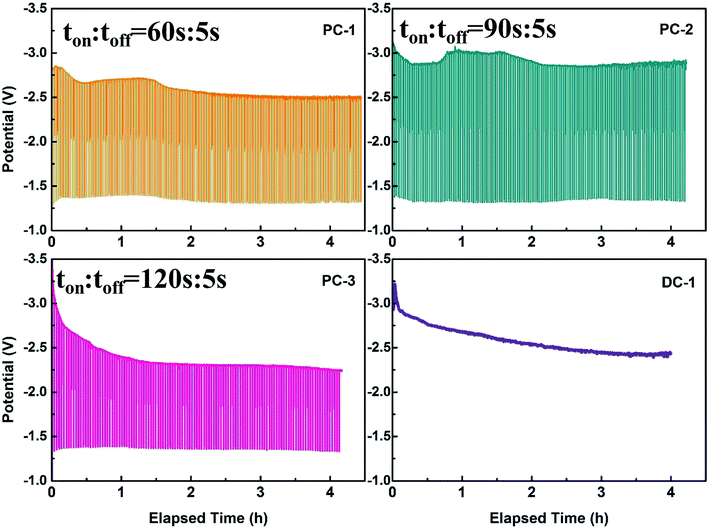
Traditionally, direct current electrodeposition was applied to obtain carbon from electrochemical transformation of CO2. Therefore, the consumed carbonate ions can't be supplemented in time and the oxygen ions tend to accumulate at the cathode due to the sluggish diffusion of O2−. The accumulated oxygen ions may be unfavorable for obtaining graphite with good crystallinity. Therefore, pulse current was employed to improve this phenomenon. The graphite nanostructures were electrodeposited on the graphite rod (3 mm in diameter) substrates and optimized in molten CaCl2–NaCl–LiCl–CaO under the CO2 atmosphere by pulse current electrolysis. And the detailed parameters of the experiments are listed in Table 1. The current off time was all set to be an optimized value 5 s, as longer time will to the oxidation of carbon. The relevant potential variation of cathode under different pulse current electrolysis with the utilization of RuO2·TiO2 are presented in Fig. 1 and the cell-voltage variation during initial three pulses can be seen in Fig. S2.† As can be seen in Fig. 1a–c, the overall cell-voltage slightly decreased at the initial stage which can be clearly seen in the first three pulse in Fig. S2† and then tend to be stable within each electrolysis. Two main factors that will influence the cell-voltage, one is the decreased concentration of carbonate ions at the interface of electrode/electrolyte and the other is the increasing surface area of the electrode after carbon deposition. The consumption of carbonate ions at the electrode will lead to a strong electrode polarization while the increasing surface area of the electrode will decrease the current density and thus resulting in a weaker electrode polarization. However, the decreased concentration of carbonate ions and increase of surface area performed simultaneously when electrolysis was progressed. And the change of potential depended on which factor is dominant during electrolysis. Therefore, the initial decrease in cell voltage was due to the increase of the surface area when carbon was deposited. Afterwards, the cell voltage was slightly increased in the situation of PC-1 and PC-2 due to the decreased concentration of carbonate ions, meaning that the regeneration and diffusion rate of carbonate ions are slower than the consumption rate of carbonate ions in both conditions. As in the situation of PC-3 and DC-1, the cell voltage first decreased and then became stable at the later stage. The cell voltage of PC-3 and DC-1 is about 0.5 V lower compared with the cell voltage of PC-1 and PC-2, the reason may be that more carbon particles will be deposited at the cathode as the ratio of ton versus toff is higher.| Sample | Anode | Current/(A) | Temperature (°C) | ton (s) | toff (s) | Cycles |
|---|---|---|---|---|---|---|
| DC-1 | RuO2–TiO2 | 0.8 | 725 | 14![[thin space (1/6-em)]](https://www.rsc.org/images/entities/char_2009.gif) 400 400 |
0 | 1 |
| PC-1 | RuO2–TiO2 | 0.8 | 725 | 60 | 5 | 240 |
| PC-2 | RuO2–TiO2 | 0.8 | 725 | 90 | 5 | 160 |
| PC-3 | RuO2–TiO2 | 0.8 | 725 | 120 | 5 | 120 |
| PC-4 | 8Ni–2TiO2 | 0.8 | 725 | 120 | 5 | 120 |
| PC-5 | 7Ni–3TiO2 | 0.8 | 725 | 120 | 5 | 120 |
The morphologies of graphite nanostructures electrodeposited at different pulse current with the utilization of RuO2·TiO2 were characterized by SEM in Fig. 2. Apparently, mainly random assembled granule and fiber-like carbon nanostructures are observed in PC-1, which is significantly different from the morphology of PC-2, PC-3 and DC-1. And the PC-1 sample shows a wide range of particle size and the reason for this phenomenon is that the carbon particles will be easier to aggregate and assemble on the underlying carbon layer to form different cluster. Therefore, the shape and size of the cluster is determined by the deposition mass of carbon per unit area.26 Among PC-1, PC-2 and PC-3, the particle tend to assemble into rod-like structures and the size of the rod-like morphology of PC-3 is a little bigger. In DC-1 sample, the particles seem to grow with each other to form a compact structure. Moreover, the wire-like or fiber-like can be observed in all samples which may due to the assembly of small particles at high temperature or lithium intercalation.
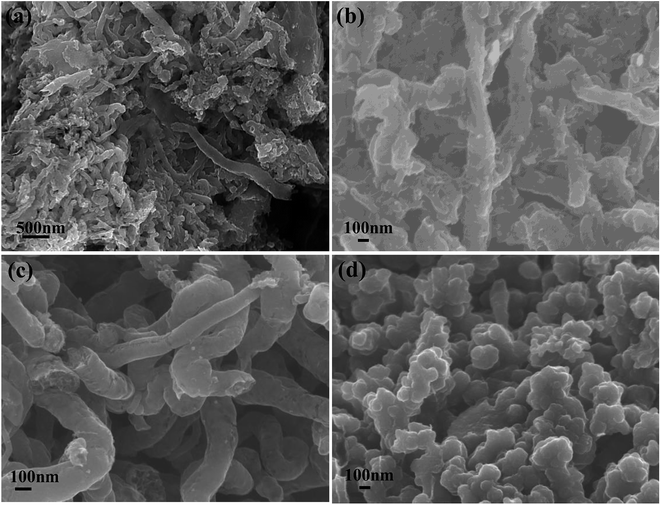 | ||
| Fig. 2 SEM images of graphite nanostructures at different electrolytic conditions (a) PC-1; (b) PC-2; (c) PC-3; (d) DC-1. | ||
In order to further understand the assembly and growth mechanism of the graphite nanostructures, bright-field TEM were employed to provide more details. As can be seen in Fig. 3a, twisted multi-walled carbon nanotubes (MWCNTs) with a diameter of 10–20 nm are observed to be the dominating products in PC-1. Also the rod-like structure consisting of many small carbon particles with a diameter of about 70 nm are the main product in PC-2, see in Fig. 3b. Similarly, rod-like structures consist of carbon plates are dominated and the diameter of the rod-like structure is about 100 nm, as shown in Fig. 3c. Fig. 3d showed the TEM images of DC-1 and only random distributed particles can be observed. Therefore, it is inferred that in pulse current electrolysis, the carbon nanostructures were deposit continuously when current was applied while the carbon particle aggregate with each other to assembled into rod-like structure during current off time. Hence, it is believed that the shape and size of the cluster is determined by the deposition mass of carbon per unit area. However, the carbon nanostructures obtained by constant current electrolysis showed a compact structure by continuous growth of carbon.
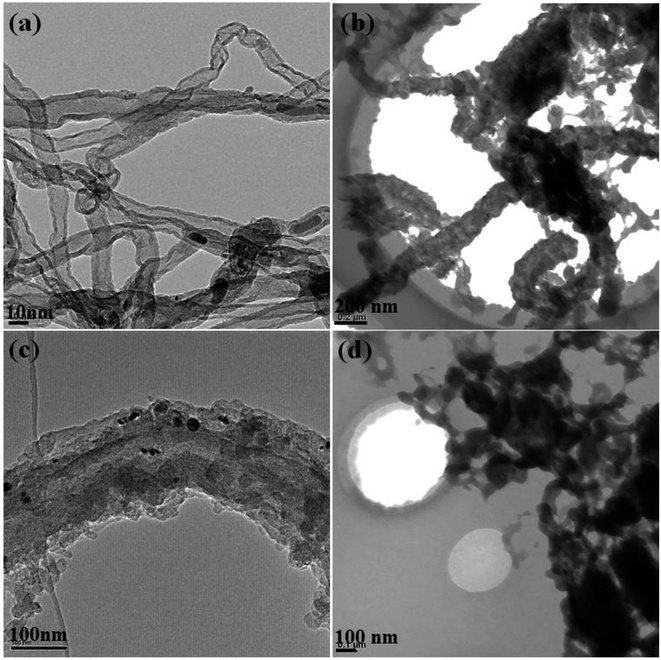 | ||
| Fig. 3 TEM images of graphite nanostructures at different electrolytic conditions (a) PC-1; (b) PC-2; (c) PC-3; (d) DC-1. | ||
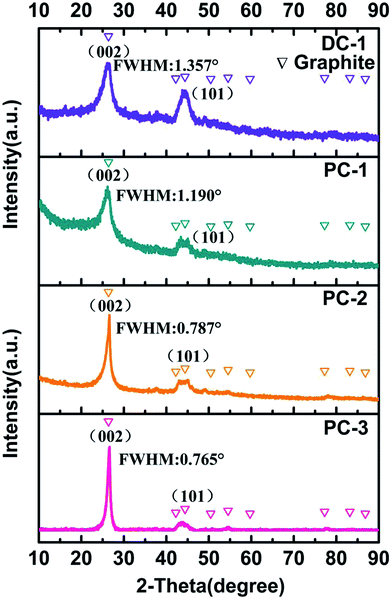
The XRD was employed to investigate the cathodic products obtained at different electrolysis condition, as presented in Fig. 4. Interestingly, all the deposit showed two relatively sharp peaks at 2θ = 26° and 2θ = 44.5°, which are index to the (002) peak and (101) peak of graphite, respectively, disclosing that they all have very good graphitic structure.27 The full width at half maximum of graphite (002) peak for PC-1, PC-2, PC-3 and DC-1 are 1.190°, 0.787°, 0.765 and 1.357°, respectively. The decline of full width at half maximum of graphite (002) peak also confirmed the enhanced crystallinity of the graphite nanostructure, implying that higher ratio of ton/toff is more favorable to form graphitic carbon. And the degree of graphitization for PC-1, PC-2 and PC-3 are obviously higher than DC-1, indicating timely current off is also benefit for optimizing the crystallinity of the cathodic product. And the carbon and oxygen atom content has been obtained by XPS analysis and showed in Table S1.† It can be observed that the C atom content increased with the current on time and is relatively higher than that obtained by direct current electrolysis. The graphitization process actually involves the electrochemical removal of oxygen from the carbon matrix. So accumulated oxygen ions at the cathode will lead to the defects of the electrolytic carbons. By employing a pulse current during which a small interruption occurred, a higher degree of graphitization will be realized.
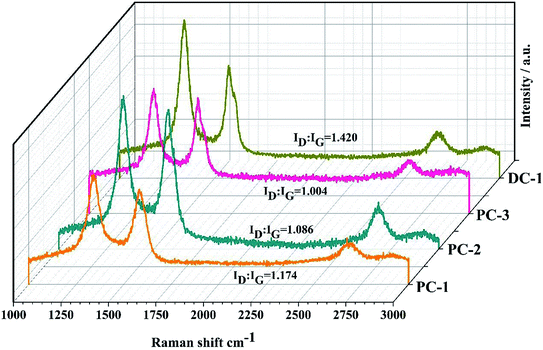
Raman microscopy was also conducted and provided a fast, nondestructive way to analyze the characteristics of the graphitic carbon, as shown in Fig. 5. The G-band at about 1588 cm−1 is related to the sp2 (C![[double bond, length as m-dash]](https://www.rsc.org/images/entities/char_e001.gif) C) aromatic carbon structure vibrations of a perfect graphite, while the D-band at about 1348 cm−1 is approximately associated with the disorder-induced scattering resulting from imperfections. The integrated intensity ratio ID
C) aromatic carbon structure vibrations of a perfect graphite, while the D-band at about 1348 cm−1 is approximately associated with the disorder-induced scattering resulting from imperfections. The integrated intensity ratio ID![[thin space (1/6-em)]](https://www.rsc.org/images/entities/char_2009.gif) :
:![[thin space (1/6-em)]](https://www.rsc.org/images/entities/char_2009.gif) IG for the D-band and G-band is widely used for characterizing the defect quantity in graphitic materials and the ratios under different electrolysis conditions are shown in Fig. 5. It is calculated that the ratio of ID/IG decreased with the increase of ton/toff. This observation is in agreement with the above XRD results. The 2D peak emerges in the range of 2500–2800 cm−1 can be observed in all samples and the evolution of this band is associated with the degree of graphitization of the samples and was related to the stacking order occurring along the c axis, indicating more graphitic crystallites and fewer defects of the electrolytic carbon.28
IG for the D-band and G-band is widely used for characterizing the defect quantity in graphitic materials and the ratios under different electrolysis conditions are shown in Fig. 5. It is calculated that the ratio of ID/IG decreased with the increase of ton/toff. This observation is in agreement with the above XRD results. The 2D peak emerges in the range of 2500–2800 cm−1 can be observed in all samples and the evolution of this band is associated with the degree of graphitization of the samples and was related to the stacking order occurring along the c axis, indicating more graphitic crystallites and fewer defects of the electrolytic carbon.28
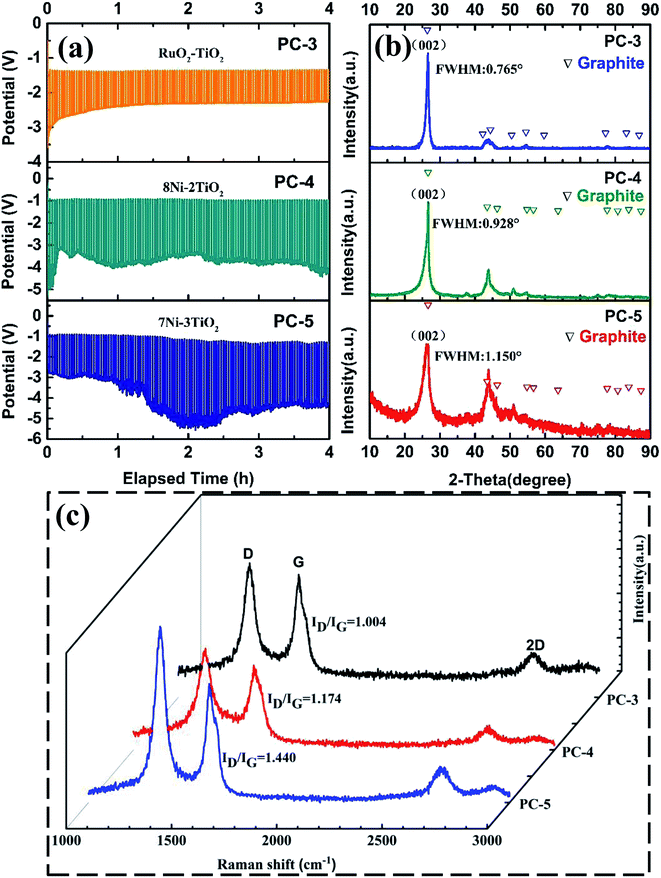
An alternative cheaper Ni·TiO2 anode was applied and the influences of the anode and the cell voltage versus time curves are shown in Fig. 6a. For RuO2·TiO2 anode, the cell voltage slightly decreased at initial stage and then maintained at a steady value of about 2.5 V. However, for 0.7Ni·0.3TiO2 and 0.8Ni·0.2TiO2, the cell voltage reveals a rapid rise at the initial stage and then step into a slow decrease. The cell voltage of 0.7Ni·0.3TiO2 and 0.8Ni·0.2TiO2 is obvious higher than that of RuO2·TiO2 anode. The reason is that the excessive nickel aggravated the oxidation of the nickel phase and a thick insulating NiO or NiOx (1 ≤ x ≤ 2) coating was formed on the anode substrate, resulting in the decrease of anodic electrical conductivity and increase of cell voltage.29 The appearances of the electrodes and XRD pattern of the anode before and after electrolysis are compared and shown in Fig. S3 and S4.† In Fig. S3,† it is observed that the external dimension of both 0.7Ni·0.3TiO2 and 0.8Ni·0.2TiO2 have barely been affected by the electrolysis, in close agreement with previous investigations. The XRD pattern in Fig. S4† of the sintered 0.7Ni·0.3TiO2 pellet showed a noticeable signal from NiTiO3 phase compared to XRD patterns of that obtained before sintering. NiTiO3 phase on the surface is generated by reaction of NiO and TiO2, while the NiO is formed as a small amount of nickel was oxidized during sintering. After electrolysis, a noticeable signal of NiO was observed which is in accordance with the previous results.29 The XRD results of cathodic product in Fig. 6b shows sharp peaks at 26° and 44.5°, which are index to the (002 plane) and (101 plane) of graphite, respectively, indicating the presence of graphite phase in PC-3, PC-4 and PC-5 samples. Raman spectra of PC-4 and PC-5 are similar to that of PC-3, where G-band at about 1588 cm−1 and D-band at about 1348 cm−1 can be seen. The integrated intensity ratio ID![[thin space (1/6-em)]](https://www.rsc.org/images/entities/char_2009.gif) :
:![[thin space (1/6-em)]](https://www.rsc.org/images/entities/char_2009.gif) IG for the D-band and G-band is calculated and shown in Fig. 6c. For Ni–TiO2 anode, the ratio of ID
IG for the D-band and G-band is calculated and shown in Fig. 6c. For Ni–TiO2 anode, the ratio of ID![[thin space (1/6-em)]](https://www.rsc.org/images/entities/char_2009.gif) :
:![[thin space (1/6-em)]](https://www.rsc.org/images/entities/char_2009.gif) IG decreased with the increasing amount of nickel phase in the anode and the ratio ID
IG decreased with the increasing amount of nickel phase in the anode and the ratio ID![[thin space (1/6-em)]](https://www.rsc.org/images/entities/char_2009.gif) :
:![[thin space (1/6-em)]](https://www.rsc.org/images/entities/char_2009.gif) IG of PC-4 and PC-5 is obvious lower that of PC-3. The results demonstrated that better conductivity of the anode is preferable for the higher degree of graphitization.
IG of PC-4 and PC-5 is obvious lower that of PC-3. The results demonstrated that better conductivity of the anode is preferable for the higher degree of graphitization.
The SEM images of the electro-deposited carbon with the utilization of 8Ni·2TiO2 and 7Ni·3TiO2 anodes are shown in Fig. S5.† As illustrated in Fig. S5a and b,† the carbon nano-particles are the main product in PC-4 sample and the small particles can be assembled into bigger aggregations, which is well in agreement with the explanation discussed above. However, large amount of carbon fibers with a small fraction of carbon nano-particles can be detected in Fig. S5c and d,† which is different from ones obtained using RuO2·TiO2. The results demonstrated that the morphologies and the crystal structures will be both influenced by the inert anodes, specifically the conductivity of anode.
The corresponding current efficiency and energy consumption at all electrolytic conditions were evaluated and compared, as shown in Fig. 7. It should be pointed out that the current efficiency was calculated by weighing the mass of the washed deposition at the cathode, which may be a little lower. In Fig. 7a, it is observed that the current efficiency increased when ton time was increasing, which might be attributed to the side reactions such as alkali metal deposition or the formation of carbides when the cell voltage is higher (see in Fig. 1). And the current efficiency of DC-1 is lower than PC-3, indicating that by employing pulse current electrolysis with appropriate parameters can increase the current efficiency. The current efficiency largely decreased when the Ni·TiO2 anode was used, as the insulating oxide layer will be formed during electrolysis, which will largely increase the cell voltage. It is also noted that the energy consumption shows the opposite trend. It is observed in Fig. 7b that the energy consumption of PC-3 is lower than that of PC-1, PC-2 and DC-1. Furthermore, the energy consumption of PC-4 and PC-5 are also much higher, due to the high cell voltage caused by insulating layer formed during electrolysis. The influences of the anode have also been investigated and shown in ESI.†
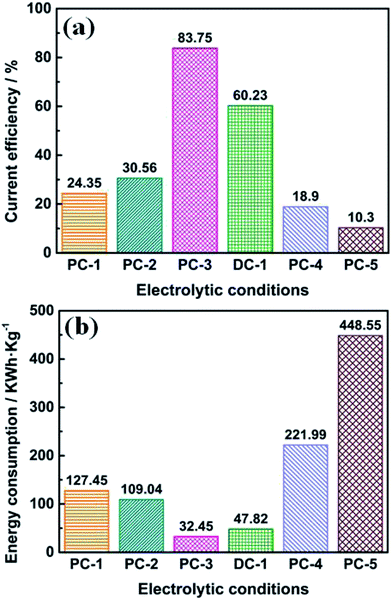 | ||
| Fig. 7 Current efficiency (a) and energy consumption (b) calculated by experimental data under different electrolytic conditions. | ||
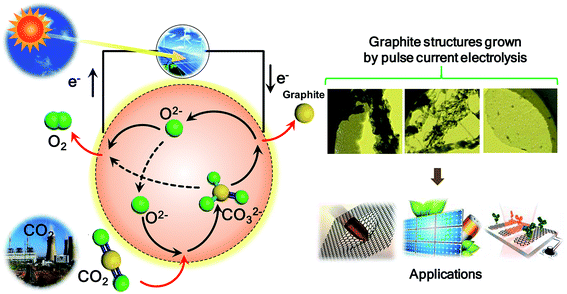
Artificial photosynthesis to deal with greenhouse gas CO2 has been proposed and the scheme is showed in Fig. 8. CO2 emissions from industry after enrichment can be fed continuously into an electrolyte where CO2 can be captured by oxygen ions in the melt to form carbonate ions. Then the carbonate ions can be electrochemically transformed into various graphite nanostructures and environmentally friendly by-product oxygen by pulse current electrolysis. And the obtained graphite nanostructures have wide applications in energy storage systems, flexible display, sensor and so on.
4. Conclusion
Various graphite nanostructures were prepared by electrochemical reduction of CO32− at graphite cathode in molten CaCl2–NaCl–LiCl–CaO. It has been found that the morphologies and microstructures of the graphite product was influenced by pulse current parameter and the kind of anode. It is noted that the carbon nanostructures obtained are mainly graphite particle and MWCNT in some cases, and the particles tend to assemble with each other to form rod-like structures or larger aggregates during current off time in pulse current electrolysis. The results showed that PC-3 (obtained at ton and toff are 120 seconds and 5 seconds, respectively) owns the highest graphitization degree, the highest current efficiency and lowest energy consumption. With the utilization of RuO2·TiO2 anode, the current efficiency is much higher and the energy consumed is lower than that of using Ni·TiO2 anode.Conflicts of interest
There are no conflicts to declare.Acknowledgements
The authors are grateful to the National Natural Science Foundation of China (No. 51804056) and the Fundamental Research Funds for the Central Universities (Project No. 2018CDXYCL0018 and 2019CDXYCL0031).References
- J. W. Jiang, J. Leng, J. Li, Z. Guo, T. Chang, X. Guo and T. Zhang, Carbon, 2017, 118, 370 CrossRef CAS.
- H. Fan and W. Shen, ChemSusChem, 2015, 8, 2004 CrossRef CAS PubMed.
- R. G. Mendes, A. Bachmatiuk, B. Büchner, G. Cuniberti and M. H. Rümmeli, J. Mater. Chem. B, 2013, 1, 401 RSC.
- E. Shi, H. Li, L. Yang, J. Hou, Y. Li, L. Li, A. Cao and Y. Fang, Adv. Mater., 2015, 27, 682 CrossRef CAS PubMed.
- C. Zheng, X. Zhou, H. Cao, G. Wang and Z. Liu, J. Power Sources, 2014, 258, 290 CrossRef CAS.
- W. Meng, W. Chen, L. Zhao, Y. Huang, M. Zhu, Y. Huang, Y. Fu, F. Geng, J. Yu, X. Chen and C. Zhi, Nano Energy, 2014, 8, 133 CrossRef CAS.
- A. Pospischil, M. M. Furchi and T. Mueller, Nat. Nanotechnol., 2014, 9, 257 CrossRef CAS PubMed.
- D. Yu, K. Goh, H. Wang, L. Wei, W. Jiang, Q. Zhang, L. Dai and Y. Chen, Nat. Nanotechnol., 2014, 9, 555 CrossRef CAS PubMed.
- C. Zhang, W. Lv, Y. Tao and Q. H. Yang, Energy Environ. Sci., 2015, 8, 1390 RSC.
- P. Cheng, S. Gao, P. Zang, X. Yang, Y. Bai, H. Xu, Z. Liu and Z. Lei, Carbon, 2015, 93, 315 CrossRef CAS.
- A. G. Sokol, Y. N. Pal'yanov, G. A. Pal'yanova, A. F. Khokhryakov and Y. M. Borzdov, Diamond Relat. Mater., 2001, 10, 2131 CrossRef CAS.
- Z. Chen, Y. Gu, L. Hu, W. Xiao, X. Mao, H. Zhu and D. Wang, J. Mater. Chem. A, 2017, 5, 20603 RSC.
- H. V. Ijije, R. C. Lawrence and G. Z. Chen, RSC Adv., 2014, 4, 35808 RSC.
- J. Ge, S. Wang, L. Hu, J. Zhu and S. Jiao, Carbon, 2016, 98, 649 CrossRef CAS.
- L. Hu, Y. Song, J. Ge, J. Zhu, Z. Han and S. Jiao, J. Mater. Chem. A, 2017, 5, 6219 RSC.
- L. Hu, Y. Song, J. Ge, J. Zhu and S. Jiao, J. Mater. Chem. A, 2015, 3, 21211 RSC.
- L. Hu, Y. Song, S. Jiao, Y. Liu, J. Ge, H. Jiao, J. Zhu, J. Wang, H. Zhu and D. J. Fray, ChemSusChem, 2016, 9, 588 CrossRef CAS.
- B. Deng, X. Mao, W. Xiao and D. Wang, J. Mater. Chem. A, 2017, 5, 12822 RSC.
- H. Yin, X. Mao, D. Tang, W. Xiao, L. Xing, H. Zhu, D. Wang and D. R. Sadoway, Energy Environ. Sci., 2013, 6, 1538 RSC.
- J. Ren, F. F. Li, J. Lau, L. González Urbina and S. Licht, Nano Lett., 2015, 15, 6142 CrossRef CAS PubMed.
- A. Douglas, R. Carter, N. Muralidharan, L. Oakes and C. L. Pint, Carbon, 2017, 116, 572 CrossRef CAS.
- A. Douglas and C. L. Pint, ECS J. Solid State Sci. Technol., 2017, 6, M3084 CrossRef CAS.
- I. A. Novoselova, S. V. Kuleshov, S. V. Volkov and V. N. Bykov, Electrochim. Acta, 2016, 211, 343 CrossRef CAS.
- Y. L. Qiu, H. X. Zhong, T. T. Zhang, W. B. Xu, X. F. Li and H. M. Zhang, ACS Catal., 2017, 7, 6302 CrossRef CAS.
- P. Gyftou, M. Stroumbouli, E. A. Pavlatou and N. Spyrellis, Trans. IMF, 2002, 80, 88 CrossRef CAS.
- J. Ge, Z. Han, J. Zhu and S. Jiao, J. Electrochem. Soc., 2017, 164, D248 CrossRef CAS.
- S. Liu, Y. Cai, X. Zhao, Y. Liang, M. Zheng, H. Hu, H. Dong, S. Jiang, Y. Liu and Y. Xiao, J. Power Sources, 2017, 360, 373 CrossRef CAS.
- M. S. Dresselhaus, G. Dresselhaus, R. Saito and A. Jorio, Phys. Rep., 2005, 409, 47 CrossRef.
- J. Ge, J. Wang, J. Cheng and S. Jiao, J. Electrochem. Soc., 2016, 163, E230 CrossRef CAS.
Footnote |
| † Electronic supplementary information (ESI) available: Supporting information and chemical compound information are available in the online version of the paper. See DOI: 10.1039/c8ra10560j |
| This journal is © The Royal Society of Chemistry 2019 |

