 Open Access Article
A citric acid-assisted deposition strategy to synthesize mesoporous SiO2-confined highly dispersed LaMnO3 perovskite nanoparticles for n-butylamine catalytic oxidation†
Huawei
Chen‡
,
Yanran
Yang‡
,
Qing
Liu
,
Mifen
Cui
,
Xian
Chen
,
Zhaoyang
Fei
 *,
Zuliang
Tao
,
Minghong
Wang
and
Xu
Qiao
*
State Key Laboratory of Materials-Oriented Chemical Engineering, College of Chemical Engineering, Nanjing Tech University, Nanjing 210009, PR China. E-mail: zhaoyangfei@njtech.edu.cn; qct@njtech.edu.cn; Fax: +86 25 83587168; Fax: +86 25 83172298; Tel: +86 25 83587168 Tel: +86 25 83172298
First published on 14th March 2019
Abstract
Catalytic oxidation can efficiently eliminate nitrogen-containing volatile organic compounds (NVOCs) and suppress the generation of toxic NOx in order to avoid secondary pollution. In this study, mesoporous SiO2-confined LaMnO3 perovskite nanoparticles with high dispersion were successfully prepared by a citric acid-assisted deposition method (LMO/SiO2-SD) and tested for the oxidation of n-butylamine. The method utilized the synergistic effect of abundant active hydroxyl groups existing on the SiO2 gel surface and citric acid, rendering the metal ions more uniformly scattered on the SiO2 surface. Strikingly, the LMO/SiO2-SD sample exhibited the optimum catalytic performance (T90 at 246 °C) and the highest N2 selectivity, which was mainly ascribed to its abundant surface acid sites, superior low-temperature reducibility and higher ratio of surface Mn4+ species. The apparent activation energy (Ea) for n-butylamine oxidation over LMO/SiO2-SD sample was 29.0 kJ mol−1. Furthermore, the reaction mechanism of n-butylamine oxidation was investigated by in situ FITR and a reasonable reaction route for n-butylamine oxidation over the LMO/SiO2-SD sample was proposed.
1 Introduction
Nitrogen-containing volatile organic compounds (NVOCs) have caused serious impacts on air pollution and public health, and have being a focus of attention in the field of air pollution prevention and treatment. The varied sources and varieties of NVOCs lead to disparate degrees of influence due to their different toxic, mutagenic and carcinogenic properties. Examples are amines, nitro compounds, nitrile and so on, which are odorous, highly toxic and would cause NOx secondary pollution and other problems by improper disposal.1–5 Compared to various developed technologies for NVOCs elimination,6 the catalytic oxidation method has always been judged as a highly efficient and promising alternative technology due to its superior advantages, such as lower temperature, lower energy consumption, no secondary pollution and so on. Within this eco-friendly method, NVOCs would be utterly decomposed into CO2, H2O and N2 at a relatively low reaction temperature. In addition, the yield of toxic product NOx would be strictly controlled in order to avoid secondary pollution.With regard to the catalysts applied to NVOCs oxidation, precious metal (Pd, Ag, etc.) and transition metal (Cr, Mn, etc.) catalysts are commonly investigated by researchers due to their optimum catalytic performances.5–7 Although noble metal catalysts exhibited superior catalytic activities, toxicity resistance and better regeneration, their expensive cost, poor high thermal stability and scarce resources limit the large-scale application in industrial production. Perovskite-type metal oxides have always been considered as an alternative for noble metal catalysts due to their unique catalytic performances and good thermal stability for catalytic oxidation of VOCs.8–12 The application of conventional perovskites in catalytic oxidation were nonetheless currently limited due to low specific surface area and serious accumulation due to calcination of precursor material at high temperature. To improve the catalytic performances of perovskites, enormous methods were introduced, such as fabricating three-dimensionally ordered macroporous structure by PMMA-templating approach; dispersing nano-sized perovskites onto metal oxides support with larger specific surface area and so on.13–16 Numerous articles have substantiated that the supported nanoscale perovskites would enhance catalytic performances, but the supported perovskites prepared by conventional methods were poorly dispersed and crystallized, which would have an influence on stability and catalytic performances.17–19 The above triggered our interesting in the study of optimization of perovskite catalysts. In this work, mesoporous SiO2-confined perovskite nanoparticles with high dispersion was prepared by a novel avenue (citric acid-assisted deposition method). The figure shown in Scheme 1 depicts the facile preparation of the mesoporous SiO2 support and the ensuing synthesis of the LMO/SiO2-SD catalyst. The TEOS was firstly hydrolyzed to form SiO2 gel, and subsequently citric acid was coated on the surface of SiO2 gel. Ultimately, the synergistic effect of abundant active hydroxyl groups existed on SiO2 gel surface and citric acid, rendering the metal ions better and uniformly scattered on the SiO2 surface. As a contrast, LMO/SiO2 samples were also prepared by conventional citrate complexation impregnation and wetness impregnation methods, respectively. Catalytic performances were measured using the conversion of n-butylamine as a probe reaction for NVOCs abatement. Moreover, amounts of characterization techniques containing XRD, SEM, TEM, N2 sorption, NH3-TPD, H2-TPR, O2-TPD, XPS and in situ FTIR were employed to establish a constructive relationship between physicochemical properties and catalytic performances. Finally, a possible and reasonable catalytic reaction mechanism for n-butylamine oxidation was proposed.
2 Experimental
2.1 Catalyst preparation
2.2 Catalyst characterization
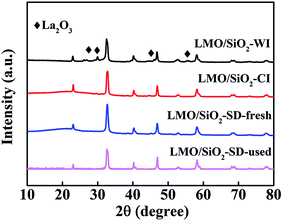
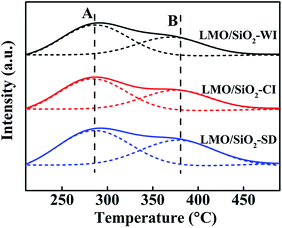
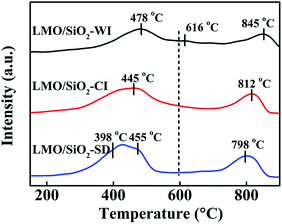
X-ray diffraction (XRD) patterns were recorded on a SmartLab X-ray Diffractometer (Rigaku Corporation, Japan) equipped with Cu Kα radiation (λ = 0.1541 nm) within 2θ range of 10–80° at the scanning step of 0.02°. Scanning electron microscopy (SEM) images were analyzed with a Hitachi S-3000 N scanning electron microscope. The high resolution TEM images (HRTEM) were recorded using a JEOL JEM-2100 electron microscope. The nitrogen adsorption and desorption isotherms were carried out on BEL SORP II apparatus. Before adsorption, all LMO/SiO2 samples were outgassed in vacuum at 200 °C. The surface area was determined by the BET theory and the pore size was calculated by the BJH method. Temperature-programmed desorption of NH3 (NH3-TPD) was investigated by AutoChemII 2920 apparatus. Prior to each test, the catalyst (50 mg, 40–60 meshes) was pretreated under high purified He at 200 °C for 1 h, then cooled down to 50 °C, and turned the flow of 10 vol% NH3/He into the system with a flow rate of 30 mL min−1 for 1 h. After that, the catalyst was flushed with He to remove physically adsorbed NH3 on the catalyst surface. Finally, the system was heated to 500 °C at a heating rate of 10 °C min−1, and the desorption profiles were recorded under He flow. Temperature-programmed reduction of H2 (H2-TPR) was carried on the same instrument. Firstly, the catalysts were pretreated under Ar flow at 200 °C for 1 h. Then the temperature was cooled to 50 °C, the catalyst was heated from 50 °C to 900 °C under 10 vol% H2/Ar flow. The consumption of H2 was detected by thermal conductivity detector (TSD). Temperature programmed desorption of O2 (O2-TPD) experiment was also determined by AutoChemII 2920 analyzer. After pretreated 50 mg of catalyst at 200 °C for 1 h under He flow, the sample was exposed to 4 vol% O2/He at 50 °C for 1 h. After the catalyst was purged with helium until stabilization of the instrument baseline, the sample was heated (10 °C min−1) to 800 °C. The amount of desorbed ammonia was measured using a thermal conductivity detector (TSD). The X-ray photoelectron spectroscopy (XPS) spectra were performed using a PHI 5000 Versa Probe high performance electron spectrometer. All binding energies (BE) were calibrated using C 1s (BE = 284.8 eV) as a standard.2.3 In situ FTIR studies
In situ FTIR spectra were recorded by IS50 infrared spectrometer equipped with an in situ diffuse reflectance pool containing CaF2 window and MCT detector. The real reaction temperature was controlled by the programmed temperature controller precisely. All spectra were recorded by accumulating 32 scans at a spectra resolution of 4 cm−1. Prior to data collection, the catalyst would be pretreated with 20 vol% O2/He at 300 °C for 1 h in order to remove the contaminants and then cooled down to 50 °C. In this process, spectra of the fresh catalyst surface were collected per 50 °C and employed as the background. Reaction was carried out by exposing catalyst to a stream of flow composed of 1000 ppm n-butylamine, 20% O2 and He as balance gas. In situ FTIR spectra were collected from 50 to 300 °C for every 50 °C where a steady state was reached.2.4 Catalytic evaluation
The measurements of catalytic activities were carried out in a fixed bed quartz reactor at atmospheric pressure for the complete oxidation of n-butylamine. Quantitative catalyst (1.0 g, 16–40 mesh) was diluted with 1.0 g of quartz sands and positioned at the middle of the fixed bed quartz reactor. For the measurements of catalytic performances, the total gas flow was kept at 250 mL min−1, and concentrations of the feed components were controlled as follows: 1000 ppm n-butylamine + 20% O2 + He (balance). The reactants and products were analyzed by VARIO industrial flue gas analyzer (MRU Corporation, Germany) and an on-line GC equipped with FID detector. The n-butylamine conversion (xNVOCs) and the selectivity of N2 (SN2) were defined, respectively, as:| xNVOCs = (cin − cout)/cin × 100%; |
| SN2 = YN2/xNVOCs × 100% |
3 Results and discussion
3.1 Catalyst characterization
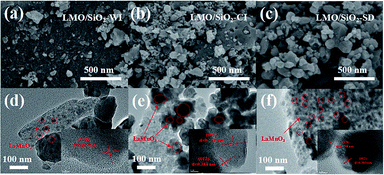 | ||
| Fig. 2 SEM and TEM images of LMO/SiO2-WI (a and d), LMO/SiO2-CI (b and e) and LMO/SiO2-SD (c and f). | ||
TEM characterization was conducted out to study the structure for all LMO/SiO2 samples. In Fig. 2(d–f), LaMnO3 perovskite was deposited onto the SiO2 support as larger nanoparticles of 15–30 nm diameters, which was similar microtopography to SEM results. The observed 0.387 nm, 0.221 nm and 0.234 nm lattice fringe were ascribed to the (012), (006) and (113) crystallographic planes of LaMnO3 (PDF 50-0299), respectively. This result was in good accordance with the XRD results of LMO/SiO2 samples. It could be explicitly from all samples that the layered sheet-like structures assigned to LaMnO3 was decorated by the black spots. When the LMO/SiO2 sample was prepared by citric acid-assisted deposition method, the black spots covered the surface of SiO2 homogeneously. On the contrary, the black spots existed on the LMO/SiO2-WI and LMO/SiO2-CI samples obviously exhibited the pulverous aggregation and accumulation.
| Catalysts | SSAa (m2 g−1) | V p b (cm3 g−1) | D p b (nm) | Acid amount (mmol gcat−1) | H2 consumption (mmol gcat−1) | O2 desorption (mmol gcat−1) | ||||
|---|---|---|---|---|---|---|---|---|---|---|
| A | B | 1st peak | 2nd peak | 3rd peak | Oα | Oβ | ||||
| a SSA: calculated by BET method. b Vp and Dp: obtained by BJH method. | ||||||||||
| LMO/SiO2-WI | 300 | 0.39 | 5.03 | 0.038 | 0.019 | 0.202 | 0.052 | 0.120 | 0.228 | 0.121 |
| LMO/SiO2-CI | 205 | 0.31 | 4.02 | 0.039 | 0.022 | 0.347 | 0.249 | — | 0.096 | 0.125 |
| LMO/SiO2-SD | 253 | 0.36 | 4.31 | 0.042 | 0.027 | 0.254 | 0.196 | 0.259 | 0.122 | 0.137 |
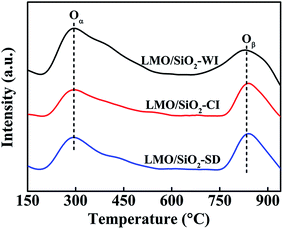
O2-TPD measurements were performed in order to investigate the surface and bulk oxygen species as well as their mobility of the perovskite oxides and corresponding oxygen desorption curves of LMO/SiO2 samples were depicted in Fig. 5. Apparently, all LMO/SiO2 samples showed two main oxygen desorption regions. The first region (Oα) ranging from 200 to 550 °C could be attributed to the surface adsorbed molecular oxygen and/or oxygen species migrating via surface oxygen vacancies, which mainly related to the physical and chemical properties of B-site metal.20,29,30 Another region ranging from 750–900 °C could be assigned to the desorption of lattice oxygen, denoted as Oβ,31–33 which mainly related to the ability of B-site metal ions to be reduced. Strikingly, the LMO/SiO2-SD sample exhibited the lowest peak-temperature of desorption peaks, indicating its better oxygen mobility. The corresponding oxygen desorption amounts were further analyzed by quantitative integration of O2-TPD curve (Table 1). The desorption amounts of LMO/SiO2-SD sample were 0.122 and 0.137 mmol gcat−1, respectively, which were remarkably higher than that of LMO/SiO2-CI samples (0.096 and 0.125 mmol gcat−1).
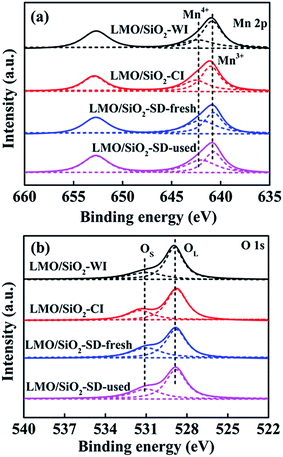
As previously reported,41,42 the surface chemisorbed oxygen (OS) species were more active than the lattice oxygen (OL) species due to their higher mobility, therefore OS species played a more important role in catalytic oxidation reaction. It can be seen from Fig. 6(b), the O 1s peak could be split into two peaks: surface chemisorbed oxygen (531.2 ± 0.2 eV, denoted as OS) and lattice oxygen (529.0 ± 0.2 eV, denoted as OL).39,40 The OS/(OS + OL) ratios of all LMO/SiO2 samples were calculated by quantitative analysis of the corresponding characteristic peaks of OS and OL, the OS/(OS + OL) ratio of LMO/SiO2-SD sample calculated from deconvoluted O 1s XPS spectrum was 38.72%, which was larger than that of LMO/SiO2-CI (32.16%) and LMO/SiO2-WI (27.74%) samples. Further investigating the H2-TPR, O2-TPD and XPS results, higher ratio of surface Mn4+ species and luxuriant OS species of LMO/SiO2-SD sample could be attributed to the synergic effect of the citric acid-assisted deposition method, which can contribute to the conspicuous low temperature redox capability and better surface oxygen mobility.
3.2 Catalytic evaluation
The catalytic performances of all LMO/SiO2 samples for n-butylamine oxidation were tested within the temperature range from 50 to 400 °C (Fig. 7). Apparently, the conversion of n-butylamine showed a monotonic increasing tendency with the increase of reaction temperature, and a complete conversion of n-butylamine could be ultimately achieved below 400 °C over all LMO/SiO2 samples. The sequence in terms of catalytic performance over LMO/SiO2 samples followed by LMO/SiO2-SD > LMO/SiO2-CI > LMO/SiO2-WI, revealing that SD method can be capable of improving the catalytic performance for the complete oxidation of n-butylamine. T10, T50 and T90 (representing the temperature at 10%, 50% and 90% n-butylamine conversion) were respectively listed in Table 2. Among all LMO/SiO2 samples, LMO/SiO2-SD sample displayed the optimum catalytic oxidation performance for n-butylamine with the T10, T50 and T90 values of 95, 188 and 246 °C, respectively, which were lower than that of LMO/SiO2-CI (116, 206 and 273 °C) and LMO/SiO2-WI (146, 230 and 305 °C) samples.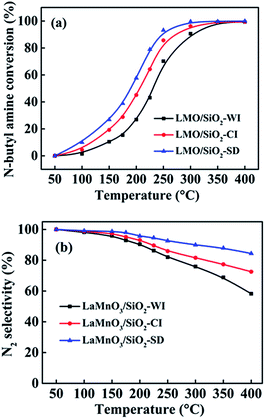 | ||
| Fig. 7 Catalytic oxidation performances of n-butylamine over LMO/SiO2 catalysts: (a) n-butylamine conversion (b) N2 selectivity. | ||
To deeply explore the n-butylamine catalytic oxidation reaction, a comprehensive identification of reaction products was carried out. At 400 °C or above, n-butylamine was entirely disintegrated into CO2, N2, NOx and so on. As shown in Fig. 7(b), the results of N2 selectivity over LMO/SiO2 samples were observed and LMO/SiO2-SD sample displayed the highest N2 selectivity. With the reaction temperature increasing, the N2 selectivity over all LMO/SiO2 samples showed an obvious decline, which could be ascribed to the more products of NOx at higher temperature. Moreover, to highlight the optimum catalytic performance of LMO/SiO2-SD sample for n-butylamine catalytic oxidation, their activities were compared based on specific activity (R). It was found that LMO/SiO2-SD sample possessed higher specific activity (6.85 × 10⁻⁷ mmol m−2 s−1), indicating that more active sites existed on the unit specific surface area of sample. Based on the catalytic performances and characterization results, one can find that LMO/SiO2-SD sample showed the optimum catalytic performance, which was assigned to its better dispersity, abundant surface acid sites, superior low-temperature reducibility, high ratio of surface Mn4+ species and more available surface adsorbed oxygen species. Among them, acid sites of LMO/SiO2-SD sample played an essential role in reaction. By which, n-butylamine could be adsorbed efficiently and gone through further oxidation.
The apparent activation energy (Ea) for n-butylamine oxidation over all LMO/SiO2 samples with a first-order Arrhenius equation: r = −kc = (−A![[thin space (1/6-em)]](https://www.rsc.org/images/entities/char_2009.gif) exp(−Ea/RT))c, in which r, k, A, Ea represent the reaction rate (mol s−1), the rate constant (s−1), the pre-exponential factor and the apparent activation energy (kJ mol−1), respectively.36–38 The Arrhenius plots for n-butylamine catalytic oxidation over all the LMO/SiO2 samples showed well-line relationship (Fig. S2†). In addition, the Ea value values were calculated and summarized in Table 2. As listed in Table 2, the sequence of Ea values followed by LMO/SiO2-SD (29 kJ mol−1) < LMO/SiO2-CI (32.5 kJ mol−1) < LMO/SiO2-WI (34.7 kJ mol−1), suggesting that LMO/SiO2-SD sample was beneficial to the proceeding of n-butylamine catalytic oxidation, which was in good accordance with its excellent catalytic performance.
exp(−Ea/RT))c, in which r, k, A, Ea represent the reaction rate (mol s−1), the rate constant (s−1), the pre-exponential factor and the apparent activation energy (kJ mol−1), respectively.36–38 The Arrhenius plots for n-butylamine catalytic oxidation over all the LMO/SiO2 samples showed well-line relationship (Fig. S2†). In addition, the Ea value values were calculated and summarized in Table 2. As listed in Table 2, the sequence of Ea values followed by LMO/SiO2-SD (29 kJ mol−1) < LMO/SiO2-CI (32.5 kJ mol−1) < LMO/SiO2-WI (34.7 kJ mol−1), suggesting that LMO/SiO2-SD sample was beneficial to the proceeding of n-butylamine catalytic oxidation, which was in good accordance with its excellent catalytic performance.
In the literature reported previously,5,6,21 the temperature of n-butylamine complete conversion over the reported catalysts was about 280 °C. Apparently, the conversion of n-butylamine over the LMO/SiO2-SD catalyst showed a monotonic increasing tendency with the increase of reaction temperature, and the temperature of n-butylamine complete conversion was similar to other reported catalysts. Moreover, the conversion of LMO/SiO2-SD and reported catalysts showed no noticeable fluctuation with the increase of reaction temperature, which indicated that the LMO/SiO2-SD catalyst in this study had an advantage in catalytic oxidation of n-butylamine.
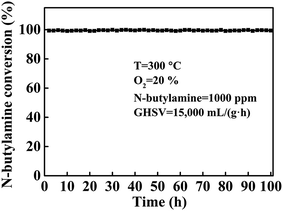
To assess catalyst fatigue, the stability of LMO/SiO2-SD has been studied. A durability test for the oxidation of n-butylamine over catalyst LMO/SiO2-SD was carried out for 100 h at the reaction temperature of 300 °C, and the curves of n-butylamine conversion versus the time on stream was shown in Fig. 8. Obviously, complete conversion of n-butylamine was always observed during the entire reaction time and no deactivation was observed, indicating that the LMO/SiO2-SD sample showed the stable catalytic performance of n-butylamine. To investigate the fate of the catalyst after reaction, the XRD and XPS analyses of the LMO/SiO2-SD catalyst after stability test were further carried out. From Fig. 1, the XRD analysis revealed that no phase transformations were observed, indicating its superior structural stability. Meanwhile, the XPS result (Table S1†) showed that the used LMO/SiO2-SD catalyst displayed the similar atomic concentrations to the fresh catalyst, and the chemical states of major elements only showed a slightly drop than that of the fresh catalyst, which was in good accordance with the XRD result. All of the above characterization results demonstrated that the LMO/SiO2-SD catalyst possessed the excellent stability.
3.3 In situ FTIR
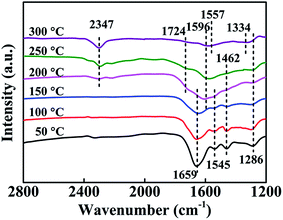
To further investigate reaction mechanism of n-butylamine catalytic oxidation over all LMO/SiO2 samples, we employed in situ FITR under 1000 ppm n-butylamine, 20% O2 and He conditions to analysis intermediate products at different temperature intervals and established a constructive relationship between samples' physicochemical properties and catalytic performances (Fig. 9). As shown in Fig. 9, when the reaction temperature was 50 °C, the induced n-butylamine adsorbed on the surface of LMO/SiO2-SD sample, and occurred four adsorption peaks. Four intense bands belong to n-butylamine adsorbed over the LMO/SiO2-SD catalyst at 1286 cm−1 (vC–N), 1462 cm−1 (δCH2), 1545 cm−1 (δCH3) and 1659 cm−1 (δN–H) were observed.43–47 However, these adsorption peaks would gradually weakened and vanished during the temperature-programmed surface reaction, and emerged three new intense bands located at 2347 cm−1, 1724 cm−1 and 1596 cm−1, which could be assigned to the formation of CO2, δ(C![[double bond, length as m-dash]](https://www.rsc.org/images/entities/char_e001.gif) O) and NH3 adsorbed on at 2347 cm−1, 1724 cm−1 and 1596 cm−1, which could be assigned to the formation of CO2, δ(C
O) and NH3 adsorbed on at 2347 cm−1, 1724 cm−1 and 1596 cm−1, which could be assigned to the formation of CO2, δ(C![[double bond, length as m-dash]](https://www.rsc.org/images/entities/char_e001.gif) O) and NH3 adsorbed on the sample surface, respectively.39,40 Meanwhile, the relative intensity of CO2 adsorption peak enhanced with the increase of reaction temperature, suggesting the increase of CO2 formation. However, the other two intense bands of δ(C
O) and NH3 adsorbed on the sample surface, respectively.39,40 Meanwhile, the relative intensity of CO2 adsorption peak enhanced with the increase of reaction temperature, suggesting the increase of CO2 formation. However, the other two intense bands of δ(C![[double bond, length as m-dash]](https://www.rsc.org/images/entities/char_e001.gif) O) and NH3 fade away with reaction temperature increasing, which could be ascribed to the generation of CO2, H2O, N2 and so on during the reaction process. When the reaction temperature reached to 300 °C, novel intense bands at 1557 cm−1 and 1334 cm−1 respectively ascribed to bidentate nitrate and cis-N2O22− species were observed, since more formed NOx absorbed on the surface of sample with reaction temperature rising.48,49 The in situ FTIR spectra of other LMO/SiO2-CI and LMO/SiO2-WI samples were similar to that of LMO/SiO2-SD sample (Fig. S3†), merely the adsorption peaks appeared slightly shift.
O) and NH3 fade away with reaction temperature increasing, which could be ascribed to the generation of CO2, H2O, N2 and so on during the reaction process. When the reaction temperature reached to 300 °C, novel intense bands at 1557 cm−1 and 1334 cm−1 respectively ascribed to bidentate nitrate and cis-N2O22− species were observed, since more formed NOx absorbed on the surface of sample with reaction temperature rising.48,49 The in situ FTIR spectra of other LMO/SiO2-CI and LMO/SiO2-WI samples were similar to that of LMO/SiO2-SD sample (Fig. S3†), merely the adsorption peaks appeared slightly shift.
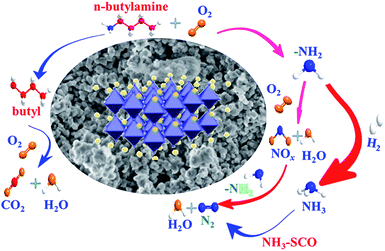
Based on the results of in situ FTIR, the reaction pathway for catalytic oxidation of n-butylamine over LMO/SiO2 samples was proposed, as shown in Scheme 2. There was a condensation route over the all samples: the n-butylamine was firstly induced and adsorbed on the surface of sample, forming the adsorbed n-butylamine, which was consecutively split C–N bond and produced –NH2 and butyl. On the one hand, the –NH2 species over sample might be adsorbed and oxidized to generate NOx, which might be ascribed to the deep oxidation of NH3 in channels of samples.21,22 Subsequently, the formed NOx reacted with another –NH2 to produce non-toxic N2 and H2O. On the other hand, the –NH2 species might also form NH3 via hydrogenation reaction and subsequently generated non-toxic N2 and H2O by means of NH3–SCO. The butyl over the LMO/SiO2-SD sample might be oxidized by active oxidation species to generate intermediate species, and then were oxidized to produce CO2 and H2O terminally.
4 Conclusions
In summary, citric acid-assisted deposition method utilized the synergistic effect of abundant active hydroxyl groups existed on SiO2 gel surface and citric acid to prepare the mesoporous SiO2-confined LaMnO3 perovskite nanoparticles with high dispersion. The LMO/SiO2-SD sample showed the optimum catalytic performance (T90 at 246 °C) and the highest N2 selectivity for n-butylamine oxidation compared with other LMO/SiO2-CI and LMO/SiO2-WI samples, which was mainly assigned to its abundant surface acid sites, superior low-temperature reducibility and high ratio of Mn4+ species. Moreover, acid sites of LMO/SiO2-SD sample played an essential role in reaction. By which, n-butylamine could be adsorbed efficiently and gone through further oxidation. In addition, the LMO/SiO2-SD sample possessed the lowest Ea value (29 kJ mol−1), proving its excellent catalytic activity. In addition, one can find that the LMO/SiO2-SD with high dispersion exhibited advantage in controlling NOx production. Based on analysis, one reason for this phenomenon is that the high dispersion can decrease the reaction temperature and then reduce the NOx production. It is predictable that highly dispersed perovskite nano-catalysts will draw more attentions and play a vital role in catalytic oxidation of NVOCs.Conflicts of interest
There are no conflicts to declare.Acknowledgements
This work was supported by the National Key Research and Development Program (Grant No. 2017YFC0210903), the National Natural Science Foundation of China (Grant No. 21306089), the State Key Laboratory of Materials-Oriented Chemical Engineering (Grant ZK201610, ZK201703), and the Priority Academic Program Development of Jiangsu Higher Education Institutions (PAPD).Notes and references
- Z. Jiang, C. He, N. F. Dummer, J. Shi, M. Tian, C. Ma, Z. Hao, S. H. Taylor, M. Ma and Z. Shen, Appl. Catal., B, 2018, 226, 220–233 CrossRef CAS.
- S. Cimino, S. Colonna, S. De Rossi, M. Faticanti, L. Lisi, I. Pettiti and P. Porta, J. Catal., 2002, 205, 309–317 CrossRef CAS.
- R. Spinicci, M. Faticanti, P. Marini, S. De Rossi and P. Porta, J. Mol. Catal. A: Chem., 2003, 197, 147–155 CrossRef CAS.
- Z.-J. Sui, L. Vradman, I. Reizner, M. V. Landau and M. Herskowitz, Catal. Commun., 2011, 12, 1437–1441 CrossRef CAS.
- M. Ma, H. Huang, C. Chen, Q. Zhu, L. Yue, R. Albilali and C. He, Mol. Catal., 2018, 455, 192–203 CrossRef CAS.
- Z. Shi, Q. Huang, P. Yang and R. Zhou, J. Porous Mater., 2015, 22, 739–747 CrossRef CAS.
- T. Nanba, S. Masukawa, J. Uchisawa and A. Obuchi, J. Catal., 2008, 259, 250–259 CrossRef CAS.
- L. Wang, C. Wang, H. Xie, W. Zhan, Y. Guo and Y. Guo, Catal. Today, 2018, 327, 190–195 CrossRef.
- X. Wang, J. Zuo, Y. Luo and L. Jiang, Appl. Surf. Sci., 2017, 396, 95–101 CrossRef CAS.
- Y. Chai, Y. Fu, H. Feng, W. Kong, C. Yuan, B. Pan, J. Zhang and Y. Sun, ChemCatChem, 2018, 10, 2078–2086 CrossRef CAS.
- J. Chen, M. Shen, X. Wang, J. Wang, Y. Su and Z. Zhao, Catal. Commun., 2013, 37, 105–108 CrossRef CAS.
- C. Zhang, Y. Guo, Y. Guo, G. Lu, A. Boreave, L. Retailleau, A. Baylet and A. Giroir-Fendler, Appl. Catal., B, 2014, 148, 490–498 CrossRef.
- Q. Ding, H. Xian, Y. Tan, N. Tsubakiet and X. Li, Catal. Sci. Technol., 2013, 3, 1493–1496 RSC.
- H. Arandiyan, H. Dai, J. Deng, Y. Wang, H. Sun, S. Xie, B. Bai, Y. Liu, K. Ji and J. Li, J. Phys. Chem. C, 2014, 118, 14913–14928 CrossRef CAS.
- X. Li, H. Dai, J. Deng, Y. Liu, Z. Zhao, Y. Wang, H. Yang and C. Au, Appl. Catal., A, 2013, 458, 11–20 CrossRef CAS.
- R. Lima, M. Batista, M. Wallau, E. Sanches and E. A. Urquieta-González, Appl. Catal., B, 2009, 90, 441–450 CrossRef.
- M. Alifanti, M. Florea and V. I. Parvulescu, Appl. Catal., B, 2007, 70, 400–405 CrossRef CAS.
- J. Zhang, X. Weng, Z. Wu, Y. Liu and H. Wang, Appl. Catal., B, 2012, 126, 231–238 CrossRef CAS.
- J. Deng, L. Zhang, H. Dai and C. Au, Appl. Catal., A, 2009, 352, 43–49 CrossRef CAS.
- C. Zhang, C. Wang, S. Gil, A. Boreave, L. Retailleau, Y. Guo, J. L. Valverde and A. Giroir-Fendler, Appl. Catal., B, 2017, 201, 552–560 CrossRef CAS.
- Q. Huang, S. Zuo and R. Zhou, Appl. Catal., B, 2010, 95, 327–334 CrossRef CAS.
- P. Li, X. Hu, L. Zhang, H. Dai and L. Zhang, Nanoscale, 2011, 3, 974–976 RSC.
- H. Arandiyan, H. Dai, J. Deng, Y. Wang, H. Sun, S. Xie, B. Bai, Y. Liu, K. Ji and J. Li, J. Phys. Chem. C, 2014, 118, 14913–14928 CrossRef CAS.
- Y. Lu, Q. Dai and X. Wang, Catal. Commun., 2014, 54, 114–117 CrossRef CAS.
- Y. Liu, H. Dai, Y. Du, J. Deng, L. Zhang and Z. Zhao, Appl. Catal., B, 2012, 119, 20–31 CrossRef.
- A. Kaddouri, S. Ifrah and P. Gelin, Catal. Lett., 2007, 119, 237–244 CrossRef CAS.
- C. Zhang, C. Wang, W. Zhan, Y. Guo, Y. Guo, G. Lu, A. Baylet and A. Giroir-Fendler, Appl. Catal., B, 2013, 129, 509–516 CrossRef CAS.
- J. Yang, L. Li, X. Yang, S. Song, J. Li, F. Jing and W. Chu, Catal. Today, 2018, 327, 19–27 CrossRef.
- J. Zhu, Z. Zhao, D. Xiao, J. Li, X. Yang and Y. Wu, J. Mol. Catal. A: Chem., 2005, 238, 35–40 CrossRef CAS.
- B. P. Barbero, J. A. Gamboa and L. E. Cadús, Appl. Catal., B, 2006, 65, 21–30 CrossRef CAS.
- H. Ziaei-Azad, A. Khodadadi, P. Esmaeilnejad-Ahranjani and Y. Mortazavi, Appl. Catal., B, 2011, 102, 62–70 CrossRef CAS.
- M. Pena and J. Fierro, Chem. Rev., 2001, 39, 1981–2017 CrossRef.
- J. Quiroz, J.-M. Giraudon, A. Gervasini, C. Dujardin, C. Lancelot, M. Trentesaux and J.-F. Lamonier, ACS Catal., 2015, 5, 2260–2269 CrossRef CAS.
- M. Alifanti, J. Kirchnerova and B. Delmon, Appl. Catal., A, 2003, 245, 231–244 CrossRef CAS.
- R. Hammami, S. B. Aïssa and H. Batis, Appl. Catal., A, 2009, 353, 145–153 CrossRef CAS.
- C. Zhang, C. Wang, W. Hua, Y. Guo, G. Lu, S. Gil and A. Giroir-Fendler, Appl. Catal., B, 2016, 186, 173–183 CrossRef CAS.
- B. Kucharczyk and W. Tylus, Catal. Lett., 2007, 115, 122–132 CrossRef CAS.
- S. Cimino, M. P. Casaletto, L. Lisi and G. Russo, Appl. Catal., A, 2007, 327, 238–246 CrossRef CAS.
- X. Yao, F. Gao, Q. Yu, L. Qi, C. Tang, L. Dong and Y. Chen, Catal. Sci. Technol., 2013, 3, 1355 RSC.
- J. Liu, X. Li, Q. Zhao, J. Ke, H. Xiao, X. Lv, S. Liu, M. Tadé and S. Wang, Appl. Catal., B, 2017, 200, 297–308 CrossRef CAS.
- T. Boningari, P. R. Ettireddy, A. Somogyvari, Y. Liu, A. Vorontsov, C. A. MSDonald and P. G. Smirniotis, J. Catal., 2015, 325, 145–155 CrossRef CAS.
- P. Sun, R.-t. Guo, S.-m. Liu, S.-x. Wang, W.-g. Pan and M.-y. Li, Appl. Catal., A, 2017, 531, 129–138 CrossRef CAS.
- S. Benard, A. Baylet, P. Vernoux, J. L. Valverde and A. Giroir-Fendler, Catal. Commun., 2013, 36, 63–66 CrossRef CAS.
- A. Baylet, C. Capdeillayre, L. Retailleau, J. L. Valverde, P. Vernoux and A. Giroir-Fendler, Appl. Catal., B, 2011, 102, 180–189 CrossRef CAS.
- B. de Rivas, R. López-Fonseca, C. Jiménez-González and J. I. Gutiérrez-Ortiz, Chem. Eng. J., 2012, 184, 184–192 CrossRef CAS.
- Z. Wu, B. Jiang, Y. Liu, H. Wang and R. Jin, Environ. Sci. Technol., 2007, 16, 5812 CrossRef.
- L. Chen, J. Li and M. Ge, Environ. Sci. Technol., 2010, 24, 9590–9596 CrossRef PubMed.
- F. Liu, H. He, Y. Ding and C. Zhang, Appl. Catal., B, 2009, 93, 194–204 CrossRef CAS.
- M. Machida, M. Uto, D. Kurogi and T. Kijima, J. Mater. Chem., 2001, 11, 900–904 RSC.
Footnotes |
| † Electronic supplementary information (ESI) available: Complementary characterisation and catalytic data. See DOI: 10.1039/c8ra10636c |
| ‡ These authors contributed equally to this work. |
| This journal is © The Royal Society of Chemistry 2019 |


