 Open Access Article
Adsorbate enrichment on a zeolite surface and assembly of a SERS sensor: a case study with silver nanoparticles and the flavonoid catechin†
Chia-Chi Huang *,
Chi-Yun Cheng‡
,
Chao-Ting Chou‡ and
Wenlung Chen*
Department of Applied Chemistry, National Chiayi University, No. 300 Syuefu Rd, Chiayi City 60004, Taiwan. E-mail: chiachihuang@mail.ncyu.edu.tw; wlchen@mail.ncyu.edu.tw; Fax: +886-5-2717901; Tel: +886-5-2717967 Tel: +886-5-2717965
First published on 19th February 2019
Abstract
We have studied the adsorption of silver nanoparticles (AgNPs) and catechin on readily available commercial zeolite beads. Both adsorbates became available on the zeolite and were several fold more concentrated after a simple adsorption process, contributing to a 10-times overall increase in the collision probability between the two adsorbates. We were further able to detect AgNP-induced Surface Enhanced Raman Scattering (SERS) of catechin on the zeolite after sequential depositions of AgNPs and catechin on the zeolite using this process. To demonstrate high reproducibility, 93% of the zeolite sensors assembled this way were tested and proved satisfactory, and gave a distinctive catechin SERS signature. Preparation of the zeolite sensor was extremely easy with a nearly 90% yield.
Introduction
Detection of chemicals plays a central role in many industrial processes such as chemical analyses, biomedical sensing, and pollution prevention. As a detection technique, Surface Enhanced Raman Scattering (SERS) spectroscopy has many advantages and is being increasingly applied to chemical sensing.1–9 Having a limit of detection as fine as a single molecule,10,11 SERS is sensitive to a broad range of chemical species – small molecules as well as biological macromolecules. It is compatible with aqueous samples and amenable to both quantitative and qualitative analyses.Two independent mechanisms have been proposed for the enhancement effect in SERS, both involving the interaction between the analyte molecules and a metal substrate such as Au, Ag or Cu nanoparticles (NPs). In electromagnetic enhancement, photon-induced surface plasmon resonance at metal junctions known as hot spots can enhance the signals of a nearby Raman-active molecule up to 1012 folds.12 Chemical enhancement results from charge transfer interactions between chemisorbed molecules and the metal surface, with an enhancement factor ranging from 102 to 104.13,14
We have previously reported the detection of catechin at attomolar concentration using a solution phase SERS technique.15 It became clear to us in this previous study that formation of hot spots and promoting the analyte molecules' chance of adhesion to these hot spots are the determining tasks to achieving successful detection at low analyte concentration. In solution phase, however, access of analyte molecules to the hot spots is not warranted without considerable experimentation due to the complexity of the three-way interactions between the metal substrate, the analyte molecules, and the solvent molecules. This complex dynamics negatively affects the throughput of the detection process and thus the application of SERS technique to day-to-day analyses in industrial processes. A possible solution to this problem is to limit the mutual distribution of analyte molecules and the metal substrate by affixing both substances to a common solid base. One then only has to make sure that the resultant composite is SERS capable. We report herein the results of one of our efforts in this direction.
Zeolites are porous materials with hierarchical structures on a molecular scale. Zeolites with pore sizes ranging from a few to a few hundred Angstroms16,17 have been synthesized in laboratories and on industrial scales for more than half a century. The ability to trap ions and molecules by ion exchange and passive diffusion has supported the applications of zeolites in catalysis and separation. Adsorption of small molecules as well as proteins on zeolites has been studied.18–21 When desired, zeolite surface can be chemically modified for controlled affinities.22–24 These features make zeolites attractive as the base material for making SERS substrates.
To our knowledge, zeolite was last used to fabricate a SERS substrate in 2011 by Zhang,25 which was preceded by only two related reports by Dutta26 and Yan27 respectively. These methods all involved synthesis of zeolites and were meant to show specific means of incorporating silver structures in zeolites. Despite the demonstrated effectiveness, we are not aware of any applications of these methods since their disclosure. This is possibly because these methods are inconvenient to follow in routine chemical analyses where synthesis of the substrate is irrelevant and superfluous. We have developed a protocol that is free from any deliberate complexities. It uses commercial zeolite and home-made AgNPs off the shelf and its functionality is demonstrated with the detection of catechin.
Methods
The following is a highlight of the methods. Please consult the ESI† for complete experimental procedures.Preparation of AgNPs solution
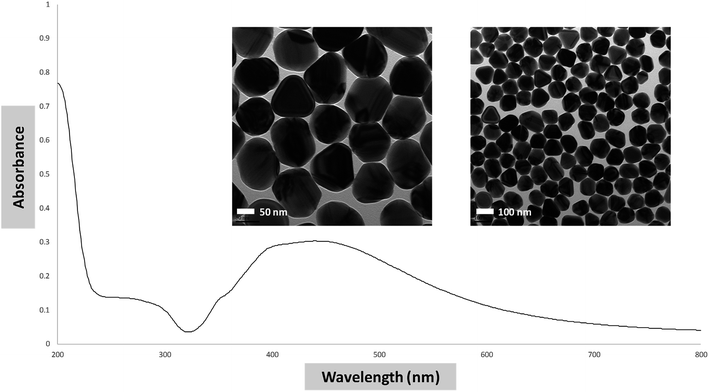
Glasswares were soaked in diluted HNO3 solution, rinsed with deionized ultrapure water, and dried in the oven. Citrate-capped AgNPs solution was prepared immediately before use by a modified Lee–Meisel protocol.28 Specifically, silver nitrate (18 mg) was dissolved in 100 mL of deionized water in a reflux system. After boiling, 2 mL of 1% trisodium citrate solution was added to the silver ion solution. The reflux system was isolated from light and kept at approximately 85 °C for 1.5 h. The resultant solution of citrate-capped AgNPs was stored in a dark glass bottle at 16 °C. UV-vis spectrum and TEM images of a typical preparation are shown in Fig. 1.Preparation of zeolite beads
Commercial zeolite beads were cleansed before use, following a multiple-wash-and-soak procedure in an ultrasonic cleaner (Branson 2510). Zeolite beads were first washed with running water, then soaked in ethanol and acetone, each for 10 minutes. The resultant zeolite beads were drained and dried at 100 °C in the oven overnight. After cooling down in a dried box, the beads were covered with plastic wrap and stored.Preparation of SERS samples on zeolite sensors for reproducibility tests
A pair of stainless steel tweezers was cleaned thoroughly with ethanol and used to pick up zeolite beads in all steps to minimize contamination. Ten zeolite beads were randomly taken from the pool of zeolite prepared in the above and placed in an Eppendorf centrifuge tube.AgNPs solution (300 μL) was added to the tube. The mixture was covered and incubated at rt for 24 h. Catechin solution (0.01 M, 100 μL) and NaCl solution (1 M, 100 μL) were then added, and incubation was continued at rt for 3 h. The liquid was removed with a set of pipettes of decreasing volume to determine the total volume. For each set of experiment, five samples were prepared this way and the volume removed was averaged at 370 μL. Four of the 50 beads prepared accidentally fell off the grip of the tweezers at one point or another during the procedure and were excluded from the subsequent characterization process by confocal Raman.
Characterizations
Absorption spectra of the AgNPs solution were recorded on a U-1800 spectrophotometer (HITACHI, Japan). Transmission electron microscopy (TEM) images of AgNPs were recorded using a JEOL JEM2010 HRTEM system with an accelerating voltage of 200 kV (JEOL, Ltd., Japan). Field Emission Scanning Electron Microscope (FE-SEM) images of zeolite and AgNPs@zeolite were recorded using a JSM-6700F system with an accelerating voltage of 200 kV (JEOL, Ltd., Japan).A micro Raman system equipped with a 532 nm laser (Shanghai DreamLasers Technology, SDL-532-1000T) at 63.2 mW output was employed for study of zeolite treated sequentially with AgNPs and catechin.
A confocal microRaman system (Horiba Jobin-Yvon, France) equipped with a 20 mW/514.5 nm Ar+ laser (Lexel Laser, Fremont, Canada), a 50× objective lens (Olympus, Japan), and TRIAX 550 Jobin Yvon monochromator (1200 gr per mm grating) coupled with a CCD detector was employed in the final Raman/SERS protocol. The Raman scattering light was routed through a 0.2 mm entrance slit and a 0.2 mm exit slit. The instrument was calibrated against a silicon wafer (peak position: 520 cm−1) prior to spectrum collections. Data acquisition conditions for all SERS measurements are as follows: spectral resolution 3.0 cm−1; integral times of 3 seconds and 10× accumulations. All SERS measurements involving zeolite were carried out in solid phase. Room temperature was controlled at 16 °C.
Results and discussion
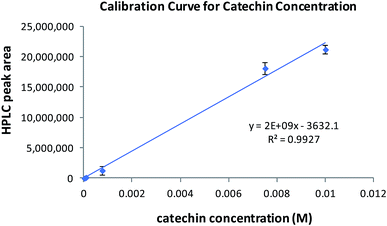
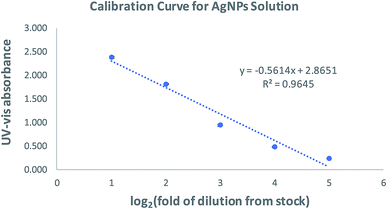
Before SERS applications were studied, we wanted to know the adsorption capacity of zeolite for AgNPs and catechin. We chose to use zeolite beads, instead of powder, because they are properly sized to be individually handled, used, and characterized. The adsorption capacity of zeolite for AgNPs and catechin was determined using a calibration curve established separately for each adsorbate. Five standard catechin solutions were prepared by serial dilutions of a stock solution. The catechin in each standard was quantified using an adapted isocratic HPLC method originally reported by Wen.29 The calibration curve was constructed by plotting the peak area against each catechin concentration. Linear regression of the plot gave its slope and y-intercept as shown in Fig. 2. As the concentration of AgNPs cannot be readily determined, the calibration curve for AgNPs (Fig. 3) was constructed by plotting the UV-vis absorbance over 432–442 nm of five standard AgNPs solutions against the logarithm of each standard's “fold of dilution from the stock”. The same catechin and AgNPs stock solutions were also used in the adsorption experiments.The adsorption of AgNPs and/or catechin in these experiments was carried out by soaking ten zeolite beads in the adsorbate solutions at ambient temperature for 24 and 3 hours respectively. The remnant adsorbate solution upon completion of the process and after removal of the zeolite beads was subjected to volume measurement and UV-vis/HPLC quantifications. The concentration, or fold of dilution in the case of AgNPs, was then determined using the equations in Fig. 2 and 3 respectively. This was used to figure out the amount of adsorbate left behind in the solution. The difference between the beginning and remnant amount of adsorbate was considered the amount of adsorbate picked up by the zeolite beads. Once the amount of adsorbate was determined, the on-bead adsorbate concentration, or the fold of dilution with AgNPs, was calculated using, as the distribution volume on zeolite, the volume of adsorbate solution lost during the soaking process. We then were able to estimate the solution-to-on-bead change in adsorbate concentration. A set of typical results is shown in Tables 1 and 2.
| conc., AgNPs sln | bgng vol, AgNPs sln (μL) | abgng fold of dilution, AgNPs sln | rmnt vol, AgNPs sln (μL) | armnt fold of dilution, AgNPs sln | bgng qty, AgNPs | rmnt qty, AgNPs | qty change, AgNPs | conc. change (fold) |
|---|---|---|---|---|---|---|---|---|
| a Based on calibration curve (Fig. 3), expressed as fold of dilution from the stock. Abbreviations: bgng = beginning, rmnt = remnant, vol = volume, sln = solution, qty = quantity, conc. = concentration. | ||||||||
| a | b | c | d | e | f = a × b/c | g = a × d/e | h = (f − g)/f | i = h × b/(b − d) |
| a | 300 | 10.86 | 214 | 31.78 | 27.62a | 6.73a | 0.76 | 2.65 |
| a | 300 | 10.86 | 213 | 31.10 | 27.62a | 6.85a | 0.75 | 2.59 |
| a | 300 | 10.86 | 208 | 33.33 | 27.62a | 6.24a | 0.77 | 2.51 |
| Type of zeolite | bgng vol, catechin sln (L) | bbgng conc., catechin sln (M) | rmnt vol, catechin sln (L) | brmnt conc., catechin sln (M) | On-bead qty of catechin (mole) | On-bead catechin conc. (M) | Catechin conc. change (fold) |
|---|---|---|---|---|---|---|---|
| a | b | c | d | e = (a × b − c × d) | f = e/(a − c) | g = f/b | |
| a Abbreviations: bgng = beginning, rmnt = remnant, vol = volume, sln = solution, qty = quantity, conc. = concentration.b Based on calibration curve (Fig. 2).c Soaked in catechin once by the standard procedure and dried at rt.d Pre-treated with AgNPs sln as in Table 1.e Mixture with 0.2 M NaCl. | |||||||
| Virgin | 5.00 × 10⁻⁴ | 2.31 × 10⁻³ | 3.80 × 10⁻⁴ | 1.88 × 10⁻³ | 4.41 × 10⁻⁷ | 3.68 × 10⁻³ | 1.59 |
| Virgin | 5.00 × 10⁻⁴ | 2.31 × 10⁻³ | 4.00 × 10⁻⁴ | 1.75 × 10⁻³ | 4.55 × 10⁻⁷ | 4.55 × 10⁻³ | 1.97 |
| cCatechin-soaked | 5.00 × 10⁻⁴ | 2.31 × 10⁻³ | 4.00 × 10⁻⁴ | 2.16 × 10⁻³ | 2.91 × 10⁻⁷ | 2.91 × 10⁻³ | 1.26 |
| cCatechin-soaked | 5.00 × 10⁻⁴ | 2.31 × 10⁻³ | 4.00 × 10⁻⁴ | 2.24 × 10⁻³ | 2.59 × 10⁻⁷ | 2.59 × 10⁻³ | 1.12 |
| dAgNPs-coated | 5.00 × 10⁻⁴ | 2.25 × 10⁻³ | 4.50 × 10⁻⁴ | 1.43 × 10⁻³ | 4.82 × 10⁻⁷ | 9.64 × 10⁻³ | 4.28 |
| dAgNPs-coated | e5.00 × 10−4 | 2.22 × 10⁻³ | 4.67 × 10⁻⁴ | 1.57 × 10⁻³ | 3.77 × 10⁻⁷ | 11.42 × 10⁻³ | 5.14 |
Under SEM, the zeolite beads used in this study had an appearance similar to the lunar surface (Fig. S3a†), with interwoven concave and convex (Fig. S3b†). After incubation with AgNPs solution, patches of glitter in micron size resembling extended silver spots emerged, covering some of the uneven zeolite surface (Fig. S3c and S3d†). The relocation of AgNPs from the solution to zeolite surface was also evidenced by decreased AgNPs concentration in the remains of the AgNPs solution. This was shown as value e in Table 1. The resultant nominal on-bead concentration of AgNPs was estimated to be greater than twice the concentration of the beginning solution (see value i).
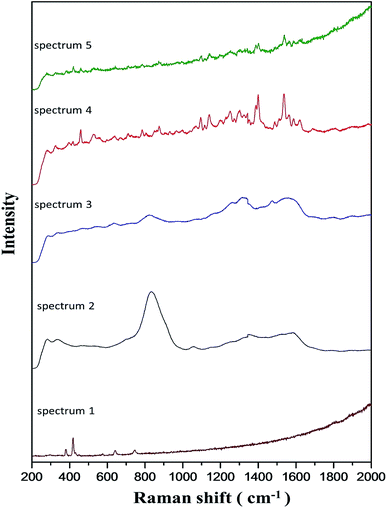
A similar enrichment effect was observed with catechin solution. Shown in Table 2 is a set of results generated by static soaking of zeolite in catechin solutions. With agitated soaking, the nominal on-bead concentration of catechin could exceed 3 times the concentration of the beginning solution. Mechanical agitation can sometimes damage the zeolite beads and must be used with precaution. Catechin adsorption was cumulative as demonstrated with beads that had already been treated with catechin solution once. After drying at ambient temperature for one hour, these beads were put back into the solution. Data in the “catechin-soaked” rows in Table 2 indicated that the enriching effect persisted, albeit to a lesser extent than the first time. The enrichment of catechin appeared to be enhanced by pre-coating the zeolite beads with AgNPs, and much more so when the adsorption of catechin was done in the presence of 0.2 M NaCl. This is shown in the last two rows in Table 2. Combining the enrichment effects for AgNPs and catechin, the chance of contact between the analyte and SERS substrate was raised approximately 10 times compared to solution phase detection. The zeolite beads resulted from these catechin treatments were used in the subsequent Raman measurements and the spectra are shown in Fig. 4.
Zeolite did not give appreciable Raman signals by itself (spectrum 1). With AgNPs-impregnated zeolite beads (spectrum 2), a strong and broad band at 835 cm−1 was detected, together with other unresolved signals between 1200 and 1700 cm−1. This is reminiscent of the Ag2Se quantum dots-induced SERS of F9-NaX zeolite reported recently by Cortez-Valadez.30 The peak at 835 cm−1 was reduced in spectrum 3. The data in Table 2 clearly indicated the presence of catechin on the beads used to generate this spectrum. However, no characteristic Raman signals of catechin were detected. It would seem that the on-bead AgNPs was dulled for surface enhancement, or that the interaction between catechin and AgNPs was ineffective. Chloride ion has been used to activate SERS on AgNPs and roughened Ag electrodes.31 Somehow in line with these precedents, we were able to record distinct Raman signals of catechin (spectrum 4) when the coating of catechin was applied in the presence of 0.2 M NaCl. With this, the Raman signature of catechin was still well-defined at 20× dilution (spectrum 5). It should be noted that many of these previous reports about chloride effects were based on dye analytes that have a permanent positive charge. Since catechin was not likely charged under our experiment conditions, the NaCl effect we observed cannot be unmistakably attributed to the same mechanism suggested in the literature. Another possible cause for SERS activation in this case is chloride-induced etching of AgNPs which has been used to sculpture silver nanomaterials.32–34 Chloride induced etching of on-bead AgNPs, if indeed occurred, might lead to gaps and crevices that function as SERS hot spots.
At this point, we were ready to establish a protocol for routine use of the method. Several improvements were put in place. A confocal component was added to the spectrometer so we could aim the laser with more precision. A 514 nm laser at lower output power replaced the original 531 nm laser. Finally, adsorptions of AgNPs and catechin–NaCl were incorporated into one pot (see experimental) to make the operation extremely fluid. A comparison of the confocal Raman/SERS spectra of zeolite, catechin–zeolite, and catechin–AgNPs–zeolite is shown in Fig. 5. As seen in Fig. 5c, the majority of Raman signals of zeolite were located from 300 to 700 cm−1. Adsorption of catechin molecules on zeolite was evidenced by the emerging Raman scattering of catechin in Fig. 5b, which was highly obscured by its own fluorescence. Compared to this, Fig. 5a shows that the Raman signals of catechin were decidedly enhanced in the presence of on-bead AgNPs. Equally obvious in this spectrum is the quenching of catechin fluorescence. The SERS intensity of Ag–O band (around 200 cm−1) was another indication of positive catechin–AgNP interaction.
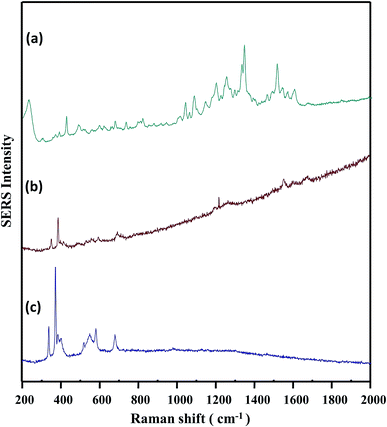 | ||
| Fig. 5 Comparison of confocal SERS and Raman spectra: (a) SERS spectrum of catechin on zeolite sensor, (b) Raman spectrum of catechin on bare zeolite, (c) Raman spectrum of bare zeolite. | ||
Glass and mica are popular silicate materials for making solid state SERS substrates. Typically, AgNPs are immobilized on these rigid supports via chemically installed silane tethers.35 As shown in Fig. S4a and S4b† respectively, simultaneous deposition of AgNPs and catechin on unmodified glass or mica was inadequate for the detection of catechin by Raman spectroscopy. In great contrast, zeolite without any structure augmentations proved fulfilling (Fig. S4c†).
In addition to sensor efficacy, the reproducibility and quality of SERS signals were examined. A total of 46 zeolite sensor beads were tested with 2 × 10⁻³ M catechin solution by this protocol, and only two beads failed to give satisfactory SERS. Three SERS sensor beads were burned out during laser excitation. Unlike liquid samples, solid Raman samples are often destructed under laser excitation. Possibly benefiting from zeolite's capacity to retain water, which helped to dissipate heat, 93% of the SERS sensors were able to maintain their structural integrity under strong laser energy. Overall, the yield of SERS sensor based on the quality of SERS signature referenced to catechin was nearly 90%. To show the reproducibility, the SERS spectra of catechin on ten randomly picked beads are compared in Fig. S5.†
Conclusions
Deposition of AgNPs and catechin on zeolite was achieved simply by soaking zeolite beads in the respective solutions. The soaking process significantly increased the available concentration of the adsorbates for chemical analysis. This enrichment effect was cumulative, allowing repetitive adsorptions of catechin or sequential adsorptions of AgNPs and catechin. Zeolite beads decorated with AgNPs by this soaking process was rendered SERS active in the presence of NaCl, presumably by the etching effect of chloride ion. We have applied these findings to fabricate a zeolite SERS sensor and demonstrated its effectiveness using catechin as the analyte. The sensor was put together using a commercial zeolite and homemade AgNPs. The AgNPs are likely replaceable by a commercial equivalent, to add even more convenience. Sensor assembly gave high yield and did not involve expensive equipments or tedious procedure. The sensing protocol is straightforward, intuitive, and its results are highly reproducible. With the prospective integration into an automated detection program, we expected these sensor beads and the sensing protocol will significantly improve the throughput of routine SERS detections.Conflicts of interest
The authors declare that they have no competing interest.Acknowledgements
We thank Ms. Chian-fang Jheng for her assistance in all the SEM works. Financial support from the Ministry of Science and Technology, Taiwan, under the project numbers MOST 107-2133-M-415-004 and 106-2622-M-415-002-CC2 is highly appreciated.References
- H. N. Wang, A. Dhawan, Y. Du, D. Batchelor, D. N. Leonard, V. Misra and T. Vo-Dinh, Phys. Chem. Chem. Phys., 2013, 15, 6008–6015 RSC.
- I. H. Chou, M. Benford, H. T. Beier, G. L. Coté, M. Wang, N. Jing, J. Kameoka and T. A. Good, Nano Lett., 2008, 8, 1729–1735 CrossRef PubMed.
- L. Guerrini, R. Arenal, B. Mannini, F. Chiti, R. Pini, P. Matteini and R. A. Alvarez-Puebla, ACS Appl. Mater. Interfaces, 2015, 7, 9420–9428 CrossRef CAS PubMed.
- Y. He, X. Yang, R. Yuan and Y. Chai, Anal. Chem., 2017, 89, 2866–2872 CrossRef CAS PubMed.
- Y. Yuan, Y. Lin, B. Gu, N. Panwar, S. C. Tjin, J. Song, J. Qu and K.-T. Yong, Coord. Chem. Rev., 2017, 339, 138–152 CrossRef CAS.
- A.-I. Henry, B. Sharma, M. F. Cardinal, D. Kurouski and R. P. Van Duyne, Anal. Chem., 2016, 88, 6638–6647 CrossRef CAS PubMed.
- J. Chen, W. Shen, B. Das, Y. Li and G. Qin, RSC Adv., 2014, 4, 22660–22668 RSC.
- L. Yang, P. Li and J. Liu, RSC Adv., 2014, 4, 49635–49646 RSC.
- Y. Ma, L. Yang, Y. Yang, Y. Peng, Y. Wei and Z. Huang, RSC Adv., 2018, 8, 22095–22102 RSC.
- K. Kneipp, Y. Wang, H. Kneipp, L. T. Perelman, I. Itzkan, R. R. Dasari and M. S. Feld, Phys. Rev. Lett., 1997, 78, 1667–1670 CrossRef CAS.
- S. Nie and S. R. Emory, Science, 1997, 275, 1102–1106 CrossRef CAS PubMed.
- E. C. Le Ru, E. Blackie, M. Meyer and P. G. Etchegoin, J. Phys. Chem. C, 2007, 111, 13794–13803 CrossRef CAS.
- M. M. Dvoynenko and J. K. Wang, Opt. Lett., 2007, 32, 3552–3554 CrossRef CAS PubMed.
- S. K. Saikin, Y. Chu, D. Rappoport, K. B. Crozier and A. Aspuru-Guzik, J. Phys. Chem. Lett., 2010, 1, 2740–2746 CrossRef CAS.
- C. C. Huang and W. Chen, Microchim. Acta, 2018, 185, 120 CrossRef PubMed.
- J. Jiang, J. Yu and A. Corma, Angew. Chem., Int. Ed., 2010, 49, 3120–3145 CrossRef CAS PubMed.
- M. E. Davis, Nature, 2002, 417, 813–821 CrossRef CAS PubMed.
- F. Hendriks, D. Valencia, P. Bruijnincx and B. Weckhuysen, Phys. Chem. Chem. Phys., 2017, 19, 1857–1867 RSC.
- M. Matsui, Y. Kiyozumi, Y. Mizushina, K. Sakaguchi and F. Mizukami, Sep. Purif. Technol., 2015, 149, 103–109 CrossRef CAS.
- J. Wu, X. Li, Y. Yan, Y. Hu, Y. Zhang and Y. Tang, J. Colloid Interface Sci., 2013, 406, 130–138 CrossRef CAS PubMed.
- T. Y. Nara, H. Togashi, C. Sekikawa, M. Kawakami, N. Yaginuma, K. Sakaguchi, F. Mizukami and T. Tsunoda, Colloids Surf., B, 2009, 68, 68–73 CrossRef CAS PubMed.
- C. Serri, B. de Gennaro, V. Quagliariello, R. V. Iaffaioli, G. De Rosa, L. Catalanotti, M. Biondi and L. Mayol, Eur. J. Pharm. Sci., 2017, 99, 202–208 CrossRef CAS PubMed.
- A. Szarpak-Jankowska, C. Burgess, L. De Cola and J. Huskens, Chemistry, 2013, 19, 14925–14930 CrossRef CAS PubMed.
- S. Onyango Maurice, J. Kittinya, N. Hadebe, O. Ojijo Vincent and A. Ochieng, Chem. Ind. Chem. Eng. Q., 2011, 17, 385–395 CrossRef.
- N. Liu, M. Gong, P. Zhang, L. Li, W. Li and R. Lee, J. Mater. Sci., 2011, 46, 3162–3168 CrossRef CAS.
- P. K. Dutta and D. Robins, Langmuir, 1991, 7, 2004–2006 CrossRef CAS.
- W. Yan, L. Bao, S. M. Mahurin and S. Dai, Appl. Spectrosc., 2004, 58, 18–25 CrossRef CAS PubMed.
- P. Lee and D. Meisel, J. Chem. Phys., 1982, 86, 3391–3395 CrossRef CAS.
- D. Li, N. Martini, Z. Wu and J. Wen, Fitoterapia, 2012, 83, 1267–1274 CrossRef CAS PubMed.
- C. E. Martinez-Nuñez, M. Cortez-Valadez, Y. Delgado-Beleño, N. S. Flores-López, J. F. Román-Zamorano, J. Flores-Valenzuela and M. Flores-Acosta, J. Nanopart. Res., 2017, 19, 31 CrossRef.
- A. Otto, A. Bruckbauer and Y. X. Chen, J. Mol. Struct., 2003, 661–662, 501–514 CrossRef CAS.
- B. Wiley, T. Herricks, Y. Sun and Y. Xia, Nano Lett., 2004, 4, 1733–1739 CrossRef CAS.
- J. An, B. Tang, X. Zheng, J. Zhou, F. Dong, S. Xu, Y. Wang, B. Zhao and W. Xu, J. Phys. Chem. C, 2008, 112, 15176–15182 CrossRef CAS.
- B. Tang, S. Xu, J. An, B. Zhao, W. Xu and J. R. Lombardi, Phys. Chem. Chem. Phys., 2009, 11, 10286–10292 RSC.
- M. E. Marques, A. A. P. Mansur and H. S. Mansur, Appl. Surf. Sci., 2013, 275, 347–360 CrossRef CAS.
Footnotes |
| † Electronic supplementary information (ESI) available. See DOI: 10.1039/c9ra00039a |
| ‡ Chi-Yun Cheng and Chao-Ting Chou contributed equally to this work. |
| This journal is © The Royal Society of Chemistry 2019 |

