DOI:
10.1039/C9RA00164F
(Paper)
RSC Adv., 2019,
9, 20075-20086
Modeling study of the heat of absorption and solid precipitation for CO2 capture by chilled ammonia
Received
8th January 2019
, Accepted 19th June 2019
First published on 27th June 2019
Abstract
The contribution of individual reactions to the overall heat of CO2 absorption, as well as conditions for solid NH4HCO3(s) formation in a chilled ammonia process (CAP) were studied using Aspen Plus at temperatures between 2 and 40 °C. The overall heat of absorption in the CAP first decreased and then increased with increasing CO2 loading. The increase in overall heat of absorption at high CO2 loading was found to be caused mostly by the prominent heat release from the formation of NH4HCO3(s). It was found that NH4HCO3(s) precipitation was promoted for conditions of CO2 loading above 0.7 mol CO2/mol NH3 and temperatures less than 20 °C, which at the same time can dramatically increase the heat of CO2 absorption. As such, the CO2 loading is recommended to be around 0.6–0.7 mol CO2/mol NH3 at temperatures below 20 °C, so that the overall absorption heat is at a low state (less than 60 kJ mol−1 CO2). It was also found that the overall heat of CO2 absorption did not change much with temperature when CO2 loading was less than 0.5 mol CO2/mol NH3, while, when the CO2 loading exceeded 0.7 mol CO2/mol NH3, the heat of absorption increased with decreasing temperature.
1. Introduction
CO2 is considered as the main greenhouse gas responsible for global warming and climate change.1 According to the Intergovernmental Panel on Climate Change (IPCC), carbon capture and storage (CCS) is an attractive technology for reduction of greenhouse gas emissions in the medium term.2 There are three main types of carbon capture technology: pre-combustion, oxy-combustion, and post-combustion.3–6
Post-combustion capture attracts the most attention because it can be more easily implemented on existing power plants.7–9 In post-combustion capture, alkanolamine solutions, monoethanolamine (MEA) in particular, act as CO2 absorbents with high reaction rates.10–12 However, amine-based capture suffers from corrosion and high operating cost, including absorbent degradation and relatively high energy consumption. These drawbacks greatly hinder its wide deployment in the electric power industry.13–16 Many researchers investigated cost-effective alternatives with low heat of CO2 absorption. Aqueous ammonia (NH3) is considered as a competitive candidate because of its unique properties, including (1) high CO2 capture capacity;17 (2) simultaneous capture of multiple acidic gases such as SO2 and NOx;18,19 (3) resistance to oxidation and thermal stability;10 (4) low capital costs; (5) relatively low heat of CO2 absorption. The heat of CO2 absorption by aqueous NH3 at 40 °C has been experimentally measured and reported by Liu et al.20 and Qin et al.21 (around 65–70 kJ mol−1 CO2), which is lower than that of the MEA system reported by Kim et al.14 (more than 80 kJ mol−1 CO2 at 40 °C).
In view of the fact that ammonia escape appears to be the greatest concern to the industry, the chilled ammonia process (CAP) has being developed to address this problem.22 In a CAP process, CO2 is absorbed at low temperatures in the range of 2–20 °C to minimize the volatilization of ammonia. The CO2-enriched solution is then regenerated at 100–150 °C and 2–136 atm. Bak et al.23 pointed out that, when the absorber operated at a feed gas temperature of 10 °C and lean solution at a temperature of 7 °C, the CO2 absorption efficiency could reach more than 85% with ammonia loss less than 8%.
However, there is limited information on the contribution of each individual reaction occurring during CO2 absorption by NH3 to the overall heat of CO2 absorption in CAP. In addition, conditions for the formation of solid ammonium bicarbonate, NH4HCO3(s), must be well understood. Since the temperatures in CAP are low in general, solid may precipitate in the absorber. Yu et al. analyzed the solid composition in the absorber by XRD, the result suggested that the pilot plant samples were predominantly NH4HCO3(s).24 Besides, Diao et al. studied the crystalline solids by FT-IR analysis, the FT-IR patterns of the crystalline solids were compared to standard ammonium bicarbonate powders. They found that ammonium bicarbonate was the main product.25 NH4HCO3(s) formation would dramatically change the heat of CO2 absorption of the NH3–CO2–H2O system, because of the exothermic property of NH4HCO3(s) formation.26 The heat of CO2 absorption is an important thermodynamic property, as a higher heat of CO2 absorption means more energy required in solvent regeneration. The detailed thermodynamic analysis for the contribution of each individual reaction to the overall heat of absorption is one of the key ways to clarify the reaction mechanism and process optimization. According to the exothermic/endothermic characteristics of each individual reaction, the operating parameters such as CO2 loading and temperature, can be adjusted to optimize system energy consumption. Therefore, some researchers studied the heat of absorption for each individual reaction in amine-based capture system27 and ammonia-based system,28 but temperatures ranged from 40 to 80 °C, which were much higher than those encountered in CAP; in addition, at those higher temperatures solid precipitation was not observed and not considered an issue. Energy consumption in CAP has been evaluated by thermodynamic models,29,30 but they all focused on the whole process rather than analyzed the heat change caused by each individual chemical reaction in the absorber. Although Jilvero et al.31 and Kurz et al.32 reported phase equilibrium experimental data for the NH3–CO2–H2O system at temperatures in the range 10–80 °C, the effect of solid formation on heat of absorption was not reported in their studies. The contribution of each individual reaction to the overall heat of CO2 absorption in CAP is a gap, which is very important to understand the absorption mechanism and control the system absorption heat. The various contributions can be controlled by adjusting the operation parameters, such as CO2 loading and temperature, to optimize overall heat of absorption.
In this work, the heat of CO2 absorption and the contribution of each individual reaction, particularly that of NH4HCO3(s) formation, to the overall heat of CO2 absorption in CAP is investigated through a thermodynamic model. The model is first validated by experimental data from literature, and then the validated model is used to predict the heat of absorption in CAP. Finally, according to NH4HCO3(s) formation conditions, recommended CO2 loading at different temperatures with the lowest overall heat of absorption are proposed.
2. Methodology
It is difficult to experimentally determine each individual reaction's contribution to the overall heat of CO2 absorption. Thermodynamic analysis is proved to be a useful and powerful method to study the absorption process and absorption heat in CO2 capture systems.27–29 Two models that are commonly used in thermodynamics studies of CO2 capture process: (1) the extended UNIQUAC model developed by Thomsen and Rasmussen33 and (2) the e-NRTL model proposed by Chen et al.34 Gudjonsdottir et al.35 reported that, if the interaction parameters better fit the experimental data in the NH3–CO2–H2O system, the e-NRTL model covers a wider range of conditions than the extended UNIQUAC model. Jilvero et al.31 also demonstrated that the e-NRTL model is more accurate for the prediction of CO2 partial pressure at low temperatures (10–40 °C).
There are two commonly ways for calculating absorption heat. The van't Hoff equation based on equilibrium constant (eqn (3))27,28 and a thermodynamic relation based on VLE data (eqn (6)).36,37 The van't Hoff equation (eqn (3)) is derived directly from the general form of Gibbs–Helmholtz equation (G–H equation),37 and the general form of G–H equation is:38
| |
 | (1) |
Further, the relationship between the equilibrium constant and Gibbs free energy is:
| |
ΔG = −RT![[thin space (1/6-em)]](https://www.rsc.org/images/entities/char_2009.gif) ln ln![[thin space (1/6-em)]](https://www.rsc.org/images/entities/char_2009.gif) K K
| (2) |
Eqn (2) can be substituted into eqn (1) and we can obtain the van't Hoff equation:
| |
 | (3) |
For the thermodynamic relation based on VLE data (eqn (6)), Sherwood and Prausnitz (1962) gave a detailed description in their paper. The general expression for calculating the absorption heat is:39
| |
 | (4) |
where,
ϕ is vapor phase fugacity coefficient,
y is mole fraction in vapor phase,
γ is liquid phase activity coefficient and
x is mole fraction in liquid phase, subscripts 1 is lighter component.
Eqn (4) is perfectly general, as no simplifying physical assumptions have been made. However its application in this form requires extensive data in the single-phase vapor and liquid regions. Sherwood and Prausnitz point out that eqn (4) can be simplified to eqn (5) after some simplifying physical assumptions.39
| |
 | (5) |
For simplification at ambient pressures, CO2 partial pressures are always used instead of CO2 solubility in eqn (5) that the absorption heat can be obtained simply from VLE data.36,37
| |
 | (6) |
The comparison of difference between the absorption heat calculated by the above two methods and the experimental data reported by Liu et al.20 is illustrated in Fig. 1. It clearly shows that the values for CO2 absorption heat calculated by van't Hoff equation based on equilibrium constant (eqn (3)) agree better with experimental data than that by thermodynamic relation based on VLE data (eqn (6)). The main reason is that van't Hoff equation based on equilibrium constant (eqn (3)) is derived directly from the general form of G–H equation, as no assumptions have been made; however, the use of thermodynamic relation based on VLE data (eqn (6)) implies inherent assumptions,37,39,40 which reduces the accuracy of eqn (6). Additionally, thermodynamic relation based on VLE data (eqn (6)) can only give us the overall absorption heat, but the current study mainly focuses on the endothermic/exothermic condition of each individual reaction. Therefore, in this paper, the van't Hoff equation based on equilibrium constant is selected to calculate the heat of each reaction.
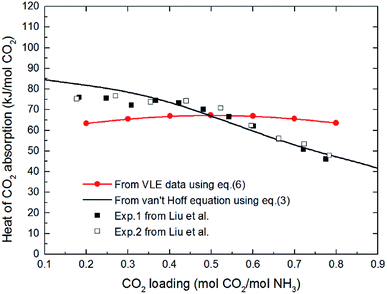 |
| | Fig. 1 The comparison of difference between the absorption heat calculated by the two methods and the experimental data reported by Liu et al. at 40 °C (VLE data in eqn (6) from Kurz et al. 1995 (ref. 32)). | |
According to the above description, in this study e-NRTL model integrated in Aspen Plus is used to describe the liquid phase activity coefficients. The van't Hoff equation based on equilibrium constant is selected to calculate the heat of each reaction. The flash module in Aspen Plus (V7.2) is chosen to calculate the chemical equilibrium and solution speciation. Then the heat of CO2 absorption can be obtained from the solution speciation and chemical equilibrium constants.
2.1 Chemical equilibrium
The chilled NH3–CO2–H2O system herein comprises the following species: CO2, NH3, H2O, NH4+, HCO3−, CO32−, NH2COO−, H3O+, OH−, and solid precipitates (NH4HCO3(s)). The solid NH4HCO3(s) is assumed to be the only solid species in the solution.24,25,35 The main reactions taking place in this system are as follows:| |
 | (R1) |
| |
 | (R2) |
| |
 | (R3) |
| |
 | (R4) |
| |
 | (R5) |
In CAP, the formation of NH4HCO3(s) is described by
| |
 | (R6) |
In addition, CO2 dissolution should be considered, that is,
| |
 | (R7) |
The chemical equilibrium constants K1–K6 and the Henry's law constant kH can be calculated using eqn (7)27,41–43
| |
 | (7) |
where,
K is the chemical equilibrium constant of
(R1)–(R6); subscript
k is reaction number, and
kH is Henry's law constant of
(R7). The
C1,
C2,
C3 and
C4 in
eqn (7) are parameters that need to select from literature or Aspen Plus databank, and will be explained in the following sections.
N2, NH3 and CO2 are chosen as Henry components in this model. Other acid gases, such as H2S, NOx and SO2 and so on, reduce the overall heat of CO2 absorption by aqueous NH3 according to Qi et al.28 results at temperatures more than 40 °C. But the effect of these acid gases on the overall heat of CO2 absorption in CAP has not reported in the open literature, these studies will be one of our future works. In this study, we just focus on the chilled NH3–CO2–H2O system, the other impurity acid gases are thus neglected to simplify the model. The default values in Aspen Plus (V7.2) databank are used for parameters of binary interaction and electrolyte pair in the NH3–CO2–H2O system.32,44–46
2.2 Model of heat of absorption
The heat of each individual reaction ((R1)–(R7)) is expressed in terms of enthalpy change, ΔHk, which can be calculated from the van't Hoff's equation47 with corresponding equilibrium constant written as in eqn (8). The results are summarized in Table 1 (the values of C2 to C4 will be discussed later).| |
 | (8) |
Table 1 Enthalpy change (kJ mol−1) of reactions (R1)–(R7) calculated using eqn (8) at temperatures between 2 and 40 °C
| Reaction no. |
Enthalpy change (ΔHk, kJ mol−1) |
| 2 °C |
5 °C |
10 °C |
15 °C |
20 °C |
30 °C |
40 °C |
| (R1) |
60.37 |
59.81 |
58.88 |
57.94 |
57.01 |
55.13 |
53.27 |
| (R2) |
16.39 |
15.48 |
13.95 |
12.42 |
10.89 |
7.83 |
4.77 |
| (R3) |
22.19 |
21.30 |
19.83 |
18.35 |
16.88 |
13.93 |
10.98 |
| (R4) |
7.83 |
7.36 |
6.56 |
5.74 |
4.91 |
3.19 |
1.42 |
| (R5) |
−24.11 |
−24.11 |
−24.11 |
−24.11 |
−24.11 |
−24.11 |
−24.11 |
| (R6) |
−23.72 |
−22.39 |
−20.21 |
−18.04 |
−15.91 |
−11.70 |
−7.63 |
| (R7) |
−21.51 |
−21.11 |
−20.46 |
−19.79 |
−19.13 |
−18.56 |
−16.43 |
The overall heat of CO2 absorption in the NH3–CO2–H2O system depends on the endothermic or exothermic properties, as well as the extent and direction, of each individual reaction (R1)–(R7) at different CO2 loadings. The extent and direction of (R1) to (R7) are determined by the key species change in the solution with changing CO2 loading. By increasing the CO2 loading gradually, all of these reactions will move in one direction or the other. Some may move forward and the others backward, depending on the variation of key species, Δni, as shown in the following equations:
| |
 | (9) |
| |
 | (10) |
| |
 | (11) |
| |
 | (12) |
| |
 | (13) |
| |
 | (14) |
The change in the total number of moles of CO2, ΔnCO2,tot is determined by
| |
 | (15) |
where superscripts F and I stand for final and initial states, respectively.
The extent and direction of each individual reaction absorbing per unit CO2 can be quantified by Ek:
| |
 | (16) |
where Δ
ni is the increment of key species in mole,
Ek is the specific extent for each reaction (
(R1)–(R7)),
i.e. per mole of CO
2 absorbed.
Ek value can be positive or negative depending on the direction of the reaction.
The overall heat of CO2 absorption can be calculated by the summation of the heat of absorption of all the reactions:
| |
 | (17) |
where Δ
Habs is the overall heat of CO
2 absorption.
2.3 Chemical equilibrium constants
In order to accurately predict the enthalpy change of each reaction, it is important to obtain accurate chemical equilibrium constants. According to eqn (8), the enthalpy change for each individual reaction ((R1)–(R7)) is directly related to the equilibrium constant. The chemical equilibrium constants can be found on mole fraction basis and/or molality basis. In this paper mole fraction basis is used. However, some equilibrium constants available in literature are on molality basis. In this case, unit conversion is done using eqn (18)| |
ln![[thin space (1/6-em)]](https://www.rsc.org/images/entities/char_2009.gif) Km = ln Km = ln![[thin space (1/6-em)]](https://www.rsc.org/images/entities/char_2009.gif) Kx + Δn Kx + Δn![[thin space (1/6-em)]](https://www.rsc.org/images/entities/char_2009.gif) ln(55.51) ln(55.51)
| (18) |
where Km is the molality based equilibrium constant; Kx is the mole fraction based equilibrium constant; Δn is the change in moles across the equation excluding water and solid. In this study, the protonation of NH3 (R4) is taken as an example to explain the choice of the equilibrium constants. The similar method is applied for the other reactions. The equilibrium constants available in literature are listed in Table 2.
Table 2 References for choosing chemical equilibrium constants of reactions (R1)–(R7)
| Reaction no. |
Parameter |
References |
| (R1) |
K1 |
Austgen et al.,48 Weiland et al.,41 Pazuki et al.,49 Beutier and Renon50 |
| (R2) |
K2 |
Austgen et al.,48 Pazuki et al.,49 Beutier and Renon,50 Oscarson et al.51 |
| (R3) |
K3 |
Austgen et al.,48 Oscarson et al.,51 Weiland et al.41 |
| (R4) |
K4 |
Edwards et al.,52 Kawazuishi and Prausnitz,53 Clegg and Brimblecombe,54 Pazuki et al.,49 Aspen Plus |
| (R5) |
K5 |
Edwards et al.,52 Kawazuishi and Prausnitz,53 Pazuki et al.,49 Beutier and Renon,50 Aspen Plus |
| (R6) |
K6 |
Aspen Plus |
| (R7) |
kH |
Austgen et al.,48 Oscarson et al.,51 Que and Chen,55 Kawazuishi and Prausnitz,53 Pazuki et al.49 |
2.3.1 Chemical equilibrium constant for NH3 protonation (R4). Comparing the chemical equilibrium constants from different sources, the one given by Edwards et al.52 is chosen for NH3 protonation (R4) in the current study. Fig. 2(a) shows the equilibrium constants for NH3 protonation (R4), in which ln![[thin space (1/6-em)]](https://www.rsc.org/images/entities/char_2009.gif) K4 is given by Edwards et al.,52 Kawazuishi and Prausnitz,53 Pazuki et al.,49 Clegg and Brimblecombe,54 and Aspen Plus (V7.2). The corresponding enthalpy change, −ΔHNH3, calculated by eqn (8) are shown in Fig. 2(b) and compared with the experimental data reported by Bates and Pinching.56 All equilibrium constants has similar values and tendency except that reported by Pazuki et al.49 at different temperatures. In Fig. 2(b), the corresponding enthalpy change calculated by Edwards et al.52 and Aspen Plus (V7.2) have the same values. The enthalpy change calculated by Kawazuishi and Prausnitz53 and Pazuki et al.49 have similar values as well. However, the enthalpy change predicted by Clegg and Brimblecombe54 has little difference with the others'. Besides, the prediction of enthalpy change by Edwards et al.52 is the closest to the experimental data. It should be noted that Edwards et al.52 and Aspen Plus predict the same values. The black solid line overlaps with the red dotted line in Fig. 2; therefore, only four curves are seen in Fig. 2. The similar method is applied to other reactions. The default equilibrium constant from Aspen Plus (V7.2) databank is used for NH4HCO3(s) formation (R6). The constants C1, C2, C3 and C4 for each reaction are summarized in Table 3. One may notice that the values of the parameters for the CO32− (R3), NH3 (R4) and NH2COO− formation (R5) in this paper are different from those in the original references, because they are converted using eqn (18) to mole fraction basis.
K4 is given by Edwards et al.,52 Kawazuishi and Prausnitz,53 Pazuki et al.,49 Clegg and Brimblecombe,54 and Aspen Plus (V7.2). The corresponding enthalpy change, −ΔHNH3, calculated by eqn (8) are shown in Fig. 2(b) and compared with the experimental data reported by Bates and Pinching.56 All equilibrium constants has similar values and tendency except that reported by Pazuki et al.49 at different temperatures. In Fig. 2(b), the corresponding enthalpy change calculated by Edwards et al.52 and Aspen Plus (V7.2) have the same values. The enthalpy change calculated by Kawazuishi and Prausnitz53 and Pazuki et al.49 have similar values as well. However, the enthalpy change predicted by Clegg and Brimblecombe54 has little difference with the others'. Besides, the prediction of enthalpy change by Edwards et al.52 is the closest to the experimental data. It should be noted that Edwards et al.52 and Aspen Plus predict the same values. The black solid line overlaps with the red dotted line in Fig. 2; therefore, only four curves are seen in Fig. 2. The similar method is applied to other reactions. The default equilibrium constant from Aspen Plus (V7.2) databank is used for NH4HCO3(s) formation (R6). The constants C1, C2, C3 and C4 for each reaction are summarized in Table 3. One may notice that the values of the parameters for the CO32− (R3), NH3 (R4) and NH2COO− formation (R5) in this paper are different from those in the original references, because they are converted using eqn (18) to mole fraction basis.
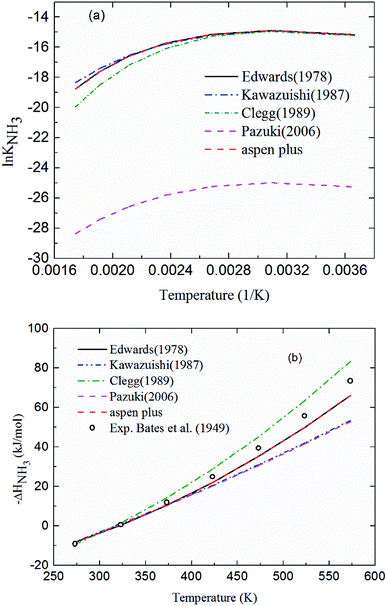 |
| | Fig. 2 (a) ln![[thin space (1/6-em)]](https://www.rsc.org/images/entities/char_2009.gif) K4 and (b) corresponding −ΔHNH3 as a function of temperature for NH3 protonation in the water (R4). K4 and (b) corresponding −ΔHNH3 as a function of temperature for NH3 protonation in the water (R4). | |
Table 3 Chemical equilibrium constants and Henry's constant for reactions (R1)–(R7)
| Reaction no. |
Parameters |
C1 |
C2 |
C3 |
C4 |
Sources |
| Mole fraction based chemical equilibrium constants in references mentioned. Molality based equilibrium constants in references mentioned. |
| (R1) |
K1 |
132.90 |
−13445.90 |
−22.48 |
0.00 |
Austgen et al.48a |
| (R2) |
K2 |
231.47 |
−12092.10 |
−36.78 |
0.00 |
Austgen et al.48a |
| (R3) |
K3 |
216.05 |
−12431.70 |
−35.48 |
0.00 |
Oscarson et al.51b |
| (R4) |
K4 |
−1.26 |
−3335.70 |
1.50 |
−0.03706 |
Edwards et al.52b |
| (R5) |
K5 |
−4.58 |
2900.00 |
0.00 |
0.00 |
Edwards et al.52b |
| (R6) |
K6 |
554.82 |
−22442.53 |
−89.01 |
0.06473 |
Aspen Plusa |
| (R7) |
kH |
170.71 |
−8477.71 |
−21.96 |
0.00578 |
Aspen Plusa |
3. Results and discussion
3.1 Model validation
The model validation is conducted by comparing the model results with experimental data obtained from literature. The calculation results are obtained for vapor–liquid equilibrium (VLE), solid–liquid equilibrium (SLE), and solution speciation at different temperatures and NH3 concentrations. They are introduced as follows.
3.1.1 Validation of the thermodynamic model in vapor phase (VLE). Fig. 3 shows the predicted NH3 and CO2 partial pressure at T = 20 °C and different NH3 molality. The model is in good agreement with the experimental data from different laboratories, which indicates the reliability of the model results.31,57 There is no NH3 equilibrium partial pressure reported in Jilvero's article. Therefore, only the CO2 equilibrium partial pressure is exhibited in Fig. 3(b). With increasing CO2 molality, the equilibrium partial pressure of NH3 decreases. Because free NH3 in solution is consumed to form nitrogenous compounds at a higher CO2 molality, it lowered the mass transfer driving force for ammonia escaping. Therefore, a high CO2 molality is recommended in order to reduce, not only ammonia escape58 but also the regeneration energy consumption.59 It can be observed that at low NH3 concentration (less than 1 mol NH3/kg H2O), both CO2 and NH3 partial pressures can match experimental data within about 15% error. However, the model underestimates slightly the NH3 partial pressure and overestimated CO2 partial pressure at higher NH3 concentration and lower CO2 molality, which may be caused by the volatility of NH3. Nonetheless, under the conditions considered here, the largest difference between the calculation and experiments is about 12%.
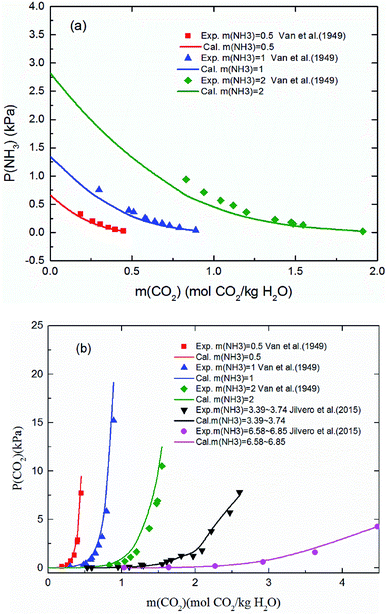 |
| | Fig. 3 Comparison of the calculated (a) NH3 and (b) CO2 equilibrium partial pressure with experimental data31,57 at 20 °C. | |
3.1.2 Validation of the thermodynamic model in liquid phase (solution speciation and SLE). Fig. 4 shows the calculated solution speciation and experimental results reported by Lichtfers and Rumpf.60 The corresponding conditions are m(NH3) = 4.44 mol kg−1 H2O and T = 60 °C. It concludes that the calculated results agree well with the experimental data within less than 6% error. The increase in carbamate molality is greater than for those of carbonate and bicarbonate in the presence of excess NH3 at the initial stage of absorption. The carbamate concentration reaches its maximum value at about m(CO2) = 2.2 mol CO2/kg H2O (CO2 loading = 0.5 mol CO2/mol NH3). However, at high CO2 molality (m(CO2) greater than 2.5 mol CO2/kg H2O) the bicarbonate is the dominant species. Meanwhile, the concentration of carbamate decreases.61
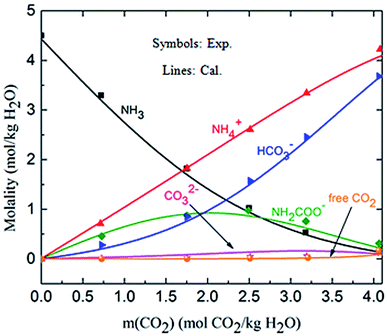 |
| | Fig. 4 Comparison of the calculated solution speciation with experimental data60 at T = 60 °C and m(NH3) = 4.44 mol NH3/kg H2O. | |
The deviation for NH4HCO3(s) solubility in ammonia solution between calculated and different literature values62,63 are shown in Fig. 5 at temperatures from 0 to 60 °C. The maximum and average deviations are 5% and 2%, respectively. The deviation of NH4HCO3(s) solubility between calculated and literature value at temperatures more than 40 °C is slightly higher than those at lower temperatures. However, considering the temperature ranges in the present study (from 2 to 40 °C), the relative deviation is less than 5% which confirms the accuracy of the thermodynamic model in this study.
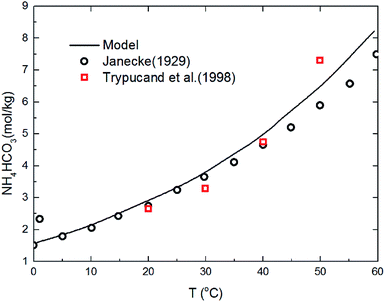 |
| | Fig. 5 Comparison of NH4HCO3(s) solubility in ammonia solution at different temperatures between calculated values and data in literature.62,63 | |
3.1.3 Validation of thermodynamic model by heat of absorption. Fig. 6 shows the heat of CO2 absorption predicted by the model and the experimental data of Liu et al.20 and Qin et al.21 at different temperatures. In addition, another model from Que et al.55 is also cited in Fig. 6 for comparison. As we can see that all the model values and experimental data decrease with CO2 loading except Qin et al. Qin et al. found that the absorption heat of CO2 with NH3 at 40 °C and 60 °C decreases at first with increasing loading, but between 0.2 and 0.6 mol CO2/mol NH3 in loading it rapidly increases. When the loading is around 0.6 mol CO2/mol NH3, the absorption heat of CO2 with NH3 reaches a maximum (∼100 kJ mol−1 CO2 at 60 °C). The absorption heat then starts to decrease again. This trend is more pronounced at high temperature (60 °C). No theoretical justification for this strange trend is presented in their paper. However, according to all prior researchers' results, there is no reaction between CO2 and NH3 that should release a heat of absorption higher than 100 kJ mol−1 CO2.20,36,55 The estimated absorption heat of CO2 with NH3 using the speciation data of Mani et al.,61 measured by NMR, also gives a value of around 80 kJ mol−1 CO2. In addition, as CO2 is gradually absorbed, the concentration of ammonia in the solution decreases attenuating the reaction. The amount of heat released during the absorption process should be gradually reduced. So, the validity of the data obtained by Qin et al. needs further discussion. In general, the agreement between the current model values and Liu's experimental data, as well as agreement with the model values of Que et al. clearly support the model validity and accuracy. The subtle difference between the model values and experimental data may be caused by the activity change of species conjectured by Kim.64 The contribution to the heat of absorption from the liquid-phase nonideality is neglected in this study. It should be better to consider the heat from the liquid-phase nonideality in the model to examine Kim's guess in our future works. In addition, the modeling deviation may also be from the chemical equilibrium constants chosen from literature. As shown in Fig. 2(a), the chemical equilibrium constants chosen from different literature have some differences with each other and may cause a difference in the calculation of enthalpy change using eqn (8) (see Fig. 2(b)). The heat of CO2 absorption predicted by the model decreases from −81 to −37 kJ mol−1 with the CO2 loading increasing from 0.1 to 1 mol CO2/mol NH3. In addition, the current model results indicate that the overall heat of CO2 absorption does not change significantly with NH3 concentration. This implies that the reaction between NH3 and CO2 at different NH3 concentration has almost the same reaction products distribution.
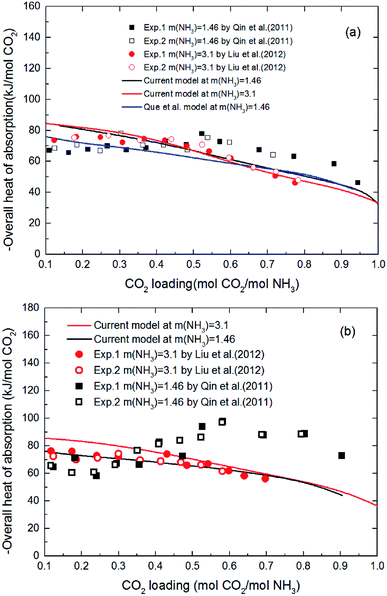 |
| | Fig. 6 Comparison of the overall heat of CO2 absorption predicted by model with experimental data20,21 at different temperatures ((a) T = 40 °C, (b) T = 60 °C). | |
3.2 Individual reaction contribution to the overall heat of CO2 absorption
Fig. 7 shows the predicted solution speciation and heat of CO2 absorption in the NH3–CO2–H2O system, respectively, all at m(NH3) = 3 mol kg−1 H2O and T = 2 °C. Because the formation of carbamate (NH2COO−) and NH4HCO3(s) significantly impact the heat of CO2 absorption, the whole absorption process is divided into three stages according to carbamate and NH4HCO3(s) formation, as shown in Fig. 7, i.e. Stage I: CO2 loading < 0.5 mol CO2/mol NH3; Stage II: 0.5 < CO2 loading < 0.7 mol CO2/mol NH3; and Stage III: CO2 loading > 0.7 mol CO2/mol NH3. They are discussed in detail in the following paragraphs.
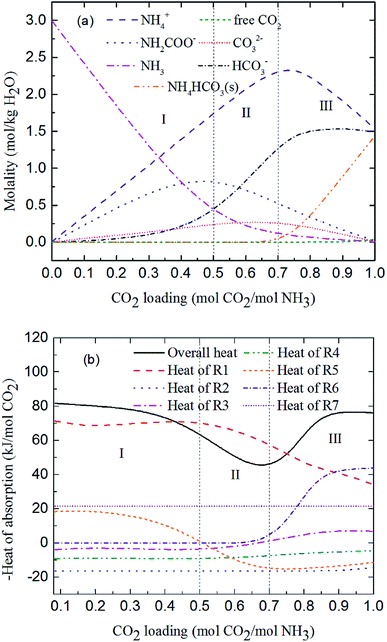 |
| | Fig. 7 Prediction of (a) solution speciation change and (b) heat of CO2 absorption in the NH3–CO2–H2O system at m(NH3) = 3 mol kg−1 H2O and T = 2 °C. | |
At low CO2 loading (Stage I), there is an excess of free NH3, and carbamate is the main product in the solution via the forward reaction of carbamate formation (R5). For example, 0.333 mol CO2/mol NH3, 72% of CO2 converts to carbamate and only 12.5% and 15.4% converts to bicarbonate and carbonate, respectively. Fig. 7(b) shows that the overall heat of CO2 absorption first decreases and then increases rapidly with increasing CO2 loading. As explained above, (R5) moves forward to form carbamate with increasing CO2 loading in Stage I. In this stage, (R5) is an exothermic process (−ΔH of (R5) has a positive value) and thus releases heat.
As the absorption proceeds to Stage II, carbamate is decomposed via the backward reaction of carbamate formation (R5) to form bicarbonate, with 56.9% of CO2 turns into bicarbonate, 13.6% into carbonate, and 29.5% into carbamate at CO2 loading of 0.667 mol CO2/mol NH3. In this stage, (R5) moves backward with increasing CO2 loading. As shown in Fig. 7(b), (R5) is still the dominant reaction, but becomes an endothermic, thus reducing the overall heat of CO2 absorption (the overall process remaining exothermic).
Fig. 7(a) shows that for CO2 loading greater than 0.7 mol CO2/mol NH3 (Stage III), NH4HCO3(s) is gradually formed via the forward reaction of NH4HCO3(s) formation (R6) at 2 °C. The amount of bicarbonate produces by carbamate decomposition is equal to that consumes by solid formation, so the concentration of bicarbonate remains constant. The corresponding overall heat of CO2 absorption increases due to the heat release from the solid formation, which can be seen in Fig. 7(b). The overall heat of CO2 absorption is about −78 kJ mol−1 CO2 at CO2 loading of 1 mol CO2/mol NH3, which is similar to the initial stage of absorption. Now, NH4HCO3(s) formation (R6) contributes most to the overall heat of CO2 absorption. Water as a main reactant is continuously consumed by CO2 dissociation (R2), CO32− formation (R3) and NH3 protonation (R4), causing water ionization (R1) to move backward and to release heat in the entire absorption process. It is worth pointing out that the heat of CO2 physical absorption (R7) remains −21 kJ mol−1 CO2 or so in Fig. 7(b). This is because the Henry's law constant of CO2 physical absorption (R7) depends on temperature, and the physical absorption amount of CO2 increases linearly with increasing CO2 loading.28
Fig. 8 shows the contribution of each reaction to the overall heat of CO2 absorption at m(NH3) = 3 mol kg−1 H2O and T = 2 °C. The share of CO32− formation (R3) is very small due to the small amount of CO32− in the solution. The water dissociation (R1), CO2 dissociation (R2), carbamate formation (R5), and CO2 physical absorption (R7) are the main contributors to the overall heat of CO2 absorption at the initial phase (CO2 loading = 0.25 mol CO2/mol NH3). This is quite different from amine-based system. Kim et al.27 reported that the main contributors to the overall heat of CO2 absorption in MEA solution were carbamate and MEAH+ formation reactions. When CO2 loading is 0.5 mol CO2/mol NH3, the contribution of carbamate formation (R5) becomes minimum. This is because carbamate formation (R5) is at a tipping point from forward to backward reaction, when the extent of carbamate formation reaction (R5) is very weak. After the solids appear at CO2 loadings greater than 0.7 mol CO2/mol NH3, the NH4HCO3(s) formation (R6), water dissociation (R1), and CO2 physical absorption (R7) become the main contributors to the overall heat. The contribution of NH4HCO3(s) formation (R6) is 32% at a CO2 loading = 1 mol CO2/mol NH3.
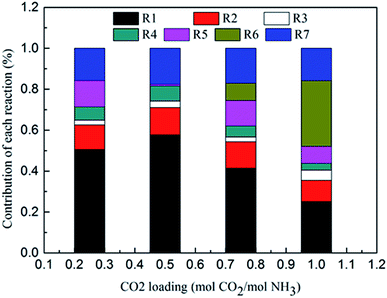 |
| | Fig. 8 Contribution of each reaction to overall heat of CO2 absorption at m(NH3) = 3 mol kg−1 H2O and T = 2 °C. | |
Fig. 9 and 10 show the prediction of solution speciation change and heat of CO2 absorption in the NH3–CO2–H2O system at T = 15 °C and 40 °C, respectively. At T = 15 °C (Fig. 9), three stages, similar to the process at T = 2 °C (Fig. 7), are observed, but with a higher turning point of CO2 loading (moving from 0.7 at T = 2 °C to 0.85 mol CO2/mol NH3 at T = 15 °C). Additionally, speciation data reported by Jilvero et al.31 at m(NH3) = 3.5 mol kg−1 H2O and room temperature is also include in Fig. 9. The trend of the model results agree well with those of experimental data. However, the model values of NH2COO− are distinctly lower than the experimental data. This is because the NH3 concentration in Jilvero et al. (m(NH3) = 3.5 mol kg−1 H2O) is higher than that in this study (m(NH3) = 3 mol kg−1 H2O). According to (R5), Higher NH3 concentration promotes the formation of NH2COO−, so the NH2COO− concentration in Jilvero et al. is higher than our model results. When the absorption temperature increases further to 40 °C, only two stages can be seen in Fig. 10. The third stage caused mainly by the formation of NH4HCO3(s) disappears at higher temperature, as shown in Fig. 10.
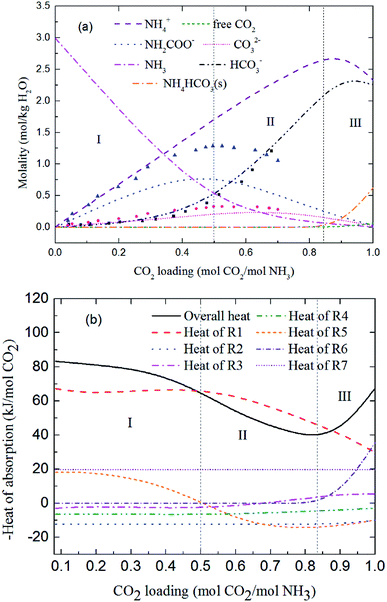 |
| | Fig. 9 Predictions of (a) solution speciation change and (b) heat of CO2 absorption in the NH3–CO2–H2O system at m(NH3) = 3 mol kg−1 H2O and T = 15 °C: (■) HCO3− (●) CO32− and (▲) NH2COO− concentration in Jilvero et al.31 at m(NH3) = 3.5 mol kg−1 H2O and room temperature. | |
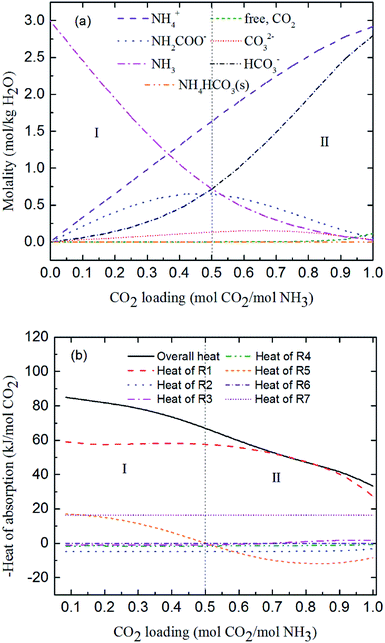 |
| | Fig. 10 Predictions of (a) solution speciation change and (b) heat of CO2 absorption in the NH3–CO2–H2O system at m(NH3) = 3 mol kg−1 H2O and T = 40 °C. | |
3.3 Formation conditions of NH4HCO3(s) in CAP
Fig. 11(a) shows the NH4HCO3(s) mole fraction in the solution at temperatures between 2 and 40 °C and for m(NH3) = 3.1 mol kg−1 H2O. The corresponding overall heat of CO2 absorption is shown in Fig. 11(b). As low temperature favors the formation of solid phase NH4HCO3(s),46 there is little solid formed (less than 8%) for temperatures over 20 °C. CO2 loading above 0.7 mol CO2/mol NH3 and temperatures less than 20 °C promotes NH4HCO3(s) precipitation, which can dramatically increase the heat of CO2 absorption. For instance, NH4HCO3(s) begins to form when CO2 loading is greater than 0.7 mol CO2/mol NH3 at T = 2 °C, and almost 50% of CO2 is converted to NH4HCO3(s) at CO2 loading = 1 mol CO2/mol NH3. The overall heat of absorption changes from −43.43 to −76.09 kJ mol−1 CO2 caused by NH4HCO3(s) formation at T = 2 °C (see Fig. 11(b)).
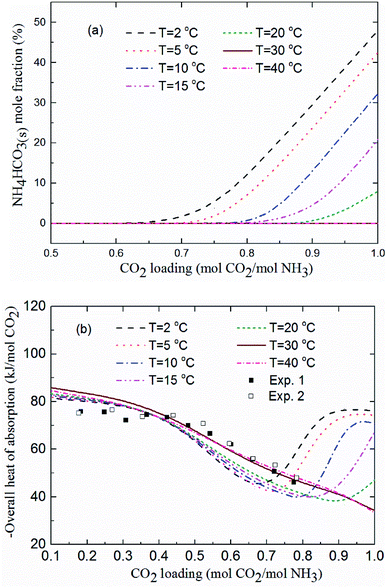 |
| | Fig. 11 (a) NH4HCO3(s) mole fraction and (b) overall heat of CO2 absorption vs. CO2 loading at temperatures between 2 and 40 °C and m(NH3) = 3.1 mol kg−1 H2O (lines: model results, square points: experimental data20 at T = 40 °C and m(NH3) = 3.1 mol kg−1 H2O). | |
As shown in Fig. 11(b), the model results show a good agreement with the experimental data20 at T = 40 °C. The predicted average heat of absorption is about −74.4 kJ mol−1 CO2 at low CO2 loadings (0.2 mol CO2/mol NH3 < CO2 loading < 0.5 mol CO2/mol NH3). This is consistent with Liu et al.'s results (−74.8 kJ mol−1 CO2).20 Fig. 11(b) also shows that temperature has almost no effect on the heat of CO2 absorption at low CO2 loadings (less than 0.5 mol CO2/mol NH3), which is consistent with the results from the model of Que and Chen.55 However, at high CO2 loadings (above 0.7 mol CO2/mol NH3), the decrease in temperature shows a negative effect on the overall heat of CO2 absorption. The overall heat of CO2 absorption at a CO2 loading of 0.9 mol CO2/mol NH3 are −77.1, −75.7, −73.3, −45.3 and −36.6 kJ mol−1 CO2 for temperatures of 2, 5, 10, 15 and 20 °C, respectively. This is likely the more amounts of NH4HCO3(s) at low temperature (see Fig. 11(a)) the more heat is released through NH4HCO3(s) formation reaction (R6). The formation of solid at low temperature greatly increases the overall heat of CO2 absorption. CO2 loading with the lowest absorption heat, 0.67, 0.75, 0.8, 0.83 and 0.92 mol CO2/mol NH3 at the corresponding temperature of 2, 5, 10, 15 and 20 °C are recommended in this study to avoid solid formation, which can, not only minimize the overall heat of CO2 absorption, but also mitigate fouling and blocking problems in stripper and tubes.
4. Conclusions
The following conclusions can be drawn from the results in this study.
(1) The contribution of individual reactions to the overall heat of CO2 absorption in chilled ammonia process (CAP) is modeling studied using Aspen Plus at temperatures between 2 and 40 °C. NH4HCO3(s) formation (R6) in low temperatures is dominant contributor for the overall heat of CO2 absorption at CO2 loading above 0.7 mol CO2/mol NH3.
(2) The overall heat of absorption in CAP first decreases and then increases quickly with increasing CO2 loading. The increase in heat of absorption is caused by the prominent heat release during the formation of NH4HCO3(s). The contribution of each individual reaction to overall heat of absorption can be controlled by adjusting the operation parameters, such as CO2 loading and temperature, to optimize overall heat of absorption in chilled NH3–CO2–H2O system.
(3) The main contributions to the heat of absorption of CO2 in CAP were from the water ionization (R1), NH2COO− formation (R5), solid NH4HCO3(s) formation (R6) and CO2 dissolution (R7) which quite differed from the MEA system. With CO2 loading > 0.5 mol CO2/mol NH3, (R5) changes from an exothermic reaction to an endothermic reaction, which can significantly reduce the absorption heat of the system. When temperature is lower than 20 °C, the CO2 loading is recommended to be around 0.6–0.7 mol CO2/mol NH3, so that the overall absorption heat is at a low state (less than 60 kJ mol−1 CO2). On the other hand, under this CO2 loading, the generation of solid NH4HCO3(s) (R6) can be avoided.
(4) The overall heat of CO2 absorption does not change much with temperature at low CO2 loading (less than 0.5 mol CO2/mol NH3). With a high CO2 loading (more than 0.7 mol CO2/mol NH3), the decrease in temperature has a negative effect on the heat of absorption.
(5) It should be better to consider the contributions from the liquid-phase nonideality in the model and the effect of other acid gases on the overall absorption heat by chilled ammonia process in our future works (e.g. the overall heat of absorption in chilled NH3–CO2–SO2–H2O system).
Conflicts of interest
There are no conflicts to declare.
Nomenclature
| K | Equilibrium constant |
| kH | Henry's law constant, Pa |
| T | Temperature, K |
| n | Number of moles |
| H | Enthalpy, J mol−1 |
| R | Gas constant, J mol−1 K−1 |
| E | Extent and direction of each reaction |
| f | Fugacity |
Subscripts
| k | Reaction number |
| m | Molality basis |
| x | Mole fraction basis |
| i | Key species i |
| tot | Total amount of CO2 |
| abs | Absorption |
Greek letters
| Δ | Change |
| ∑ | Summation |
| φ | Fugacity coefficient |
| γ | Activity coefficient |
Superscript
| F | Final state |
| I | Initial state |
Acknowledgements
The authors express their gratitude to China Scholarship Council (CSC No. 201606050050) for the financial support. This study is also supported by Project of Cutting-edge Technological Innovation in New Materials and New Metallurgical Technologies (2019CDXYCL0031) and Chongqing Key Technology Innovation of Industries (cstc2016zdcy-ztzx20006). The authors appreciate Dr Haiming Wang for review.
References
- I. Iliuta, F. Bougie and M. C. Iliuta, AIChE J., 2015, 61, 955–971 CrossRef CAS.
- IPCC, Intergovernmental Panel on Climate Change Fourth Assessment Report, WMO, Geneva, 2007 Search PubMed.
- Z. Tan, Air pollution and greenhouse gases: from basic concepts to engineering applications for air emission control, Springer, 2014 Search PubMed.
- E. S. Rubin, H. Mantripragada, A. Marks, P. Versteeg and J. Kitchin, Prog. Energy Combust. Sci., 2012, 38, 630–671 CrossRef CAS.
- B. Metz, Carbon dioxide capture and storage: special report of the intergovernmental panel on climate change, Cambridge University Press, 2005 Search PubMed.
- R. Naim, A. F. Ismail, T. Matsuura, I. A. Rudaini and S. Abdullah, RSC Adv., 2018, 8, 3556–3563 RSC.
- A. Garcia-Abuin, D. Gomez-Diaz, J. M. Navaza and A. Rumbo, AIChE J., 2014, 60, 1098–1106 CrossRef CAS.
- F. A. Tobiesen, H. F. Svendsen and O. Juliussen, AIChE J., 2007, 53, 846–865 CrossRef CAS.
- B. Das, B. Deogam and B. Mandal, RSC Adv., 2017, 7, 21518–21530 RSC.
- G. Puxty, R. Rowland and M. Attalla, Chem. Eng. Sci., 2010, 65, 915–922 CrossRef CAS.
- M. Afkhamipour and M. Mofarahi, RSC Adv., 2017, 7, 17857–17872 RSC.
- M. Wang, M. Wang, N. Rao, J. Li and J. Li, RSC Adv., 2018, 8, 1987–1992 RSC.
- B. A. Oyenekan and G. T. Rochelle, AIChE J., 2007, 53, 3144–3154 CrossRef CAS.
- I. Kim and H. F. Svendsen, Ind. Eng. Chem. Res., 2007, 46, 5803–5809 CrossRef CAS.
- H. Arcis, Y. Coulier and J.-Y. Coxam, Environ. Sci. Technol., 2015, 50, 489–495 CrossRef PubMed.
- J. P. Ciferno, P. DiPietro and T. Tarka, An economic scoping study for CO2 capture using aqueous ammonia, National Energy Technology Laboratory, US Department of Energy, Pittsburgh, PA, 2005 Search PubMed.
- H. Bai and A. C. Yeh, Ind. Eng. Chem. Res., 1997, 36, 2490–2493 CrossRef CAS.
- G. Qi, S. Wang, Z. Xu, B. Zhao and C. Chen, Int. J. Greenhouse Gas Control, 2015, 41, 60–67 CrossRef CAS.
- J. Li, K. Cheng, E. Croiset, W. A. Anderson, Q. Li and Z. Tan, Int. J. Greenhouse Gas Control, 2017, 63, 442–448 CrossRef CAS.
- J. Liu, S. Wang, H. F. Svendsen, M. U. Idrees, I. Kim and C. Chen, Int. J. Greenhouse Gas Control, 2012, 9, 148–159 CrossRef CAS.
- F. Qin, S. Wang, I. Kim, H. F. Svendsen and C. Chen, Int. J. Greenhouse Gas Control, 2011, 5, 405–412 CrossRef CAS.
- General Electric Technology GmbH, US Pat., US-7641717-B2, 2012.
- C.-u. Bak, M. Asif and W.-S. Kim, Chem. Eng. J., 2015, 265, 1–8 CrossRef CAS.
- H. Yu, G. Qi, S. Wang, S. Morgan, A. Allport, A. Cottrell, T. Do, J. McGregor, L. Wardhaugh and P. Feron, Int. J. Greenhouse Gas Control, 2012, 10, 15–25 CrossRef CAS.
- Y. F. Diao, X. Y. Zheng, B. S. He, C. H. Chen and X. C. Xu, Energy Convers. Manage., 2004, 45, 2283–2296 CrossRef CAS.
- P. Versteeg and E. S. Rubin, Int. J. Greenhouse Gas Control, 2011, 5, 1596–1605 CrossRef CAS.
- I. Kim, K. A. Hoff, E. T. Hessen, T. Haug-Warberg and H. F. Svendsen, Chem. Eng. Sci., 2009, 64, 2027–2038 CrossRef CAS.
- G. Qi and S. Wang, Appl. Energy, 2017, 191, 549–558 CrossRef CAS.
- P. M. Mathias, S. Reddy and J. P. O'Connell, Energy Procedia, 2009, 1, 1227–1234 CrossRef CAS.
- V. Darde, K. Thomsen, W. J. Van Well and E. H. Stenby, Int. J. Greenhouse Gas Control, 2010, 4, 131–136 CrossRef CAS.
- H. Jilvero, K.-J. Jens, F. Normann, K. Andersson, M. Halstensen, D. Eimer and F. Johnsson, Fluid Phase Equilib., 2015, 385, 237–247 CrossRef CAS.
- F. Kurz, B. Rumpf and G. Maurer, Fluid Phase Equilib., 1995, 104, 261–275 CrossRef CAS.
- K. Thomsen and P. Rasmussen, Chem. Eng. Sci., 1999, 54, 1787–1802 CrossRef CAS.
- C. C. Chen, H. I. Britt, J. Boston and L. Evans, AIChE J., 1982, 28, 588–596 CrossRef CAS.
- V. Gudjonsdottir, C. I. Ferreira, G. Rexwinkel and A. A. Kiss, Energy, 2017, 124, 531–542 CrossRef CAS.
- P. M. Mathias, S. Reddy and J. P. O'Connell, Int. J. Greenhouse Gas Control, 2010, 4, 174–179 CrossRef CAS.
- H. F. Svendsen, E. T. Hessen and T. Mejdell, Chem. Eng. J., 2011, 171, 718–724 CrossRef CAS.
- P. Atkins and J. d. Paula, Physical Chemistry, WH Freeman, Gordonsville, 8th edn, 2006 Search PubMed.
- A. E. Sherwood and J. M. Prausnitz, AIChE J., 1962, 8, 519–521 CrossRef CAS.
- P. M. Mathias and J. P. O'Connell, Ind. Eng. Chem. Res., 2012, 51, 5090–5097 CrossRef CAS.
- R. H. Weiland, T. Chakravarty and A. E. Mather, Ind. Eng. Chem. Res., 1993, 32, 1419–1430 CrossRef CAS.
- A. Morteza, M. Masoud and L. Chang-Ha, Fluid Phase Equilib., 2018, 473, 50–69 CrossRef.
- G. Qi, S. Wang, W. Lu, J. Yu and C. Chen, Fluid Phase Equilib., 2015, 386, 47–55 CrossRef CAS.
- U. Goppert and G. Maurer, Fluid Phase Equilib., 1988, 41, 153–185 CrossRef.
- N. Wen and M. H. Brooker, J. Phys. Chem., 1995, 99, 359–368 CrossRef CAS.
- M. Trypuc and U. Kiełkowska, J. Chem. Eng. Data, 1996, 41, 1005–1007 CrossRef CAS.
- K. G. Denbigh, The Principles of Chemical Equilibrium: With Applications in Chemistry and Chemical Engineering, Cambridge University Press, Cambridge, 4 edn, 1981 Search PubMed.
- D. M. Austgen, G. T. Rochelle, X. Peng and C. C. Chen, Ind. Eng. Chem. Res., 1989, 28, 1060–1073 CrossRef CAS.
- G. Pazuki, H. Pahlevanzadeh and A. M. Ahooei, Fluid Phase Equilib., 2006, 242, 57–64 CrossRef CAS.
- D. Beutier and H. Renon, Ind. Eng. Chem. Process Des. Dev., 1978, 17, 220–230 CrossRef CAS.
- J. L. Oscarson, H. K. Grimsrud and S. E. Gillespie, Thermochim. Acta, 2000, 351, 9–20 CrossRef CAS.
- T. Edwards, G. Maurer, J. Newman and J. Prausnitz, AIChE J., 1978, 24, 966–976 CrossRef CAS.
- K. Kawazuishi and J. M. Prausnitz, Ind. Eng. Chem. Res., 1987, 26, 1482–1485 CrossRef CAS.
- S. Clegg and P. Brimblecombe, J. Phys. Chem., 1989, 93, 7237–7248 CrossRef CAS.
- H. Que and C.-C. Chen, Ind. Eng. Chem. Res., 2011, 50, 11406–11421 CrossRef CAS.
- R. G. Bates and G. Pinching, J. Res. Natl. Bur. Stand., 1949, 42, 419–430 CrossRef CAS.
- D. Van Krevelen, P. Hoftijzer and F. Huntjens, Recl. Trav. Chim. Pays-Bas, 1949, 68, 191–216 CrossRef.
- H. Leng, J. Gao, M. He, M. Xie, Q. Du, R. Sun and S. Wu, J. Harbin Inst. Technol., 2016, 23, 75–81 Search PubMed.
- J. Yu and S. Wang, Int. J. Greenhouse Gas Control, 2015, 43, 33–45 CrossRef CAS.
- U. Lichtfers and B. Rumpf, Chem. Ing. Tech., 2000, 72, 1526–1530 CrossRef CAS.
- F. Mani, M. Peruzzini and P. Stoppioni, Green Chem., 2006, 8, 995–1000 RSC.
- E. Jänecke, Ber. Bunsen-Ges., 1929, 35, 716–728 Search PubMed.
- M. Trypuć and U. Kiełkowska, J. Chem. Eng. Data, 1998, 43, 201–204 CrossRef.
- I. Kim, PhD, Norwegian University of Science and Technology, Trondheim, Norway, 2009.
|
| This journal is © The Royal Society of Chemistry 2019 |
Click here to see how this site uses Cookies. View our privacy policy here.  Open Access Article
 ab,
Lan Liua,
Eric Croisetb,
Zhongchao Tanb,
Qingcai Liua and
Jian Yang*a

![[thin space (1/6-em)]](https://www.rsc.org/images/entities/char_2009.gif) ln
ln![[thin space (1/6-em)]](https://www.rsc.org/images/entities/char_2009.gif) K
K


![[thin space (1/6-em)]](https://www.rsc.org/images/entities/char_2009.gif) Km = ln
Km = ln![[thin space (1/6-em)]](https://www.rsc.org/images/entities/char_2009.gif) Kx + Δn
Kx + Δn![[thin space (1/6-em)]](https://www.rsc.org/images/entities/char_2009.gif) ln(55.51)
ln(55.51)
![[thin space (1/6-em)]](https://www.rsc.org/images/entities/char_2009.gif) K4 is given by Edwards et al.,52 Kawazuishi and Prausnitz,53 Pazuki et al.,49 Clegg and Brimblecombe,54 and Aspen Plus (V7.2). The corresponding enthalpy change, −ΔHNH3, calculated by eqn (8) are shown in Fig. 2(b) and compared with the experimental data reported by Bates and Pinching.56 All equilibrium constants has similar values and tendency except that reported by Pazuki et al.49 at different temperatures. In Fig. 2(b), the corresponding enthalpy change calculated by Edwards et al.52 and Aspen Plus (V7.2) have the same values. The enthalpy change calculated by Kawazuishi and Prausnitz53 and Pazuki et al.49 have similar values as well. However, the enthalpy change predicted by Clegg and Brimblecombe54 has little difference with the others'. Besides, the prediction of enthalpy change by Edwards et al.52 is the closest to the experimental data. It should be noted that Edwards et al.52 and Aspen Plus predict the same values. The black solid line overlaps with the red dotted line in Fig. 2; therefore, only four curves are seen in Fig. 2. The similar method is applied to other reactions. The default equilibrium constant from Aspen Plus (V7.2) databank is used for NH4HCO3(s) formation (R6). The constants C1, C2, C3 and C4 for each reaction are summarized in Table 3. One may notice that the values of the parameters for the CO32− (R3), NH3 (R4) and NH2COO− formation (R5) in this paper are different from those in the original references, because they are converted using eqn (18) to mole fraction basis.
K4 is given by Edwards et al.,52 Kawazuishi and Prausnitz,53 Pazuki et al.,49 Clegg and Brimblecombe,54 and Aspen Plus (V7.2). The corresponding enthalpy change, −ΔHNH3, calculated by eqn (8) are shown in Fig. 2(b) and compared with the experimental data reported by Bates and Pinching.56 All equilibrium constants has similar values and tendency except that reported by Pazuki et al.49 at different temperatures. In Fig. 2(b), the corresponding enthalpy change calculated by Edwards et al.52 and Aspen Plus (V7.2) have the same values. The enthalpy change calculated by Kawazuishi and Prausnitz53 and Pazuki et al.49 have similar values as well. However, the enthalpy change predicted by Clegg and Brimblecombe54 has little difference with the others'. Besides, the prediction of enthalpy change by Edwards et al.52 is the closest to the experimental data. It should be noted that Edwards et al.52 and Aspen Plus predict the same values. The black solid line overlaps with the red dotted line in Fig. 2; therefore, only four curves are seen in Fig. 2. The similar method is applied to other reactions. The default equilibrium constant from Aspen Plus (V7.2) databank is used for NH4HCO3(s) formation (R6). The constants C1, C2, C3 and C4 for each reaction are summarized in Table 3. One may notice that the values of the parameters for the CO32− (R3), NH3 (R4) and NH2COO− formation (R5) in this paper are different from those in the original references, because they are converted using eqn (18) to mole fraction basis.

![[thin space (1/6-em)]](https://www.rsc.org/images/entities/char_2009.gif) K4 and (b) corresponding −ΔHNH3 as a function of temperature for NH3 protonation in the water (R4).
K4 and (b) corresponding −ΔHNH3 as a function of temperature for NH3 protonation in the water (R4).


