 Open Access Article
Optimized synthesis of novel hydrogel for the adsorption of copper and cobalt ions in wastewater
Wei Zhang,
Lishuang Hu *,
Shuangqi Hu and
Yang Liu
School of Environmental and Safety Engineering, North University of China, 030051 Taiyuan, China. E-mail: hulish766@foxmail.com; Fax: +86 03513920504; Tel: +86 03513920504
First published on 22nd May 2019
Abstract
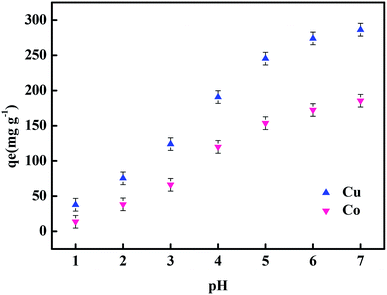
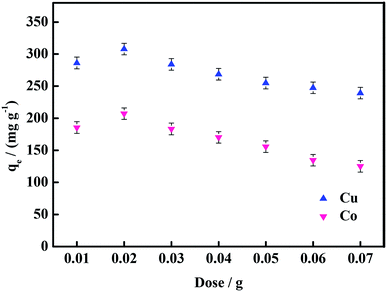
Metal ions in wastewater endanger the environment and even human life. In this study, an optimized method was used to synthesize an excellent hydrogel to treat these metal ions. The samples were characterized by Fourier transform infrared spectroscopy (FTIR), scanning electron microscopy (SEM) and thermogravimetric analysis (TGA), and applied to treat the Cu(II) and Co(II) ions in wastewater. In the adsorption experiment, the influential factors such as pH, adsorption time, adsorbent dosage and concentration of heavy metal ions and regeneration efficiency were evaluated, and the adsorption kinetics, isotherms and thermodynamics were studied. The orthogonal optimization results show that the best condition for synthesis was when the degree of neutralization of acrylic acid (A) was 70%, the quantity of glucose (B) was 0.2 g, the quantity of chitosan (C) was 0.05 g, and the quantity of initiator (D) was 0.03 g. The influence of the four factors was in the order D > B > C > A. The adsorption performance was optimal under neutral conditions and the dosage of 0.02 g adsorbent was chosen as the best. Experiments show that the composite hydrogels exhibited excellent performance under optimal conditions: at 20 °C and pH = 7, the adsorption capacity of 100 mg L−1 of Cu(II) by 0.01 g hydrogel was 286 mg g−1. The adsorption process of heavy metal ions by hydrogels conforms to pseudo-second-order kinetics and Langmuir isotherm model, which indicate a spontaneous endothermic reaction. Moreover, after five cycles, the removal rates of Cu(II) and Co(II) were 81% and 74.8%, respectively.
1. Introduction
In recent years, with the rapid development of industries, the use of metal minerals has become more and more frequent.1–5 A large number of harmful substances are constantly entering the water bodies due to human activities, and water pollution is becoming increasingly serious.6–13 Among them, due to the extensive toxic effects of heavy metal pollutants, water pollution has caused widespread concern. Therefore, the removal of heavy metal ions has become one of the hot topics in the scientific community.14,15At present, the treatment of heavy metal ions in wastewater is being studied by many scholars in various countries. According to different research areas and mechanisms of the treatment measures, the methods can be roughly divided into chemical treatment, physical treatment and biological treatment.16–18 At present, the most effective environmental treatment method is the adsorption method. Adsorptive materials are generally divided into inorganic, organic and composite materials, of which composite materials are the most widely used. Compared with inorganic materials and organic materials, the composite materials have better adsorption performance that is stable. A new type of composite material, hydrogel, can constitute many organic materials, and its super absorbency bestows it with a great potential in water treatment.19,20 Badawi18 et al. synthesized a novel hydrogel by blending tannic acid with chitosan and studied the adsorption of Al(III) and Pb(II). The results were very significant. Karthik21 et al. used polyaniline grafted in chitosan to prepare a hydrogel and studied the adsorption of Pb(II) and Cd(II). Misra22 et al. used iminodiacetic acid functionalization to develop a hydrogel from a copolymer of styrene and divinylbenzene, and investigated its adsorption capacity towards Ni(II), Pb(II) and Cd(II). Zhou23 et al. studied the cross-linking of starch and polyacrylic acid in detail, and then, modified it by using triethylenetetramine to obtain a new amino starch/polyacrylic acid adsorbent. The adsorption capacity towards cadmium ions was found to be as high as 256.4 mg g−1. Zhou24 et al. synthesized a monolithic super macroporous hydrogel by thermally inducing high internal phase emulsion polymerization to graft acrylic acid onto the chitosan backbone. The hydrogel was found to have higher adsorption rates for Cu(II) and Pb(II) with high adsorption capacities of 302.01 mg g−1 and 611.94 mg g−1, respectively, and could be recycled five times. Karawi25 et al. used potassium persulfate as an initiator to copolymerize acrylamide by grafting it onto chitosan to synthesize a chitosan–polyacrylamide complex. The factors influencing copolymerization such as initiator concentration, acrylamide monomer to chitosan ratio and reaction temperature were optimized, and the adsorption performance of chitosan–polyacrylamide complex towards Cu(II) was investigated.26
Being a long-chain polymer compound, chitosan contains a large number of functional groups such as hydroxyl groups, ethylamino groups, electron-rich pyran rings and bridge oxygens. Therefore, chitosan has a large number of hydrogen bonds in the molecule and between molecules,27–35 thereby forming a network-like structure with stable chelation of metal ions. These properties make it suitable to be often used with monomers to synthesize hydrogels.36,37 The most widely distributed monosaccharide in nature, glucose, has the advantages of abundant resources, low price and good biodegradability. Its molecular structure contains a large number of hydroxyl groups that imparts strong hydrophilicity. These characteristics make it a potential raw material for the preparation of gel adsorption materials.38–44 In this study, chitosan, glucose, and acrylic acid were used as monomers, potassium persulfate was used as the initiator, and N′N-methylenebisacrylamide was used as the crosslinking agent. An ultrasonication-assisted method was used to prepare the new hydrogels and was optimized by the orthogonal method. The samples were characterized by Fourier transform infrared spectroscopy (FTIR), scanning electron microscopy (SEM) and thermogravimetric analysis (TGA). The adsorption of Cu(II) and Co(II) ions in wastewater was carried out using the prepared new hydrogel. In the adsorption experiment, factors such as the pH value, adsorption time, adsorbent dosage, heavy metal ion concentration and recycling capacity were investigated, and the adsorption kinetics and thermodynamic properties were studied.
2. Experimental
2.1 Materials
Acrylic acid (Sinopharm Chemical Reagent Co., Ltd.), chitosan (Sinopharm Chemical Reagent Co., Ltd.) and glucose (Sinopharm Chemical Reagent Co., Ltd.) were used as the polymer monomers. Potassium persulfate (Sinopharm Chemical Reagent Co., Ltd.) was used as the initiator. NN′-Methylenebisacrylamide (Sinopharm Chemical Reagent Co., Ltd, Shanghai, China) was the cross-linking agent. Other reagents such as sodium hydroxide, ethanol, copper nitrate pentahydrate and cobalt nitrate tetrahydrate were purchased from Shanghai McLean Biochemical Co., Ltd.2.2 Optimization of hydrogel synthesis
Of the many factors affecting the properties of hydrogels during their synthesis, the following four factors are the most important: the neutralization degree of acrylic acid (A), the quantity of glucose used in polymerization (B), the quantity of chitosan used in polymerization (C) and the quantity of initiator (D). There are many drawbacks in optimizing these factors using the traditional single-factor variable method.45 The numerous experiments and tedious operation will increase the errors in the experimental results. Orthogonal optimization can balance sampling within the range of factors so that each experiment has a strong representative. Because each orthogonal experiment is the best choice point, which guarantees the accuracy of the experimental results and greatly reduces the number of experiments, these experiments can often better achieve the experimental purpose.Sodium hydroxide was dissolved in water and neutralized in an ice bath with 5 mL acrylic acid. After neutralization, chitosan, glucose and potassium persulfate were added and dissolved by stirring with a glass rod. After dissolution, the mixture was heated to 70 °C for 3 h in an ultrasound apparatus. Then, the unreacted substances were soaked and cleaned with anhydrous ethanol. Finally, the hydrogels were obtained by vacuum drying. The quantity of the substances involved are listed in the following orthogonal tables (Table 1).
| Factors | A (%) | B (g) | C (g) | D (g) |
|---|---|---|---|---|
| 1 | 60 | 0.1 | 0.05 | 0.01 |
| 2 | 60 | 0.2 | 0.1 | 0.03 |
| 3 | 60 | 0.3 | 0.15 | 0.05 |
| 4 | 70 | 0.1 | 0.1 | 0.05 |
| 5 | 70 | 0.2 | 0.15 | 0.01 |
| 6 | 70 | 0.3 | 0.05 | 0.03 |
| 7 | 80 | 0.1 | 0.15 | 0.03 |
| 8 | 80 | 0.2 | 0.1 | 0.05 |
| 9 | 80 | 0.3 | 0.05 | 0.01 |
2.3 Experimental synthesis mechanism
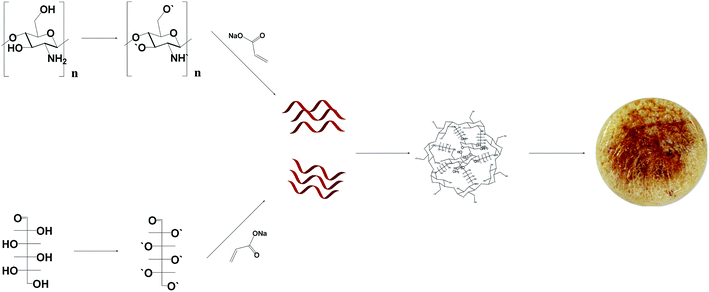
The active sites of chitosan and glucose (–OH, –COOH, –NH2) are prone to cleavage under the action of heat and initiator. First, the initiator was dissolved in water to produce sulfate radicals, which promote the production of OH˙ from water molecules. OH˙ attacks the –OH, –COOH, –NH2 and –CH3 groups on chitosan and glucose, which in turn dehydrogenates and creates new free radical sites. Acrylic acid further attacks these sites one after the other to produce polymeric chains, and finally, they are joined together by the action of a cross-linker to form a polymer. The unreacted monomer was washed away with distilled water to obtain the hydrogel (Fig. 1).2.4 Characterization
For the determination of functional groups in the samples, FTIR spectra of the samples were recorded on a FTIR-850 spectrometer from Tianjin Gangdong Company. The wavenumbers ranged from 4000 to 400 cm−1. The morphology of the samples was analyzed using JSM-7800F, Japan Electronics Corporation. The samples were analyzed by thermogravimetric analysis (TGA) with an STA 449C integrated thermal analyzer. The temperature was varied from room temperature to 800 °C.2.5 Adsorption experiment
The adsorption performance of the hydrogels, in this work, was studied from five aspects: temperature, dosage of hydrogel, adsorption time, concentration of heavy metal ions and pH. At a certain temperature (20–60 °C), 50 mL solution of 100 mg L−1 heavy metal ion (Co(II), Cu(II)) concentration was evaluated by adding 0.01 g hydrogel and allowing to reach the adsorption equilibrium. To 50 mL of 100 mg L−1 heavy metal ion (Co(II), Cu(II)) solution, a certain amount (0.01–0.06 g) of hydrogel was added. After reaching the adsorption equilibrium, the concentration of heavy metal ions was measured. The 0.01 g hydrogel sample was weighed and added into 50 mL of the 100 mg L−1 solution of heavy metal ions (Co(II), Cu(II)), and the concentrations of heavy metal ions were measured at 5 min, 20 min, 30 min, 60 min, 90 min, 120 min, 150 min and 180 min. To 50 mL of heavy metal ion solution with a certain concentration (100 mg L−1, 300 mg L−1, 500 mg L−1, 700 mg L−1, 900 mg L−1, or 1100 mg L−1), 0.01 g hydrogel was added, and then, the concentration of heavy metal ions after adsorption was measured. 0.01 g hydrogel sample was weighed and added into 50 mL of the 100 mg L−1 heavy metal ion (Co(II), Cu(II)) solution at a certain pH (1–7), and then, the concentration of heavy metal ions after adsorption was measured. The concentration of heavy metal ions was measured by a TAS-986 atomic absorption spectrophotometer. The following formula was used to calculate the adsorption capacity qe of the hydrogels.
 | (1) |
3. Results and discussion
3.1 Optimization of parameters
The optimal conditions from the orthogonal optimization table is A (70), B (0.2), C (0.05), and D (0.03) (Table 2). The influence of the four factors was in the order D > B > C > A. It can be seen from the results that the role of initiator was the most important. The initiation of chain reaction by the initiator had a great impact on the successful grafting of chitosan and glucose onto the hydrogel. Secondly, the influence of glucose, i.e., the hydroxyl groups on glucose had a great influence on the chelation of heavy metal ions, which affected the ability of the hydrogel to adsorb heavy metal ions. It can also be seen from the table that the addition of chitosan and the neutralization degree of acrylic acid also had some influence on the hydrogel adsorption performance. The hydrogel was synthesized according to the orthogonal experimental results. At 20 °C and pH = 7, the adsorption of 100 mg L−1 Cu(II) solution with 0.01 g hydrogel was 286 mg g−1.| Factors | A (%) | B (g) | C (g) | D (g) | Result (qe/mg g−1) |
|---|---|---|---|---|---|
| 1 | 60 | 0.1 | 0.05 | 0.01 | 220 |
| 2 | 60 | 0.2 | 0.1 | 0.03 | 240 |
| 3 | 60 | 0.3 | 0.15 | 0.05 | 193 |
| 4 | 70 | 0.1 | 0.1 | 0.05 | 189 |
| 5 | 70 | 0.2 | 0.15 | 0.01 | 250 |
| 6 | 70 | 0.3 | 0.05 | 0.03 | 269 |
| 7 | 80 | 0.1 | 0.15 | 0.03 | 200 |
| 8 | 80 | 0.2 | 0.1 | 0.05 | 215 |
| 9 | 80 | 0.3 | 0.05 | 0.01 | 234 |
| K1 | 217 | 203 | 234 | 234 | |
| K2 | 236 | 235 | 221 | 236 | |
| K3 | 216 | 232 | 214 | 199 | |
| Range | 19 | 32 | 20 | 37 |
3.2 FTIR
The functional groups of each substance were determined by FTIR spectroscopy to determine whether the hydrogels were successfully grafted with glucose and chitosan. It can be seen from spectrum (a) of Fig. 2 that –OH, –NH2 and C–O–C, which are the functional groups on chitosan, appeared in the infrared spectrum. Corresponding absorption peaks also appeared at the respective positions in spectrum (c) of Fig. 2, indicating that chitosan had been grafted onto the hydrogel. Glucose is a polyhydroxy compound having a –CHO group, and a corresponding absorption peak appeared in spectrum (b) shown in Fig. 2. In the infrared spectrum of the hydrogel, the absorption peak corresponding to the –CHO group was found, which proved that glucose was successfully grafted onto the hydrogel. The hydrogel was applied to remove Cu(II) and Co(II) in wastewater. Comparing (c), (d), and (e) spectra in Fig. 2, it was found that the absorption peaks corresponding to –OH in Cu-hydrogel and Co-hydrogel had shifted. The absorption peaks corresponding to –NH2 in Cu-hydrogel and Co-hydrogel were shifted or merged with other absorption peaks. The direct cause of these changes in the absorption peak positions is the sequestration of heavy metal ions with the O and N atoms in these functional groups.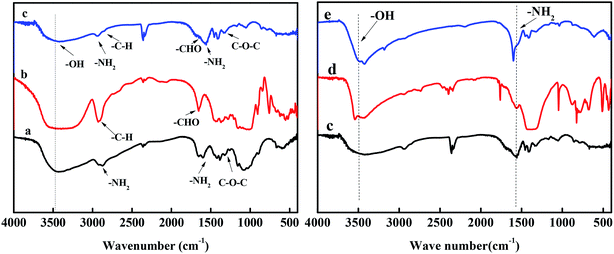 | ||
| Fig. 2 FTIR spectra of (a) chitosan, (b) glucose, (c) hydrogel, (d) Cu-hydrogel and (e) Co-hydrogel. | ||
3.3 SEM
Hydrogel is a kind of polymer network system, which is soft in nature, can keep a certain shape and absorb a large amount of water.44 In our experiment, the hydrogel was placed in a vacuum drying chamber to dry and dehydrate. The water molecules evaporated from the inside of the hydrogel and a mesoporous structure was formed on the surface of the hydrogel. Due to the difference in water content at different positions of the hydrogel, the difference in water loss during the drying process leads to wrinkles on the surface of hydrogels.46,47From Fig. 3A and B, it is clear that there were many holes of different sizes and folds in some positions on the surface of the hydrogel. These structures of the hydrogel provide more active sites for adsorption, which is one of the reasons why hydrogels are superior to other inorganic materials as adsorbents.
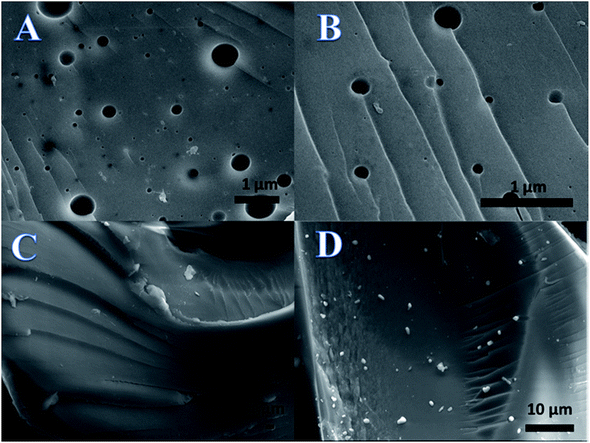 | ||
| Fig. 3 Scanning electron microscopy images of the hydrogel (A and B) before and after adsorbing (C) Cu ions and (D) Co ions. | ||
In Fig. 3C and D, it is seen that there were no holes on the surface of the hydrogel. A thin film appeared on the surface of the hydrogels. After analysis, these thin films were found to be layers of Cu ions as seen in Fig. 3C and Co ions as seen in Fig. 3D. The disappearance of pores on the hydrogel and the thin metal films indicate that the hydrogel adsorbs Cu and Co ions.
3.4 TGA
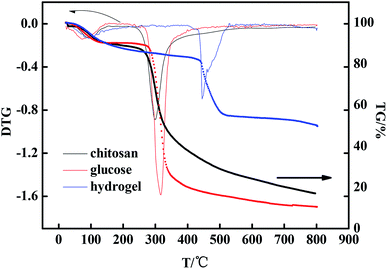
From the thermogravimetric maps of the three substances in Fig. 4, it can be seen that there were two processes. The first one occurred at about 100 °C; this process was the volatilization of water present in the substance, which was full of crystalline water. The second one was the thermal decomposition of the substance at higher temperatures.The volatilization rate of chitosan reached the maximum at 86 °C and that of glucose was at 71 °C, and the water loss rate was about 10%. The volatilization rate of water in the hydrogel reached its maximum at 93 °C. The reason for this change is the presence of crystalline water in hydrogels, which contain about 14% water. The high temperature decomposition of hydrogels was significantly delayed compared with that of chitosan and glucose. The maximum weight loss rate of chitosan occurred at 300 °C and that of glucose was at 314 °C. The thermal stability of the hydrogel was better than that of the former two. The hydrogel has a high thermal stability. The maximum weight loss rate of the hydrogel was 445 °C, and the final weight of the hydrogel remained at 50%.
3.5 Adsorption properties of GL/CS hydrogels
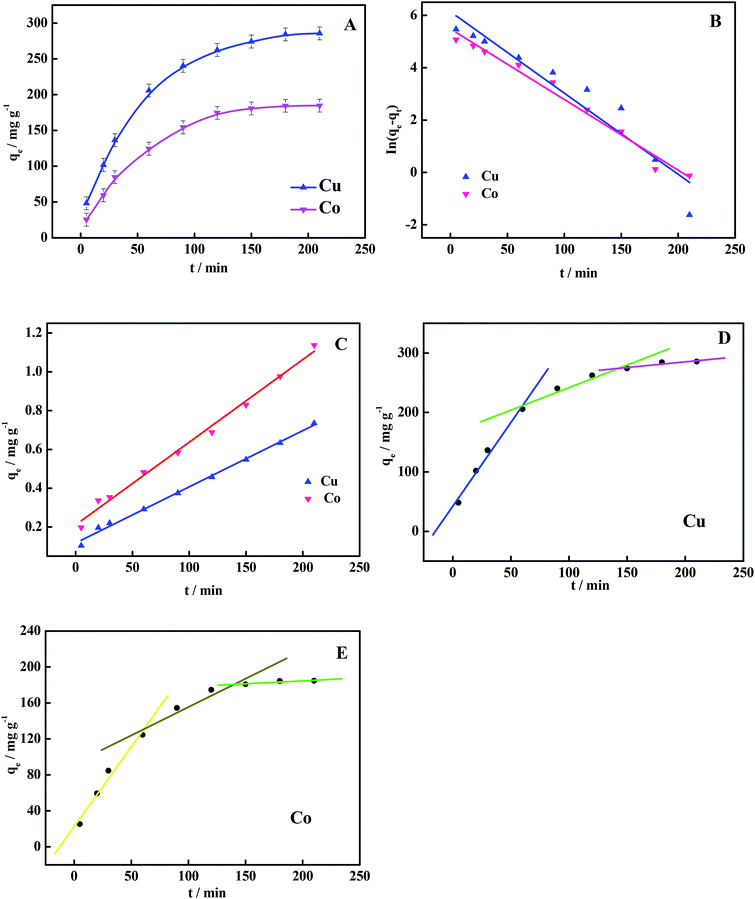 | ||
| Fig. 7 (A) Effect of time on adsorption, and fitting of (B) pseudo-first-order kinetic model, (C) pseudo-second-order kinetic model and (D and E) intraparticle diffusion models. | ||
Adsorption kinetics is an important aspect of the adsorption process, and the kinetic model controls the mechanism of the adsorption process. The pseudo-first-order and pseudo-second-order kinetic models are discussed below using eqn (2) and (3).
The equation for the pseudo-first-order kinetic model is as follows:
 | (2) |
The equation for the pseudo-second-order kinetic model is as follows:
 | (3) |
 (mg g−1) is the theoretical equilibrium adsorption capacity, t (min) is the adsorption time, and k1 (min−1) and k2 (g mg−1 min−1) are the rate constants for the first-order and second-order kinetic models, respectively.
| qt = kpt1/2 + C | (4) |
Fitting parameters of the three kinetic models are listed in Table 3. Firstly, for the pseudo-first-order and pseudo-second-order kinetic models, it can be seen that the pseudo-second-order kinetic model was more consistent with the actual adsorption process. Its correlation coefficient (R2 > 0.99) was better than that of the pseudo-first-order kinetic model (R2 < 0.99). It can be seen from the intraparticle diffusion parameters that the adsorption rate was controlled not only by intraparticle diffusion, but also by other steps.52,53
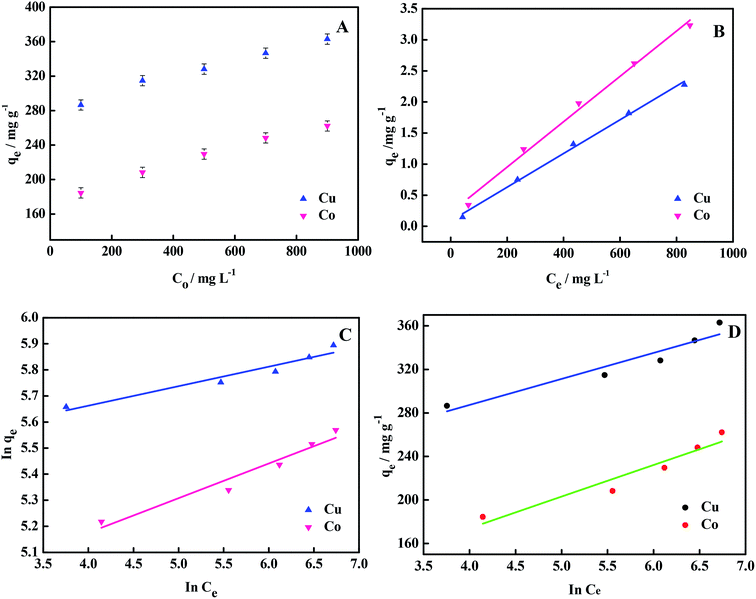
Isotherm is an important factor for understanding the adsorption efficiency and exploring the adsorption mechanism. The adsorption isotherm explores the relationship between the adsorption capacity and concentration at adsorption equilibrium, that is to say, adsorption capacity is only related to the equilibrium concentration at constant temperature. Following is the discussion on the Langmuir adsorption isotherm model and Freundlich adsorption isotherm model, and understanding the adsorption mechanism.
The linear Langmuir adsorption isotherm equation is as follows:
 | (5) |
The linear Freundlich adsorption isotherm equation is as follows:
 | (6) |
Temkin adsorption isotherm model is based on the interaction between the adsorbent and the adsorbate. It assumes that the adsorption heat decreases linearly with the increase in the degree of adsorption, and the linear expression is as follows:
qe = B![[thin space (1/6-em)]](https://www.rsc.org/images/entities/char_2009.gif) In In![[thin space (1/6-em)]](https://www.rsc.org/images/entities/char_2009.gif) A + B A + B![[thin space (1/6-em)]](https://www.rsc.org/images/entities/char_2009.gif) In In![[thin space (1/6-em)]](https://www.rsc.org/images/entities/char_2009.gif) Ce Ce
| (7) |
Fitting results for the three isotherm models are listed in Table 4. Different isotherms have different adsorption mechanisms and models. From Table 4, it can be seen that the process by which the hydrogel adsorbs the two metal ions was similar to that of the Langmuir model. From the data point of view, the correlation coefficient for Langmuir model is the largest, and the experimental data are similar to the model described by Langmuir. From the theoretical view point, the theoretical adsorption capacity calculated using the Langmuir model is the closest to the experimental results. The results of isotherm model fitting are consistent with those obtained above from kinetic modeling studies and FTIR spectroscopy. The adsorption of heavy metal ions by the hydrogel is a chemical adsorption process.19,54
| Parameters | Cu2+ | Co2+ |
|---|---|---|
| Langmuir | ||
| qm,L (mg g−1) | 369.1 | 273.9 |
| KL (L mg−1) | 0.032 | 0.016 |
| R2 | 0.995 | 0.991 |
| Freundlich | ||
| KF (L g−1) | 213.5 | 103.9 |
| 1/n | 0.075 | 0.133 |
| R2 | 0.919 | 0.937 |
| Temkin | ||
| A (mg L−1) | 3031 | 7.37 |
| B | 23.91 | 29.03 |
| R2 | 0.894 | 0.907 |
| ΔGθ = ΔHθ − TΔSθ | (8) |
 | (9) |
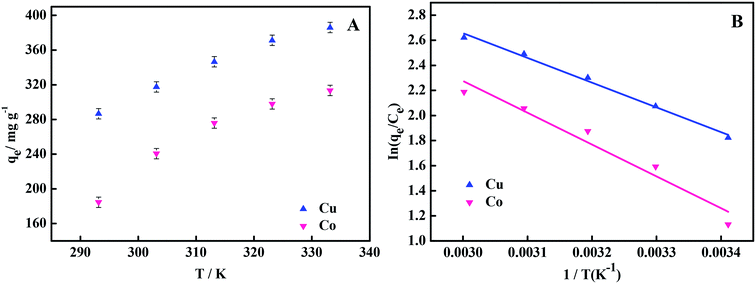 | ||
| Fig. 9 (A) Effect of temperature of heavy metal ions on adsorption properties of hydrogels and (B) thermodynamics study. | ||
| Thermodynamic parameters | ΔHθ (KJ mol−1) | ΔSθ (J mol−1 K−1) | ΔGθ (KJ mol−1) | ||||
|---|---|---|---|---|---|---|---|
| 293.15 K | 303.15 K | 313.15 K | 323.15 K | 333.15 K | |||
| Cu2+ | 21.09 | 82.20 | −3.01 | −3.83 | −4.65 | −5.47 | −6.29 |
| Co2+ | 16.39 | 71.26 | −4.51 | −5.22 | −5.93 | −6.64 | −7.35 |
It can be seen from Table 5 that the ΔGθ values were negative and decreased with the increase in temperature, which indicates that the adsorption was a spontaneous process and the increase in temperature was conducive to adsorption, and is consistent with the trend of qe vs. T. The positive values for ΔHθ indicate that the adsorption process is endothermic. The fitting of thermodynamic data shows that the adsorption process of heavy metal ions by the hydrogel is a spontaneous endothermic process.
3.6 Regeneration capacity
As seen from Fig. 10A, the regeneration efficiencies for Cu(II) and Co(II) adsorption were 81% and 74.8%, respectively, after five cycles, and the loss rate was medium, which means that the hydrogel can be recycled.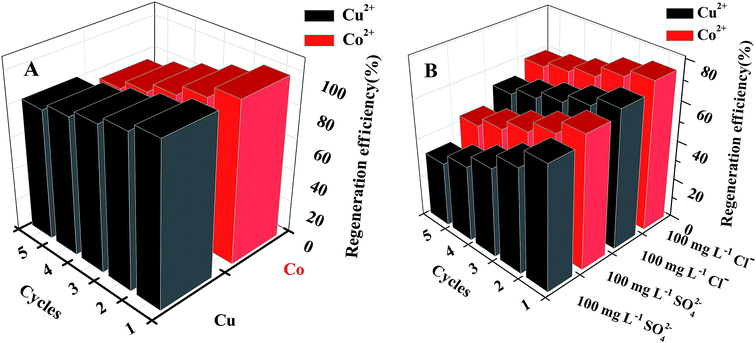 | ||
| Fig. 10 Hydrogel regeneration efficiency after the adsorption of Cu(II) and Co(II) (A) and (B) in solutions with different anions. | ||
When there were other anions in the solution, the cyclic regeneration of hydrogels decreased. The presence of anions obviously affected the adsorption performance of the hydrogel, probably due to the competition for adsorption sites between the anions and heavy metal ions.55
Table 6 shows the comparison of adsorption properties of some adsorbents. It can be seen from the table that hydrogel adsorbents have excellent adsorption properties for Cu and Co. Combined with their recycling ability, the study of hydrogel adsorbents increases the possibility of the application of macromolecule resins for heavy metal ion adsorption.
3.7 Adsorption mechanism
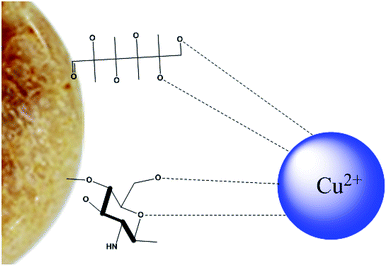
The mechanism of adsorption of heavy metal ions by hydrogel composites is shown in Fig. 11. Hydrogel composites have many hydroxyl, amino and carboxyl groups, which make the surface of the hydrogel negatively charged.56 Due to electrostatic attraction, the hydrogels and heavy metal ions attract each other, and the copper ions coordinate with these groups.4. Conclusions
In this study, we successfully synthesized a high performance hydrogel with porous structure and excellent adsorption performance using chitosan and glucose for the treatment of heavy metal ions Cu(II) and Co(II) in wastewater. The optimal hydrogel synthesis conditions from the orthogonal optimization experiment was A (70), B (0.2), C (0.05), and D (0.03). The influence of the four factors followed the order of D > B > C > A. The role of initiator was the most important. The TGA results showed that the hydrogel had high thermal stability. The maximum weight loss rate of the hydrogel was at 445 °C and the final weight of hydrogel remained at 50%. Based on the adsorption experiments, the adsorption performance was optimal under neutral conditions, and 0.02 g of adsorbent was chosen as the best dosage. The process of adsorbing Cu(II) and Co(II) ions follows a pseudo second-order kinetic model and a Langmuir isotherm model, which indicates a spontaneous endothermic reaction. In addition, the hydrogel adsorbent could be recycled, and the regeneration efficiency after five cycles was over 70%.Conflicts of interest
There are no conflicts to declare.Acknowledgements
We gratefully acknowledge the Science Foundation of North University of China (No. XJJ2016012) for financial support of this research.References
- M. Al-Shannag, Z. Al-Qodah, K. Bani-Melhem, M. R. Qtaishat and M. Alkasrawi, Chem. Eng. J., 2015, 260, 749–756 CrossRef CAS.
- A. Chan, H. Salsali and E. McBean, ACS Sustainable Chem. Eng., 2013, 2, 130–137 CrossRef.
- J. Lu, Y. Li, S. Zhang and Y. Sun, J. Hazard. Mater., 2015, 286, 466–473 CrossRef CAS PubMed.
- A. Shah, S. Shahzad, A. Munir, M. N. Nadagouda, G. S. Khan, D. F. Shams, D. D. Dionysiou and U. A. Rana, Chem. Rev., 2016, 116, 6042–6074 CrossRef CAS PubMed.
- L. C. Shen, X. T. Nguyen and N. P. Hankins, Sep. Purif. Technol., 2015, 152, 101–107 CrossRef CAS.
- F. Fu and Q. Wang, J. Environ. Manage., 2011, 92, 407–418 CrossRef CAS PubMed.
- S. H. Kazemi, B. Karimi, S. A. Aghdam, H. Behzadnia and M. A. Kiani, RSC Adv., 2015, 5, 69032–69041 RSC.
- K. Y. Foo and B. H. Hameed, Chem. Eng. J., 2010, 156, 2–10 CrossRef CAS.
- J. Shin, Y. Kim, Y. M. Lim and Y. C. Nho, J. Appl. Polym. Sci., 2008, 107, 3179–3183 CrossRef CAS.
- T. Sakai, T. Matsunaga, Y. Yamamoto, C. Ito, R. Yoshida, S. Suzuki, N. Sasaki, M. Shibayama and U. I. Chung, Macromolecules, 2008, 41, 5379–5384 CrossRef CAS.
- X. Yi, Z. Xu, Y. Liu, X. Guo, M. Qu and X. Xu, RSC Adv., 2017, 7, 6278–6287 RSC.
- L. Passauer, M. Struch, S. Schuldt, J. Appelt, Y. Schneider, D. Jaros and H. Rohm, ACS Appl. Mater. Interfaces, 2012, 4, 5852 CrossRef CAS PubMed.
- M. Z. Jing, Y. Fu, X. Fei, J. Tian, H. Zhi, H. Y. Zhang, L. Q. Xu, X. Y. Wang and Y. Wang, Polym. Chem., 2017, 8, 3553–3559 RSC.
- M. Tan, T. Zhao, H. Huang and M. Guo, Polym. Chem., 2013, 4, 5570 RSC.
- A. J. M. Valente and O. Soderman, Adv. Colloid Interface Sci., 2014, 205, 156–176 CrossRef CAS PubMed.
- Y. Zang, Q. Yue, Y. Kan, L. Zhang and B. Gao, Ecotoxicol. Environ. Saf., 2018, 161, 467–473 CrossRef CAS PubMed.
- T. Garrison, J. C. Hower, A. E. Fryar and E. D'Angelo, Environ. Earth Sci., 2016, 75, 1–13 CrossRef CAS.
- M. A. Badawi, N. A. Negm, M. T. Abou Kana, H. H. Hefni and A. M. M. Moneem, Int. J. Biol. Macromol., 2017, 99, 465–476 CrossRef CAS.
- Z. A. AL-Othman, R. Ali and M. Naushad, Chem. Eng. J., 2012, 184, 238–247 CrossRef CAS.
- M. Naushad, Chem. Eng. J., 2014, 235, 100–108 CrossRef CAS.
- R. Karthik and S. Meenakshi, Chem. Eng. J., 2015, 263, 168–177 CrossRef CAS.
- R. K. Misra, S. K. Jain and P. K. Khatri, J. Hazard. Mater., 2011, 185, 1508–1512 CrossRef CAS PubMed.
- G. Zhou, C. Liu, L. Chu, Y. Tang and S. Luo, Bioresour. Technol., 2016, 219, 451–457 CrossRef CAS PubMed.
- G. Zhou, J. Luo, C. Liu, L. Chu, J. Ma and Y. Tang, Water Res., 2016, 89, 151–160 CrossRef CAS PubMed.
- A. J. M. Karawi, Z. H. J. Qaisi, H. I. Abdullah, A. M. A. Mokaram and D. T. A. Heetimi, Carbohydr. Polym., 2011, 83, 495–500 CrossRef.
- A. L. Bolden, C. F. Kwiatkowski and T. Colborn, Environ. Sci. Technol., 2015, 49, 5261–5276 CrossRef CAS PubMed.
- G. A. Płaza, J. Wypych, C. Berry and R. L. Brigmon, World J. Microbiol. Biotechnol., 2007, 23, 533–542 CrossRef.
- A. V Reis, M. R. Guilherme, A. T. Paulino, E. C. Muniz, L. H. C. Mattoso and E. B. Tambourgi, Langmuir, 2009, 25, 2473–2478 CrossRef PubMed.
- L. P. Ramteke and P. R. Gogate, J. Chem. Technol. Biotechnol., 2016, 91, 456–466 CrossRef CAS.
- W. Shen, J. Luan, L. Cao, J. Sun, L. Yu and J. Ding, Biomacromolecules, 2015, 16, 105–115 CrossRef CAS PubMed.
- J. Liang, G. Shan and P. Pan, Soft Matter, 2017, 13, 4148–4158 RSC.
- C. Abasi, A. Abia and J. Igwe, Environ. Res. J., 2011, 5, 104–113 CrossRef.
- V. C. Sanchez, A. Jachak, R. H. Hurt and A. B. Kane, Chem. Res. Toxicol., 2011, 25, 15–34 Search PubMed.
- S. Wang, X. Li, Y. Liu, C. Zhang, X. Tan, G. Zeng, B. Song and L. Jiang, J. Hazard. Mater., 2018, 342, 177–191 CrossRef CAS PubMed.
- Z. Dong, D. Wang, X. Liu, X. Pei, L. Chen and J. Jin, J. Mater. Chem. A, 2014, 2, 5034–5040 RSC.
- E. Guibal, Prog. Polym. Sci., 2005, 30, 71–109 CrossRef CAS.
- A. Li and A. Wang, Eur. Polym. J., 2005, 41, 1630–1637 CrossRef CAS.
- K. Sharma, B. Kaith, V. Kumar, S. Kalia, V. Kumar and H. Swart, Geoderma, 2014, 232, 45–55 CrossRef.
- S. Chatterjee, M. W. Lee and S. H. Woo, Bioresour. Technol., 2010, 101, 1800–1806 CrossRef CAS.
- C. Gan, Y. Liu, X. Tan, S. Wang, G. Zeng, B. Zheng, T. Li, Z. Jiang and W. Liu, RSC Adv., 2015, 5, 35107–35115 RSC.
- A. Rawal, S. D. Joseph, J. M. Hook, C. H. Chia, P. R. Munroe, S. Donne, Y. Lin, D. Phelan, D. R. G. Mitchell, B. Pace, J. Horvat and J. B. W. Webber, Environ. Sci. Technol., 2016, 50, 7706–7714 CrossRef CAS PubMed.
- J. Deng, B. Lei, A. He, X. Zhang, L. Ma, S. Li and C. Zhao, J. Hazard. Mater., 2013, 263, 467–478 CrossRef PubMed.
- W. Cui, J. Ji, Y.-F. Cai, H. Li and R. Ran, J. Mater. Chem. A, 2015, 3, 17445–17458 RSC.
- C. M. C. Filho, M. N. L. Neto, R. S. Teixeira, A. A. C. C. Pais and A. J. M. Valente, J. Liq. Chromatogr. Relat. Technol., 2016, 39, 837–846 CrossRef CAS.
- M. Sulak, E. Demirbas and M. Kobya, Bioresour. Technol., 2007, 98, 2590–2598 CrossRef CAS.
- W. S. Wan Ngah, L. C. Teong and M. A. K. M. Hanafiah, Carbohydr. Polym., 2011, 83, 1446–1456 CrossRef CAS.
- H. Sereshti, S. Samadi, S. Asgari and M. Karimi, RSC Adv., 2015, 5, 9396–9404 RSC.
- G. Mezohegyi, F. P. van der Zee, J. Font, A. Fortuny and A. Fabregat, J. Environ. Manage., 2012, 102, 148–164 CrossRef CAS.
- M. A. Kamal, S. Bibi, S. W. Bokhari, A. H. Siddique and T. Yasin, React. Funct. Polym., 2017, 110, 21–29 CrossRef CAS.
- Q. Du, J. Sun, Y. Li, X. Yang, X. Wang, Z. Wang and L. Xia, Chem. Eng. J., 2014, 245, 99–106 CrossRef CAS.
- Y. Yao, S. Miao, S. Liu, L. P. Ma, H. Sun and S. Wang, Chem. Eng. J., 2012, 184, 326–332 CrossRef CAS.
- M. Naushad, Z. A. ALOthman, M. M. Alam, M. R. Awual, G. E. Eldesoky and M. Islam, J. Iran. Chem. Soc., 2015, 12, 1677–1686 CrossRef CAS.
- M. Naushad, Z. A. ALOthman, G. Sharma and Inamuddin, Ionics, 2015, 21, 1453–1459 CrossRef CAS.
- A. A. Alqadami, M. Naushad, M. A. Abdalla, T. Ahamad, Z. A. ALOthman, S. M. Alshehri and A. A. Ghfar, J. Cleaner Prod., 2017, 156, 426–436 CrossRef.
- H. Liu, F. Zhang and Z. Y. Peng, Sci. Rep., 2019, 9, 3663–3675 CrossRef.
- M. Naushad, T. Ahamad, G. Sharma, A. H. Al-Muhtaseb, A. B. Albadarin, M. M. Alam, Z. A. ALOthman, S. M. Alshehri and A. A. Ghfar, Chem. Eng. J., 2016, 300, 306–316 CrossRef CAS.
| This journal is © The Royal Society of Chemistry 2019 |

