 Open Access Article
Recent developments in the fabrication, characterization and implementation of MgH2-based solid-hydrogen materials in the Kuwait Institute for Scientific Research
Mohamed Sherif El-Eskandarany

Nanotechnology and Advanced Materials Program, Energy and Building Research Center, Kuwait Institute for Scientific Research, Safat 13109, Kuwait. E-mail: msherif@kisr.edu.kw
First published on 29th March 2019
Abstract
Hydrogen energy holds tremendous promise as a new clean energy option. It is a convenient, safe, versatile fuel source that can be easily converted to the desired form of energy without releasing harmful emissions. Hydrogen storage, which spans both hydrogen production and hydrogen applications, plays a critical role in initiating a hydrogen economy. Apart from the traditional methods used for hydrogen storage, Mg metal has been considered to be the most suitable candidate for application as a safe hydrogen storage material. However, Mg still has several technical problems that must be solved before such an attractive light metal can be considered for use in real applications. This review article aims to present and discuss the most recent research activities (2010–2018) that have been undertaken at the Kuwait Institute for Scientific Research (KISR) to develop and implement new categories of MgH2-based nanocomposites. Comparisons between different catalytic agents used to enhance MgH2 properties are presented and discussed in terms of structure, morphology, thermal stability, and kinetics.
1. Background
Owing to the rapid growth of the human population and the escalating development of the heavy industrial sectors, a drastic increase in the mass production of fossil fuels (coal, oil and natural gas) is required. Based on this extreme expansion in energy demands, the worldwide production of oil and coal jumped from 2500 and 3000 Mt in 1971 to 4321 and 7269 Mt in 2017, respectively.1 During the 1990's, the worldwide fuel consumption of oil exhibited a dramatic increase when many of the developed countries initiated their heavy industrial programs. However, fossil fuel reserves, in particularly oil, were sharply decreased and they remain the dominant source of energy and provide more than 80% of the worldwide energy supply.1According to the environmental and health point of view, fossil fuels emit carbon dioxide and other harmful air pollutants such as SO2 and NOx when burned.2,3 The uncontrolled growth of fossil fuel consumption and their corresponding harmful gases and released emissions has led to a wide variety of public health and environmental costs at the global level.4,5 Fig. 1 summarizes the worldwide CO2 emission in the period between 1971 to 2015 in terms of the quantity (a) and the fuel sources (b).1 Taking oil as an example, the amount of CO2 released from burning oil increased almost linearly from 14![[thin space (1/6-em)]](https://www.rsc.org/images/entities/char_2009.gif) 000 Mt in 1971 to 22
000 Mt in 1971 to 22![[thin space (1/6-em)]](https://www.rsc.org/images/entities/char_2009.gif) 500 Mt in 2000 (Fig. 1). As the oil consumption increased dramatically in the period between 2000 to 2015, the related released CO2 emissions jumped in 2015 to 32
500 Mt in 2000 (Fig. 1). As the oil consumption increased dramatically in the period between 2000 to 2015, the related released CO2 emissions jumped in 2015 to 32![[thin space (1/6-em)]](https://www.rsc.org/images/entities/char_2009.gif) 294 Mt, as presented in Fig. 1.1 Although primary energy sources, which are not infinitely available, may not be sufficient to provide the amount of energy demanded in worldwide in the near future their production and consumption are expected to rise with the rapid growth of the population worldwide.
294 Mt, as presented in Fig. 1.1 Although primary energy sources, which are not infinitely available, may not be sufficient to provide the amount of energy demanded in worldwide in the near future their production and consumption are expected to rise with the rapid growth of the population worldwide.
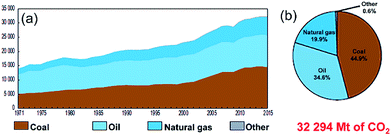 | ||
| Fig. 1 (a) Worldwide CO2 emissions (Mt of CO2) from fuel combustion in the period between 1971 to 2015. The fuel shares of the CO2 emissions from 2015 are shown in (b).1 | ||
2. Introduction
As discussed in the previous section, the energy sector is facing a big challenge to move towards a sustainable and clean energy future. Thus, maintaining the current linear consumption of fossil fuels is unrealistic. The depletion of fossil fuels is the key driver to finding alternative solutions to fuel our energy systems.6 Versatile carbon-free energy carriers with a high-energy-density, such as hydrogen, are considered to be an alternative to fossil fuels. Accordingly, employing renewable and sustainable energy sources such as solar, wind and geothermal energies for developing clean and efficient energy systems has become one of the hottest research topics in the world and is attracting many scientists and researchers.2.1 Hydrogen energy
Since the last decade, hydrogen has been widely proposed as a promising future alternative to replace fossil fuels and deliver the clean energy required in almost all sectors.7 The relevance of hydrogen as an energy carrier is attributed to its unique properties of being convenient, safe, versatile,8,9 easy to produce from renewable energy systems, and its ability to be converted to a desirable form of energy.10,11 In addition, hydrogen has become a favorite energy carrier as it has a very high calorimetric value, with a lower heating value of 120 MJ kg−1 compared to petrol, which is approximately a third of this at 43 MJ kg−1.12However, hydrogen energy shows advanced properties and characteristics when compared with other sources of primary energy; the key advantage of hydrogen is that CO2 is not produced when it is burned. Thus, hydrogen satisfies all concerns over air pollution and global warming, and the transition to use hydrogen as a fuel could be started well before the oil reserves are depleted.
2.2 Potential applications of hydrogen energy
Hydrogen fuel cells (FCs) have a wide range of potential applications, as they operate from a few watts up to gigawatts. Moreover, hydrogen has the potential to run a fuel-cell (FC) engine with greater efficiency than an internal combustion engine.13,14 The same amount of hydrogen will take a FC-car at least twice as far as a car running on gasoline. Hydrogen micro-FCs have great potential for powering portable electronics such as laptops and mobile phones,15 indeed, the superior energy density of a hydrogen polymer electrolyte membrane (PEM) micro-fuel cell could open up new pathways for manufacturing longer battery lifetimes.16 For mobile applications, fuel cells could provide auxiliary power for electrical units such as air conditioning and refrigerators,17 as well as electric cars18 and vehicle powertrain applications.192.3 Hydrogen storage
The idea of hydrogen economy is based on the assumption that hydrogen gas can be produced by decomposing water using inexpensive primary sources of energy, such as solar energy, wind energy, tidal energy, or biomass decomposition.20 Recent studies have highlighted the fact that hydrogen fuel costs are reasonable and can therefore be considered as an ideal candidate to replace fossil fuels as an energy carrier.21 In fact, hydrogen storage is considered to be one of the most crucial factors for hydrogen economy, and one that governs the future utilization of hydrogen energy for real applications.22Cryo-compressed hydrogen storage (CcH2) and liquid hydrogen (LH2) storage are alternative mature approaches in which hydrogen is liquidized at −253 °C and compressed into vessels that can be pressurized to 250–350 atm. Accordingly, the size of the liquid hydrogen requires larger tanks, which are about three times larger than currently used gasoline tanks.26 Moreover, liquid hydrogen requires well-insulated and expensive cryogenic storage vessels to prevent boil-off, maximize the dormancy and to maintain the temperature below 20 K.27 Unfortunately, the gas–liquid transformation process is extremely expensive, consuming approximately about 25–30% of the energy content of the stored hydrogen.28 Thus, employing these traditional storage approaches in real future applications may be difficult owing to the high cost and safety issues.29
At the beginning of this century, a new approach for hydrogen storage was developed by Aceves and his team.30 This approach, the so-called cryogenic pressure vessel, attempted to combine the existing classic storage technologies (cryogenic and high pressure) to capture the advantages of both methods. The idea behind this cryo-compressed storage system was based on the design of a high-pressure (∼350 bar) cryogenic pressure vessel and operation of the system at a low temperature (<20 K). Based on this, hydrogen could be stored at a significantly higher density than compressed hydrogen gas and probably an even higher density than liquid hydrogen.30 This new technology has received significant attention as the higher pressure can be attained in the vessel before the vent valve is activated. It is expected that this technology could reduce the boil off from liquid cryogenic hydrogen.25
Nanomaterials for hosting hydrogen. In contrast to the traditional methods used for hydrogen storage, nanomaterials, such as single-walled carbon nanotubes (SWCNTs)31 and multi-walled carbon nanotubes (MWCNTs)32 have received significant attention as a potential synthetic nano-media for solid-state hydrogen storage. It was reported that the storage capacity of hydrogen molecules that underwent physisorption at the SWCNTs bundles reached 8 wt% under 77 K.33 The superior properties of SWCNTs, exemplified by their chemical stability, large surface area, hollowness, and light mass, were attributed to be responsible for the high storage capacity.32
Metal–organic framework (MOF) systems have shown beneficial properties for storing hydrogen by either physisorption or chemisorption processes.34 However, these materials, with their extremely large specific surface areas and ultra-porous properties, can reach very high gravimetric hydrogen storage capacities; they typically possess a very low density and, therefore, a poor volumetric hydrogen storage capacity.34 Likewise, MOF materials and complex hydrides such as amides, alanates and borohydrides do not often offer reversible hydrogen release, or require high temperatures.
Metal hydrides. The possibility of the formation of a metal hydride through the chemisorption concept was first reported in 1868 by T. Graham, when he discovered that metallic palladium (Pd) wires were readily charged by hydrogen.35 Since then, it has been demonstrated by many researchers that hydrogen can be chemically stored in a wide spectrum of metals, metal alloys and intermetallic compounds in their solid state through the absorption process. More than 50 metallic elements of the periodic table can absorb hydrogen in different quantities and the possible choice of hydrogen storage materials are, therefore, enormous.14
Some solid-state metal hydrides possess excellent hydrogenation properties; such as high volumetric capacities, the capability to absorb hydrogen at a low pressure and temperature, reversibility, and hydrogen releasing through endothermic processes at moderate temperatures.37 Moreover, certain metal hydrides have a higher hydrogen storage density (6.5 H atoms per cm3 for MgH2) than hydrogen gas (0.99 H atoms per cm3) or liquid hydrogen (4.2 H atoms per cm3).36 Hence, metal hydride storage is a safe, volume-efficient storage approach that can be employed for onboard vehicle applications. Many scientific and engineering studies have been carried out in order to develop the absorption/desorption of hydrogen in metals for fuel cell applications.38 In general, metal, intermetallic compounds and alloys can be separated based on their hydrogenation/dehydrogenation temperatures into two major groups as follows:
• Low-temperature metal hydrides, which release hydrogen under normal atmospheric pressure around room temperature, but have a hydrogen capacity that is restricted to be less than 2.15 wt% H2 (e.g., FeTiH1.8 and LaNi5H6), and;
• High-temperature metal hydrides that possess a high hydrogen storage capacity by weight, but require high temperatures for hydrogen absorption/desorption. For example, commercial Mg can reversibly store about 7.6 wt%. The problems are the high operating temperature (300 °C) and the slow hydrogenation/dehydrogenation kinetics.
3. Magnesium hydride
Metallic Mg and Mg-based materials have been considering as the most important candidate hydrogen storage materials for use in real applications.19–24,36 The worldwide interest in Mg is attributed to its natural abundance, low cost, light weight, and its high gravimetric (7.60 wt%) and volumetric (110 g l−1) hydrogen storage capacities. Recently, it has been reported that waste Mg-based alloys such as Mg–Al39 and Mg–Gd40 were successfully used as feedstock materials to produce a good quality of MgH2. More recently, the formation of Mg2FeH6 powders, starting from MgH2 and plain carbon steel powders, that were used as precursors has been demonstrated by Polanski et al.41 They claimed that magnesium iron hydride can be industrially manufactured at high yields using steel scrap, which can reduce the cost of the manufacturing process.3.1 Traditional approaches for synthesizing bulk MgH2
Theoretically, MgH2 can be prepared by a direct reaction between Mg metal and hydrogen gas at normal pressure (∼1 bar) and low temperature (∼50 °C).42 Unfortunately, in practice, this reaction cannot be achieved in such modest conditions owing to the poor hydrogenation kinetics.43 In order to achieve a successful forward reaction with fast uptake kinetics, both the pressure and temperature must be increased to 70 bar and 350 °C, respectively.43 These conditions are essential in order to supply the system with the pressure drive and thermal energy required to enhance the hydrogenation kinetics. Moreover, the heat treatment of Mg is very important to break down the oxide layer of MgO coating the Mg and hence allowing hydrogen atoms to diffuse into the fresh/clean surface of Mg.In the classic methods used for preparing bulk MgH2, the absorption process is achieved through two consecutive stages of physisorption followed by dissociation of the hydrogen molecules that are diffused throughout the hydride layer and nucleation of the hydride. In contrast to this, the dehydrogenation process starts with nucleation of the Mg metallic phase, and then the diffusion of hydrogen atoms throughout the Mg and hydride phase. Thus, the liberated hydrogen atoms are recombined at the Mg surface to form hydrogen molecules.42 The rate-limiting process for desorption is the diffusion of the hydrogen through the hydride material.43
3.2 Synthesizing nanocrystalline MgH2 powders by reactive ball milling
In spite of the traditional approaches used for the gas–solid reaction at relatively high temperatures, Calka et al.44 and El-Eskandarany et al.45 proposed a solid state approach called reactive ball milling (RBM), used for the preparation of different families of metal nitrides and hydrides at ambient temperature. This mechanically-induced gas–solid reaction can be successfully achieved using either high- or low-energy ball milling methods. In both approaches, the starting metallic powders milled under a selected reactive gas atmosphere to produce dramatic lattice imperfections such as twinning and dislocations. These defects are caused by plastic deformation coupled with shear and impact forces that are generated by the ball-milling media.46 The powders are, therefore, disintegrated into smaller particles with a large surface area, in which very clean or fresh oxygen-free active surfaces of the powders are created. Moreover, these defects, which are intensively located at the grain boundaries lead to separation of the micro-scale Mg grains into finer grains capable of the absorption of hydrogen atoms at the first atomically clean surfaces to form MgH2 powders.14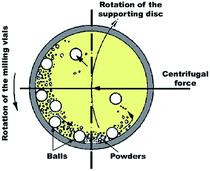 | ||
| Fig. 2 Schematic diagram showing the ball-powder-ball collisions in a planetary high-energy ball mill. | ||
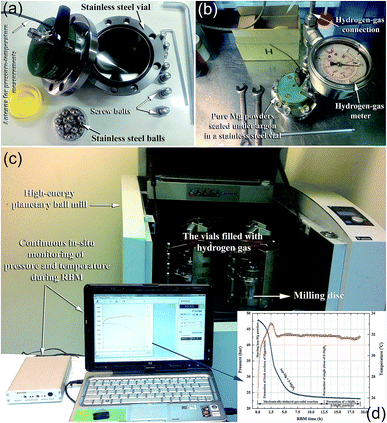
In a typical experimental procedure, a certain amount of Mg (usually in the range between 3 to 10 g based on the volume of the vial) is balanced inside an inert gas atmosphere (argon or helium) in a glove box and sealed together with a certain number of balls (e.g., 20–50 hardened steel balls) into a hardened steel vial (Fig. 3a and b), using, for example, a gas-temperature-monitoring system (GST). With the GST system, it becomes possible to monitor the progress of the gas–solid reaction taking place during the RBM process, as shown in Fig. 3c and d. The temperature and pressure changes in the system during the milling process can be also used to realize the completion of the reaction and the expected end-product during the different stages of milling (Fig. 3d). The ball-to-powder weight ratio is usually selected to be in the range of between 10![[thin space (1/6-em)]](https://www.rsc.org/images/entities/char_2009.gif) :
:![[thin space (1/6-em)]](https://www.rsc.org/images/entities/char_2009.gif) 1 and 50
1 and 50![[thin space (1/6-em)]](https://www.rsc.org/images/entities/char_2009.gif) :
:![[thin space (1/6-em)]](https://www.rsc.org/images/entities/char_2009.gif) 1. The vial is then evacuated to the level of 10–3 bar before introducing H2 gas to fill the vial with a pressure of 5–50 bar (Fig. 3b). The milling process is started by mounting the vial on a high-energy ball mill operated at ambient temperature.
1. The vial is then evacuated to the level of 10–3 bar before introducing H2 gas to fill the vial with a pressure of 5–50 bar (Fig. 3b). The milling process is started by mounting the vial on a high-energy ball mill operated at ambient temperature.
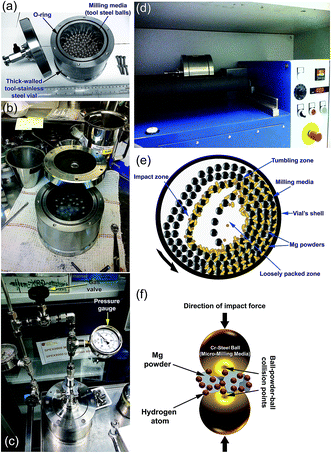
Hydrogen gas is pressurized into the vial (Fig. 4c) together with the Mg powders and ball milling media, using a ball-to-powder weight ratio in the range between 30![[thin space (1/6-em)]](https://www.rsc.org/images/entities/char_2009.gif) :
:![[thin space (1/6-em)]](https://www.rsc.org/images/entities/char_2009.gif) 1 to 100
1 to 100![[thin space (1/6-em)]](https://www.rsc.org/images/entities/char_2009.gif) :
:![[thin space (1/6-em)]](https://www.rsc.org/images/entities/char_2009.gif) 1. The Mg powder particles meet the abrasive and impacting force (Fig. 4e), which reduce the particle size and create fresh-powder surfaces (Fig. 4f) ready to react with the hydrogen milling atmosphere. The useful kinetic energy generated in the tumbling mill can be applied to the Mg powder particles (Fig. 4e) by the following means: (i) collision between the balls and the powders; (ii) pressure loading of powders pinned between milling media or between the milling media and the liner; (iii) impact of the falling milling media; (iv) shear and abrasion caused by the dragging of particles between moving milling media; and (v) shock-wave transmitted through crop load by falling milling media.
1. The Mg powder particles meet the abrasive and impacting force (Fig. 4e), which reduce the particle size and create fresh-powder surfaces (Fig. 4f) ready to react with the hydrogen milling atmosphere. The useful kinetic energy generated in the tumbling mill can be applied to the Mg powder particles (Fig. 4e) by the following means: (i) collision between the balls and the powders; (ii) pressure loading of powders pinned between milling media or between the milling media and the liner; (iii) impact of the falling milling media; (iv) shear and abrasion caused by the dragging of particles between moving milling media; and (v) shock-wave transmitted through crop load by falling milling media.
One advantage of this type of mill is that a large amount of powder (100 to 500 g or more based on the mill capacity)17 can be fabricated during each milling run. Thus, it is suitable for pilot and/or industrial scale MgH2 production. In addition, the low-energy ball mill produces homogeneous and uniform powders when compared with the high-energy ball mill. Furthermore, such tumbling mills are cheaper than high-energy mills and are simply operated with low maintenance requirements. However, this kind of low-energy mill requires a long milling time (more than 300 h) to complete the gas–solid reaction and to obtain nanocrystalline MgH2 powders.
3.3 Disadvantages of MgH2
Unfortunately, and in spite of the attractive properties of MgH2 there are certain major drawback issues restricting the implementation of this attractive solid-state hydrogen storage material in real applications.46–49 MgH2 in its pure form is very stable, possessing a large negative heat of formation (ΔHfor = −75 kJ mol−1 H2)50 and it shows slow kinetics of dehydrogenation at temperatures less than 400 °C.51 In addition, Mg metal is very sensitive to the surrounding atmosphere, particularly to oxygen. Coating the powder with MgO and Mg(OH)2 films during materials handling usually hinders the hydrogen atoms from penetrating the hard ceramic coating to react with Mg surfaces. Removal of these films requires a strict activation process of Mg under the application of a high hydrogen pressure (above 35 bar) and high temperature (∼350 °C).17 Furthermore, the low thermal conductivity of the MgH2 system (0.4 W mK−1 (ref. 52)) is considered to be a serious problem as heat transfer is a very important factor that is required for both the hydrogenation and dehydrogenation processes.4. Worldwide scenarios for improving the behavior of MgH2
4.1 Alloying elements
One practical solution proposed for enhancing the hydrogenation/dehydrogenation properties of MgH2 is to melt pure bulk Mg with selected alloying elements such as Ni, Pd, and Nd to obtain less stable binary, ternary or multicomponent Mg-based alloy systems with a lower heat of formation (ΔHfor). In many cases, the synthesized Mg-based alloy systems do not show attractive storage properties when compared with pure MgH2. For example, alloying Mg with Ni to form binary Mg2Ni lowers the ΔHfor of the metal hydride phase (Mg2NiH6) to −64.5 kJ mol−1 instead of −74.5 kJ mol−1 for pure MgH2. However, the system shows a dramatic degradation in the hydrogen storage capacity (3.5 wt%) with no significant decrease in the decomposition temperature.53At the beginning of this century, Yamada et al.54 proposed the Mg-rich (90 at%) systems of Mg–Pd, Mg–Nd and Mg–Pd–Nd to replace the traditional Mg2Ni alloy. They reported that Mg-based systems containing Pd at 300 °C demonstrate pressure-composition-temperature (PCT) curves with three plateau-like regions and a hydrogen absorbency of 5 wt%. They pointed out that the hydrogenation/dehydrogenation of the Mg–Nd system was influenced by the catalytic effect of the formed NdH2.5 and NdH3 phases which assisted the hydriding and dehydriding of the Mg matrix. For the Mg–Pd system, they reported that the disproportional reaction of Mg6Pd to form Mg5Pd2 and MgH2 retarded the overall reaction kinetics. In spite of their efforts dedicated to developing a new Mg-based alloy system with advanced kinetic behavior, their proposed Mg89Pd7Nd4 alloy required 50 min to absorb about 4 wt% H2 at 300 °C. In addition, achieving a complete dehydrogenation process for this system required 150 min at the same operating temperature.54
4.2 Doping with catalysts
Since the mid of 1990's, enormous efforts have been devoted to improving the hydrogenation/dehydrogenation behaviors of MgH2, using a wide variety of catalysts. In this section, we will present typical examples of several attempts that have recently been reported to improve the kinetics of MgH2 for hydrogenation and subsequent dehydrogenation.Zaluska et al. reported the earliest study on the doping of MgH2 powders with 3-d elements, when they selected Pd, Ti, Fe, V, Zr, and Mn for catalyzing MgH2 powders, either individually or as a catalytic mixture.56 The catalyzed MgH2 powders were prepared by high-energy ball milling composite powders in the time range of 15 min to 20 h. Based on their findings, elemental V and Zr, as well as a composite of Mn/Zr, were determined to be the most effective agents used to improve the kinetic behavior of MgH2. Some typical MgH2/TM composite systems with their corresponding characteristics are listed in Table 1.
| Catalyst used | Dose | Doping approach | Hydrogenation/dehydrogenation properties | Apparent activation energy (kJ mol−1) | Ref. |
|---|---|---|---|---|---|
| a HEBM: high-energy ball milling; RBM: reactive ball milling; NA: not available. | |||||
| NPs-Fe | 10 wt% | Ar-HEBM/4 h | Absorption: 10 bar/350 °C: 5.1 wt%/9.1 min | 86 | 57 |
| NPs-Co | 10 wt% | Ar-HEBM/4 h | Absorption: 10 bar/350 °C: 4.3 wt%/7.7 min | 75 | 58 |
| NPs-Ni | 10 wt% | Ar-HEBM/4 h | Absorption: 10 bar/350 °C: 5 wt%/6.1 min | 72 | 58 |
| NPs-Cu | 10 wt% | Ar- HEBM/4 h | Absorption: 10 bar/350 °C: 4.6 wt%/15.3 min | 76 | 58 |
| Zr | 1 at% | H2-RBM/300 rpm/20 h + annealing at 100 °C/40 bar H2/24 h | Absorption: 5.5 wt%/4000 s/300 °C. Absorption of nanocomposite: 3.5 wt% H2/6000 s/100 °C. Dehydrogenation: 5.5 wt% H2/2000 s/350 °C | 40 | 59 |
Intermetallic compounds and alloys have received a significant amount of attention since 1979 when Karty et al. reported their beneficial effect on the hydrogenation and dehydrogenation of Mg upon doping MgH2 with a Mg2Cu eutectic alloy.60 The enhancement achieved in the kinetic reaction of MgH2 was attributed to the dominant role of Mg2Cu, which consisted of minimizing the oxide inhibition by providing a clean unoxidized external surface at which the hydrogen gas could readily adsorb, dissociate, and diffuse into the interior where hydride formation occurs; essentially the reverse process to that occurring in dehydriding.60 Since then Mg has been doped with alloys of different concentrations, including Mg2Ni,61,62 Mg(La2Mg17)–LaNi5,63 Mg–FeTi,64 Mg–ZrFe1.4Cr0.6,65 LaNi5,66 ZrCrNi,67 and Ti–V based bcc alloys.68
Dehouche et al. demonstrated a detailed and useful study on the doping effect of activated Zr100−xNix alloy powders on the uptake/release kinetics of MgH2 powders.69 They pointed out that catalyzing MgH2 with activated ZrNi alloys led to a remarkable increase in the kinetic behavior of MgH2. Their results have shown that the best kinetic properties of MgH2 were obtained upon doping with 10 wt% of eutectoid Zr47Ni53, however, mixing with different compositions (Zr9Ni11 and Zr7Ni10) also led to a significant improvement, but not as great as that observed for the eutectoid composition.69 They found that when MgH2/0.2 mol% Zr7Ni10 is ground with activated carbon, a further kinetic improvement was attained. Table 2 lists selected intermetallic compounds and alloys that have been efficiently used as catalytic agents to enhance the kinetic behavior of MgH2. Further information on different intermetallic compound catalytic agents has been previously reported in several different comprehensive review articles.20,25,27,48,49,57
| Catalyst used | Dose | Doping approach | Hydrogenation/dehydrogenation properties | Apparent activation energy (kJ mol−1) | Ref. |
|---|---|---|---|---|---|
| a HEBM: high-energy ball milling; RBM: reactive ball milling; NA: not available. | |||||
| LaNi5 | 5 wt% | H2-HEBM/40 h | Absorption: 20 bar/285 °C: 5.1 wt%/2700 s. Desorption: 285 °C: 5.1 wt%/1800 s | NA | 63 |
| Mg2Ni | 5 mol% | Ar-HEBM/3 h | Absorption: 20 bar/220 °C: 5.5 wt%/30 min. Desorption: 220 °C: 5.5 wt%/60 min | NA | 62 |
| Ti0.4Cr0.15Mn0.15V0.3 | 20 wt% | Ar-HEBM/3 h | Absorption: 20 bar/350 °C: 6.5 wt%/300 min | 71.2 | 68 |
| ZrCrNi | 10 wt% | Ar-HEBM | Absorption: 5 bar/300 °C: 5.8 wt%/30 min. Desorption: 0.1 bar/300 °C: 5.8 wt%/45 min | NA | 67 |
| TiAl | 14 wt% | H2-RBM/4 h | Absorption: 1 bar/100 °C: 4 wt%/30 min. Desorption: 0.1 bar/240 °C: 4 wt%/7 min | 65 | 70 |
| Ti0.05Cr0.20V0.75 | 10 wt% | H2-RBM/4 h | Absorption: 1 bar/25 °C: 3 wt%/75 min. Desorption: 0.01 bar/240 °C: 5.5 wt%/5 min | 71.2 | 71 |
| FeTi | 5 wt% | Ar-HEBM/8 h | Absorption: 30 bar/300 °C: 5.8 wt%/800 s. Desorption: 1.58 bar/300 °C: 2.57 wt%/110 min | NA | 72 |
| FeTiMn | 40 wt% | Ar-HEBM/40 h | Absorption: 40 bar/80 °C: 4 wt%/3600 s. Desorption: 3 bar/240 °C: 2.57 wt%/7200 min | NA | 72 |
Metal oxides possess a strong catalytic effect, leading to improvement of the hydrogenation/dehydrogenation kinetics of MgH2. One of the earliest works was reported by Oelerich et al.73 who prepared different systems of nanocrystalline Sc2O3, TiO2, V2O5, Cr2O3, Mn2O3, Fe3O4, CuO, Al2O3, and SiO2 powders using high-energy ball milling. The nanocrystalline oxide powders (5 wt%) were obtained after 20 h of milling, and were individually mixed with MgH2 powders and then high-energy ball milled for a further 100 h under an Ar atmosphere. The results showed that all of the nanocrystalline oxides used in their study had a remarkable effect in improving the absorption/desorption kinetics of MgH2.73 They reported that composite materials containing Fe3O4 showed the fastest absorption kinetics at 300 °C, followed by V2O5, Mn2O3, Cr2O3, and TiO2. In 2007, Aguey-Zinsou et al. ball-milled MgH2 with 17 wt% Nb2O5 for 200 h, using a high-energy ball mill.74
Based on their results, pure MgH2 revealed fast hydrogen sorption kinetics (Table 3) after a long milling time (700–1000 h) with Nb2O5. They attributed this remarkable improvement to a so called “process control agent” in which Nb2O5 plays three roles, a lubricant, dispersing and cracking agent.74 Properties related to the selected MgH2/metal oxides composite systems are shown in Table 3.
| Catalyst used | Dose | Doping approach | Hydrogenation/dehydrogenation properties | Apparent activation energy (kJ mol−1) | Ref. |
|---|---|---|---|---|---|
| Nb2O5 | 17 wt% | Ar-HEBM/ZrO2 milling tools/200 h | Absorption: 300 °C: 6 wt%/120 s. Desorption: 300 °C: 6 wt%/300 s 10 cycles | NA | 73 |
| 5 wt% | Ar-HEBM/24 h MgH2 + 20 min Nb2O5 | Absorption: 10 bar/300 °C: 5.2 wt%/78 s. Desorption: 0.1 kPa/300 °C: 6 wt%/300 s | NA | 73 | |
| 10 wt% | Ar-HEBM | Absorption: 5 bar/300 °C: 5.8 wt%/30 min. Desorption: 0.1 bar/300 °C: 5.8 wt%/350 min | NA | 75 | |
| 14 wt% | H2-RBM/4 h | Absorption: 1 bar/100 °C: 4 wt%/30 min. Desorption: 0.1 bar/240 °C: 4 wt%/7 min | 65 | 76 | |
| TiO2 | 20 wt% | H2-RBM/1 h/8 bar | Absorption: 20 bar/350 °C: 3.8 wt%/2 min. Desorption: 1 bar/350 °C: 4.4 wt%/8.5 min | NA | 77 |
| Fe2O3 | 10 wt% | H2-RBM/10 bar | Absorption: 12 bar/320 °C: 4.22 wt%/10 min | NA | 78 |
| Cr2O3 | 1.2 wt% | Ar-HEBM | Absorption: 10 bar/300 °C: 6.4 wt%/5 min. Desorption: 0.25 bar/300 °C: 6.4 wt%/20 min | NA | 79 |
| Fe3O4@graphene | 5 wt% | Absorption: 15 bar/290 °C: 6.2 wt%/2.5 min 25 cycles | 90.53 | 80 | |
| La2O3 | 12 wt% | Ar-HEBM/20 h | Absorption: 10 bar/300 °C: 4.75 wt%/8 min. Desorption: 0.3 bar/300 °C: 6 wt%/25 min | NA | 81 |
5. Kuwait Institute for Scientific Research
Kuwait Institute for Scientific Research (KISR, http://www.kisr.edu.kw/en/) is an independent, national institute of scientific excellence, and was established in 1967. Since then, KISR's role and responsibilities have expanded greatly to include the advancement of the national industry and the undertaking of studies to address key challenges, such as the preservation of the environment, sustainable management of Kuwait's natural resources, responsible management of water and energy, and development of innovative methods of agriculture. Today, KISR is home to over 580 researchers and engineers and over 100 laboratories, housed at nine locations.As an outcome of KISR's Transformation Project in 2010, the Energy and Building Research Center (EBRC, http://www.kisr.edu.kw/en/facilities/energy-building/?research=1), has emerged and is the center's focus is on research and technology themes within the energy and building sectors. In the energy research sector, EBRC intends to support and facilitate the process for the transition to advanced and diversified sustainable energy generation, energy storage technologies through collaborative research, development, and knowledge transfer.
The building research sector addresses issues related to construction materials and existing and new infrastructure.
The Nanotechnology and Advanced Materials (NAM) Program (http://www.kisr.edu.kw/en/program/22/) is one of the EBRC's five programs. The program was established in 2010 in order to improve the performance and cost effectiveness of materials and devices required by the industrial sector through innovative solutions based on nanotechnology. Since then, the program has taken responsibility for supporting the most important and crucial problems in Kuwait, these are energy, water, petroleum, and oil.
5.1 Research activities devoted to enhancing the hydrogen storage properties of Mg
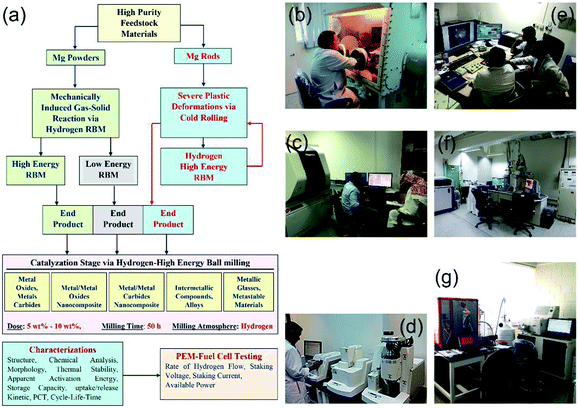
Since the establishment of the NAM Program it has been focused on the fabrication, characterization and implementation of new solid-hydrogen storage nanocomposite MgH2 families. Fig. 5 shows three independent routes used for preparing nanocrystalline MgH2 nanopowders.In the first and second routes, high- and low-energy RBM under hydrogen pressure (Fig. 3 and 4) are employed to obtain γ- and β-MgH2 phases after milling for 6–200 h. In the third route, the starting Mg-rods are subjected to severe plastic deformation, using the cold rolling (CR) process (Fig. 5). The cold rolled products obtained after 150–300 passes are charged using high-energy RBM and milled for 100 h to obtain MgH2 powders (Fig. 5). The obtained MgH2 powders are subjected to further grain refining, using the cold rolling process for 50–100 passes. The end-product powders obtained through each preparation route are doped with 5–10 wt% of one catalytic agent and then milled under hydrogen for 50 h. The catalytic systems used here can be classified into five groups based on their nature (Fig. 5), namely: (i) metal oxide and metal carbides; (ii) metal/metal oxide nanocomposite; (iii) metal/metal carbides nanocomposite; (iv) intermetallic compounds and alloys; and (v) metallic glasses and metastable materials.
After high-energy ball milling for 6 h, Ni shots (approximately 65 nm in size) worn out from the Ni-balls were embedded into the MgH2 matrix, as shown in Fig. 6a. Increasing the RBM time (12.5–25 h) led to a monotonical decrease in the Ni particle size and an improvement in the Ni particles distribution in the MgH2 matrix (Fig. 6d and g).
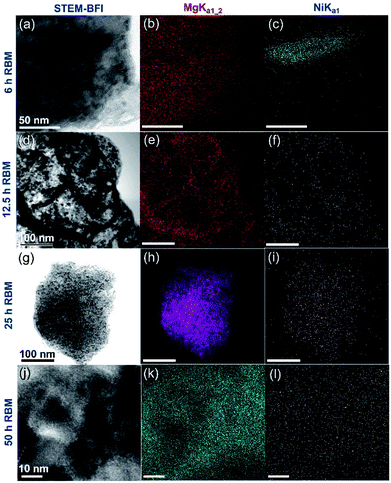 | ||
| Fig. 6 (a, d, g and j) STEM-BFIs; (b, e, h and k) Mg-Kα1–2; and (c, f, i and l) Ni-Lα1 for the powders obtained after different stages of RBM, using a milling media of Ni-balls.83 | ||
Towards the end of the processing time (50 h) nano-Ni powders (∼5 nm) were homogeneously embedded into the matrix to form uniform nanocomposite powders with an Ni concentration of 5.5 wt% ± 0.21, as displayed in Fig. 6k and l. MgH2/5.5 wt% Ni nanocomposite powders obtained after a short RBM time (25 h) revealed low values for the decomposition temperature (218 °C), at which the apparent activation energy (Ea) was 75 kJ mol−1.83 In addition, the hydrogenation (Fig. 7a)/dehydrogenation (Fig. 7b) kinetics measured for a sample at moderate temperature (275 °C) for 25 h were found to be 2.5 min and 8 min to uptake and release 5.8 wt% H2, respectively. The authors claimed that this fast kinetic behavior was attributed to the formation of a homogeneous nanocomposite system, in which nano-powders were adhered to all MgH2 powders without exception.83 The synthesized nanocomposite was able to perform 100 continuous cycle-life times of hydrogen charging/discharging at 275 °C within 56 h without failure or degradation, as elucidated in Fig. 7c.
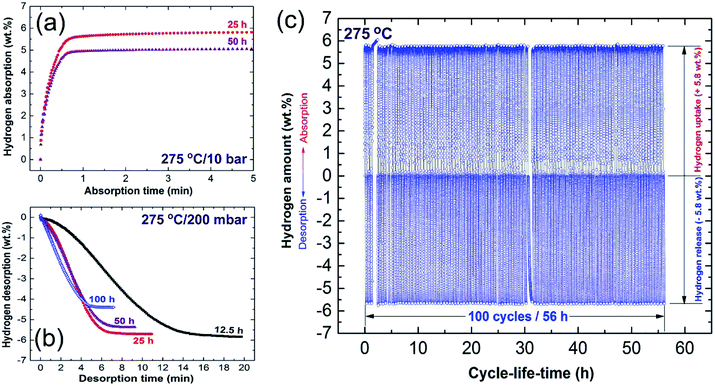 | ||
| Fig. 7 (a) Hydrogenation; and (b) dehydrogenation kinetics examined at 275 °C for MgH2 powders obtained after different RBM times, using a milling media of Ni-balls. The cycle-lifetime conducted at 275 °C for the sample obtained after 25 h of RBM time is presented in (c).86 | ||
More recently, Ti balls have been used as milling tools for RBM of Mg under a hydrogen (50 bar) atmosphere.46 Similarly to the Ni-balls, Ti shoots were worn out from the Ti-balls and embedded in the MgH2 matrix to form uniform nanocomposite MgH2/5.3 wt% Ti powders after 50 h (Fig. 8a). The measured decomposition temperature and calculated Ea of this nanocomposite system obtained after 50 h of milling were 230 °C and 72 kJ mol−1, respectively.46 The hydrogenation kinetics for the sample obtained after 50 h of RBM (end product) were investigated under 10 bar of H2 at applied temperatures of 100, 125, 150 and 175 °C, as presented in Fig. 8b. The sample showed outstanding hydrogenation behavior at a very low temperature (100 °C), demonstrated by the short time required to absorb 4.9 wt% H2 in 3 min (Fig. 8b). At 175 °C, a better storage capacity and kinetics were attained, as indicated by the short time required (3 min) to uptake 5.2 H2, as shown in Fig. 8b.
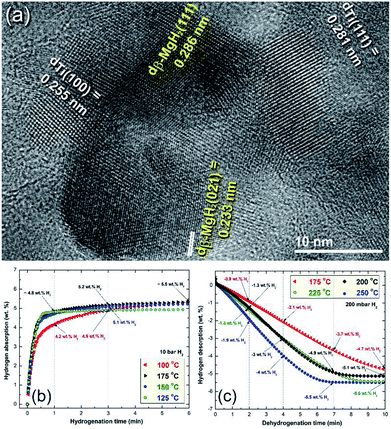 | ||
| Fig. 8 (a) Field emission-high resolution transmission electron microscopy (FE-HRTEM) image of MgH2 powder containing about 5 wt% Ti metallic particles after 50 h of RBM, using a milling media of Ti-balls. The hydrogenation and dehydrogenation kinetics measured at different temperatures for a 50 h sample are presented in (b) and (c), respectively.46 | ||
The dehydrogenation kinetic behaviors for the sample obtained after 50 h of RBM time were investigated at different temperatures in a range between 175 °C and 250 °C (Fig. 8c). This sample possessed moderate dehydrogenation kinetics in a low temperature range (175 to 225 °C), indicated by the short time (4 min) necessary to release −2.1 and −3 wt% hydrogen, respectively, as displayed in Fig. 8c. Obviously, the kinetics of the sample were enhanced by increasing the dehydrogenation time to 7 min, the hydrogen release increased with the increasing applied temperature from −3.7 wt% (175 °C) to −4.9 wt% (200 and 225 °C), respectively. The two samples measured at 225 °C and 250 °C reached to saturation values of −5.1 and −5.5 wt% H2, respectively after 10 min, as indicated in Fig. 8c.
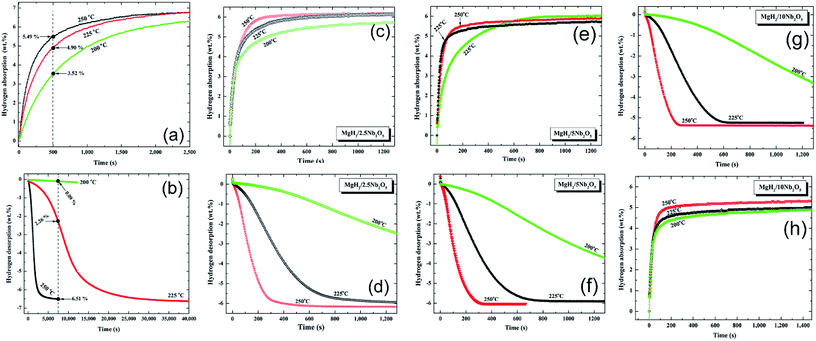 | ||
| Fig. 9 Effect of Nb2O5 doping dose and applied temperature on the hydrogenation (a, c, e, g), and dehydrogenation (b, d, f, h) kinetics of the MgH2 powders.84 | ||
The absorption kinetics investigated at 200, 225 and 250 °C for the pure MgH2 nanocrystalline powders obtained after 200 h of RBM time (Fig. 9a) were faster when compared with the powders obtained after a short milling time.84 After this long milling run, the powders were subjected to dramatic grain refining associated with severe lattice imperfections. This led to drastic powder disintegration and the formation of ultrafine grains ranging between 5 and 8 nm in diameter.84
These favorable morphological properties led to an enhancement in the uptake kinetics, even at a relatively low temperature of 200 °C. For example, at this temperature the sample absorbed about 3.5 wt% H2 within 500 s and approached 6.3 wt% H2 after about 2500 s, as shown in Fig. 9a. When these values are compared with those obtained at 225 °C (4.9 wt% H2/500 s and 6.8 wt% H2/2500 s) and 250 °C (5.49 wt% H2/500 s and 6.81 wt% H2/2500 s), it can be seen that a small increase in the applied temperature led to a significant improvement in the kinetics of hydrogen absorption for the nanocrystalline MgH2 powders (Fig. 9a).
Nanocrystalline MgH2 powders obtained after 200 h of RBM possessed slow desorption kinetics at 200 °C and 225 °C, however, they showed moderate kinetics at 250 °C, indicated by the release of 6.51 wt% H2 after 7500 s, as presented in Fig. 9b.
Doping MgH2 with very small amount of Nb2O5 powders and then milling for 50 h led to a significant improvement in the absorption kinetics, exemplified by the ability of the powder to uptake about 4.5, 5.3, and 5.8 wt% H2 at 200, 225, and 250 °C, respectively (Fig. 9c). At 250 °C, nanocomposite MgH2/2.5 wt% Nb2O5 reached a saturated value of 6.1 wt% H2 after 600 s, as shown in Fig. 9c. The corresponding desorption kinetics showed an outstanding improvement, as suggested by the short time (800 s) required to desorb 6.1 wt% H2 at 250 °C (Fig. 9d). Further comparison between the hydrogen storage properties of the starting synthetic MgH2 and MgH2/x wt% Nb2O5 (x; 2.5, 5, 10) are presented in Table 4. The improvement achieved in the kinetic behavior of the MgH2 powders upon milling with Nb2O5 powders was attributed to the micro-cracking effect induced by the hard spherical Nb2O5 powders. Moreover, it is believed that it can act as effective catalyst in its recombination with hydrogen molecules and accelerate the promotion of the gas–solid reaction.84
| Catalyst used/dose | Doping approach | Hydrogenation/dehydrogenation properties | Apparent activation energy (kJ mol−1) | Ref. |
|---|---|---|---|---|
| a HEBM: high-energy ball milling; RBM: reactive ball milling; NA: not available. | ||||
| MgH2 | ||||
| H2-RBM/50 bar/200 h | Absorption | 134 | 87 | |
| 200 °C: 6.3 wt%/10 bar/2500 s | ||||
| 225 °C: 6.4 wt%/10 bar/2500 s | ||||
| 250 °C: 6.5 wt%/10 bar/2500 s | ||||
| Desorption | ||||
| 225 °C: 6.4 wt%/0.02 bar/40000 s | ||||
| 250 °C: 6.5 wt%/0.02 bar/7500 s | ||||
![[thin space (1/6-em)]](https://www.rsc.org/images/entities/char_2009.gif) |
||||
| Nb2O5 | ||||
| 2.5 wt% | H2-RBM/50 bar/50 h | Absorption | NA | 84 |
| 200 °C: 5.7 wt%/10 bar/1250 s | ||||
| 225 °C: 5.9 wt%/10 bar/1000 s | ||||
| 250 °C: 6.1 wt%/10 bar/600 s | ||||
| Desorption | ||||
| 200 °C: 2.5 wt%/0.02 bar/1250 s | ||||
| 225 °C: 5.8 wt%/0.02 bar/1250 s | ||||
| 250 °C: 6.1 wt%/0.02 bar/800 s | ||||
| 5 wt% | H2-RBM/50 bar/50 h | Absorption | 104 | 84 |
| 200 °C: 6.0 wt%/10 bar/1250 s | ||||
| 225 °C: 6.0 wt%/10 bar/800 s | ||||
| 250 °C: 6.0 wt%/10 bar/600 s | ||||
| Desorption | ||||
| 200 °C: 3.7 wt%/0.02 bar/1250 s | ||||
| 225 °C: 6.0 wt%/0.02 bar/1000 s | ||||
| 250 °C: 6.0 wt%/0.02 bar/280 s | ||||
| 10 wt% | H2-RBM/50 bar/50 h | Absorption | NA | 84 |
| 200 °C: 4.8 wt%/10 bar/1400 s | ||||
| 225 °C: 5.0 wt%/10 bar/1200 s | ||||
| 250 °C: 5.4 wt%/10 bar/500 s | ||||
| Desorption | ||||
| 200 °C: 3.3 wt%/0.02 bar/1250 s | ||||
| 225 °C: 5.3 wt%/0.02 bar/700 s | ||||
| 250 °C: 5.4 wt%/0.02 bar/280 s | ||||
![[thin space (1/6-em)]](https://www.rsc.org/images/entities/char_2009.gif) |
||||
| Ni/Nb2O5 | ||||
| 5 wt%/5 wt% | H2-RBM/50 bar/50 h | Absorption | 74 | 84 |
| 200 °C: 5.2 wt%/10 bar/250 s | ||||
| 225 °C: 5.2 wt%/10 bar/220 s | ||||
| 250 °C: 5.4 wt%/10 bar/190 s | ||||
| Desorption | ||||
| 200 °C: 5.4 wt%/0.02 bar/2000 s | ||||
| 225 °C: 5.5 wt%/0.02 bar/500 s | ||||
| 250 °C: 5.5 wt%/0.02 bar/190 s | ||||
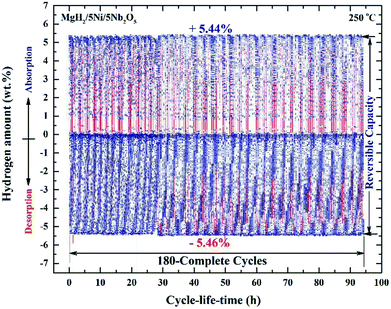 | ||
| Fig. 10 Hydrogen absorption and consequent desorption curves of 180 complete cycles of nanocomposite MgH2/5 wt% Ni/5 wt% Nb2O5 powders examined at 250 °C under a hydrogen pressure of 10 bar (absorption) and 200 mbar (desorption).84 | ||
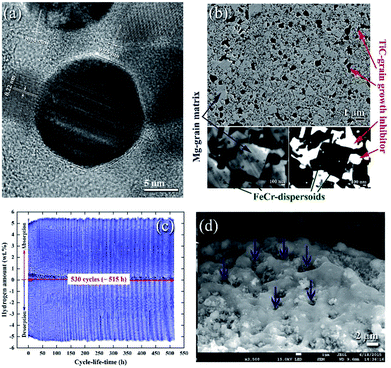 | ||
| Fig. 11 (a) FE-HRTEM image of an as-prepared Ti55C45 particle, using the mechanically induced self-propagating reaction.89 Low magnification FE-SEM, (b) high-magnification FE-SEM and (c) backscattered electron (BSE) micrographs of the cross-sectional view for the nanocomposite powders obtained after 50 h of ball milling and then hot-pressed in a vacuum at 525 °C under a uniaxial pressure of 125 MPa. The hydrogenation and consequent dehydrogenation curves conducted at 275 °C of 530 complete cycles performed within 515 h for nanocomposite MgH2/5TiC powders obtained after 50 h of ball milling time are shown in (c). The FE-SEM micrograph of the powders obtained after the completion of 530 cycles is presented in (d).90 | ||
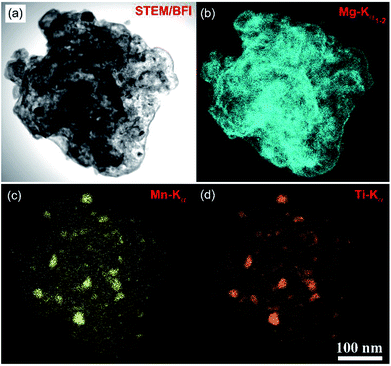 | ||
| Fig. 12 (a) STEM-BFI and the corresponding X-ray elemental mapping of: (b) Mg; (c) Mn; and (d) Ti of nanocomposite MgH2/7 wt% Mn3.6Ti2.4 powders obtained after 50 h of milling time.88 | ||
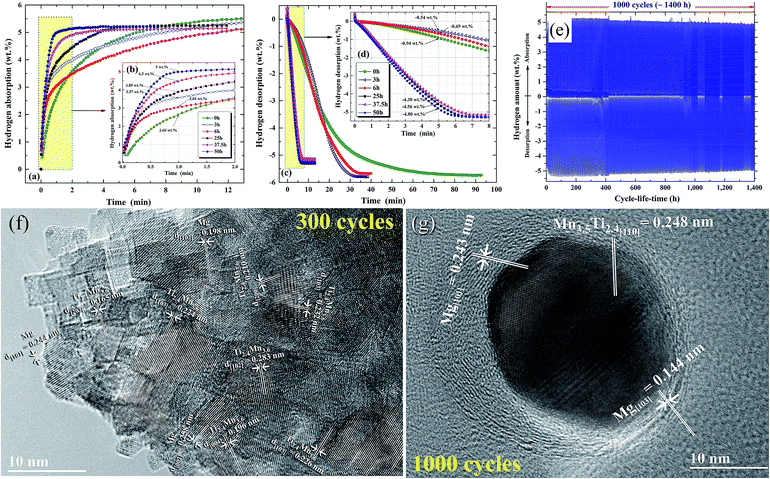 | ||
| Fig. 13 Effects of ball milling time on the (a and b) hydrogenation and (c and d) dehydrogenation kinetics of nanocomposite MgH2/7 wt% Mn3.6Ti2.4 powders. The hydrogenation and consequent dehydrogenation curves of 1000 complete cycles for the nanocomposite powders obtained after 50 h of milling time are presented in (e). HRTEM images of the nanocomposite powders subjected to 300 and 1000 cycles are presented in (f) and (g), respectively.88 | ||
The formation of ultrafine nano-scaled powder particles facilitated a good hydrogen diffusion cyclability, as suggested by the long (1400 h) absorption/desorption cycle-life-time presented in Fig. 13e. However, a minor degradation (∼0.3–0.4 wt% H2) in the hydrogen storage capacity was observed between 400 h (300 cycles) and 1400 h (1000 cycles), as elucidated in Fig. 13e. This minor degradation took place because the slight grain growth came off in the Mg/Mn3.6 Ti2.4 grains, as indicated in Fig. 13f and g.88
More recently, nanocomposite MgH2/10 wt% ZrNi5 powders were fabricated in KISR by RBM the synthesized nanocrystalline MgH2 with 10 wt% of arc-melt ZrNi5 powders for 50 h.89 Fig. 14 displays the temperature and time effects on the hydrogen absorption (a and b) and the consequent desorption (c and d) kinetics of the nanocomposite MgH2/10 wt% ZrNi5 powders obtained after 50 h of ball milling time. The synthesized nanocomposite powders showed a good potential for absorbing hydrogen gas in a wide temperature range (50–275 °C) with a different hydrogen capacity, as shown in Fig. 14a. After 0.5 min, the powders absorbed 4.6 wt% H2 at 250 °C and 275 °C (Fig. 14b). In contrast, at this absorption time, the samples examined at 150, 100, and 50 °C revealed a modest hydrogen gas uptake that reached 0.8, 0.1, and 0.0 wt% H2, respectively (Fig. 14b).
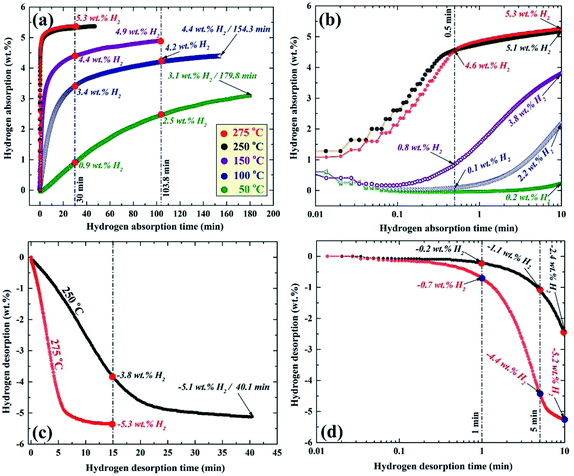 | ||
| Fig. 14 Temperature and time effects on the (a and b) hydrogenation, and (c and d) dehydrogenation kinetics of nanocomposite MgH2/10 wt% ZrNi5 powders obtained after RBM for 50 h.89 | ||
Increasing the hydrogen gas uptake time to 1 min led to a magnificent improvement of the absorbed hydrogen gas concentration, reaching 5.1 and 5.3 wt% at an applied temperature of 250 and 275 °C, respectively as shown in Fig. 14b. The samples examined at 150 and 100 °C showed a significant improvement, suggested by a dramatic increase in the hydrogen gas absorbed, reaching 3.8 and 2.2 wt%, respectively (Fig. 14b).
A marginal improvement in the absorption kinetics was observed for the sample measured at 50 °C, which absorbed only 0.2 wt. H2 after 1 min, as displayed in Fig. 14b. Increasing the absorption time to 30 min (Fig. 14a) did not lead to an increase in the absorbed amount of hydrogen for the sample examined at 250 and 275 °C that tended to be saturated at 5.3 wt% H2.
An outstanding improvement in the hydrogen concentration (4.4 wt%) absorbed at 150 °C could be attained after 30 min and tended to increase to a higher value (4.9 wt%) after 103.8 min (Fig. 14a). After 30 min, the samples examined at 100 and 50 °C, absorbed approximately 3.4 and 0.9 wt% H2, as shown in Fig. 14a. The hydrogen concentrations of these samples reached 4.2 and 2.5 wt% after 103.8 min (Fig. 14a). Approximately 180 min was required for the samples measured at 100 and 50 °C to absorb 4.4 and 3.1 wt% H2, as elucidated in Fig. 14a.
The corresponding desorption kinetics for the nanocomposite powders investigated at 250 and 275 °C are shown in Fig. 14c and d. The sample examined at 275 °C showed excellent desorption kinetics, demonstrated by the relatively short time (∼5 min) required to release approximately −4.4 wt% of hydrogen (Fig. 14d). This sample reached a very close saturation value (−5.2 wt% H2) after only 10 min, as shown in Fig. 14d. The sample measure at 250 °C took about 5 and 10 min to release about −1.1 and −2.4 wt% H2, respectively, as shown in Fig. 14d. After 15 min of desorption time (Fig. 14c), the samples examined at 275 and 250 °C released about −5.3 and −3.8 wt% H2, respectively. About 40 min was required for the sample examined at 250 °C to desorb its full hydrogen storage capacity (−5.1 wt% H2), as shown in Fig. 14c. This hydrogen storage nanocomposite system revealed a good cyclability (600 complete cycles), conducted at 275 °C without serious kinetic degradation.89
The first report of using metallic glassy (MG) Zr70Ni20Pd10 nanopowders as a catalytic agent to enhance the hydrogenation/dehydrogenation kinetics of MgH2 was introduced by El-Eskandarany in 2016.24 In his work, nanocrystalline MgH2 powders prepared using the RBM technique were doped with small mole fractions (5 wt%) of MG-Zr70Ni20Pd10 powders and then high energy ball-milled for 50 h under 50 bar of H2. The HRTEM image taken near the edge of the MgH2/5 wt% amorphous Zr70Ni30Pd10 composite particle obtained after 50 h of RBM time is shown in Fig. 15a together with the corresponding nano-beam diffraction pattern (NBDP) (Fig. 15b). Overall, the composite powders obtained after this stage of milling consisted of a continuous amorphous matrix (maze-like morphology; Fig. 15a) hosting ultrafine nanoclusters (∼4 nm in diameter) of an ordered-structure (related to MgH2).
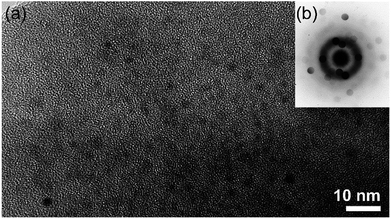 | ||
| Fig. 15 (a) HRTEM image of MgH2 powders doped with 5 wt% Zr70Ni30Pd10 and milled for 50 h, and (b) the corresponding NBDP.90 | ||
It is worth mentioning that the MgH2 grains were distributed into the metal glassy powders in a segregated fashion with the absence of agglomerates or aggregated grains, as displayed in Fig. 15a. The NBDP shows that a halo-diffraction pattern related to amorphous Zr70Ni30Pd10 coexisted with a spot-like pattern which originated from the nanocrystalline γ- and β-MgH2 phases oriented in different axial directions.94 The end-product (50 h) of the MgH2/5 wt% MG-Zr70Ni20Pd10 nanocomposite powders consisted of fine powders in the range between 180 to 500 nm, as presented in Fig. 16a. The scanning transmission electron microscopy-bright field imaging (STEM-BFI) and the corresponding scanning transmission electron microscopy-dark field imaging (STEM-DFI) of a selected nanocomposite MgH2/5 wt% MG-Zr70Ni30Pd10 powder particle are shown in Fig. 16a and b, respectively. The powders had an almost spherical-like morphology (Fig. 16b), containing fine lenses of less than 10 nm in diameter that were homogeneously distributed into the metallic glassy matrix (Fig. 16c and d). The fine spherical lenses corresponded to Mg (Fig. 16c), and the elemental mappings of Zr, Ni and Pd are presented in Fig. 16d, e, and f, respectively. The EDS-analysis indicated an excellent elemental distribution beyond the sub-micro level.24
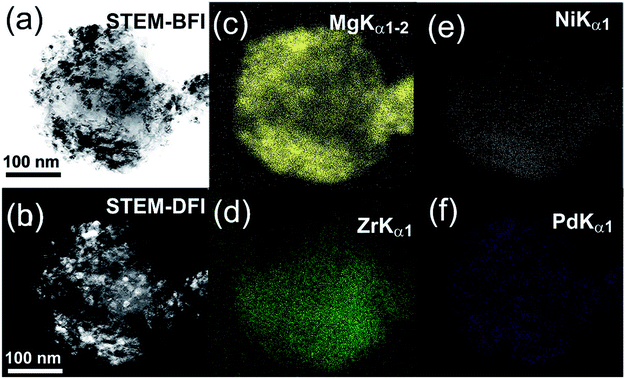 | ||
| Fig. 16 STEM-BFI and STEM-DFI images for MgH2 powders doped with 5 wt% Zr70Ni30Pd10 are displayed in (a) and (b), respectively. The X-ray-elemental mapping for Mg, Zr, Ni and Pd corresponding to (a) are presented in (c–f), respectively.24 | ||
Fig. 17a and b shows the PCT curves determined at 200 and 350 °C for the nanocomposite MgH2/5 wt% MG-Zr70Ni30Pd10 powders obtained after 50 h of ball milling (Fig. 17a) and the MgH2 powders obtained after 6 h of RBM time (Fig. 17b), respectively. For successful hydride formation (complete absorption) of the pure MgH2 sample, a high temperature (350 °C) and pressure (Pabs, in the range between 200 mbar to 40 bar) were required to absorb approximately 4.7 wt% H2, as shown in Fig. 17b. This indicates that the sample requires the application of a higher temperature to achieve the theoretical hydrogen storage capacity (7.6 wt% H2).
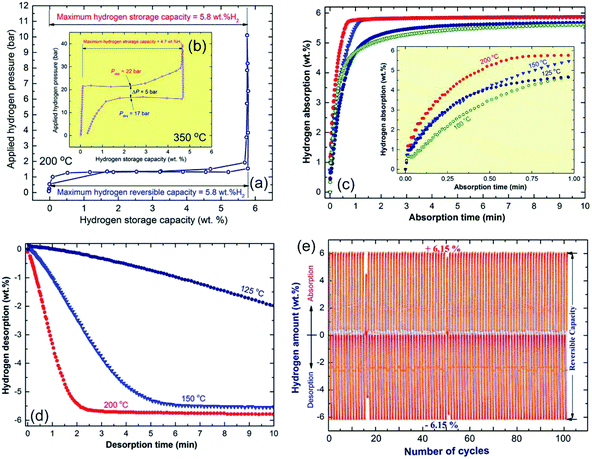 | ||
| Fig. 17 The PCT curves for the end-products of the ball-milled MgH2/5 wt% metallic glass Zr70Ni20Pd10 nanocomposite and MgH2 powders are shown in (a and b), respectively. Insets: the PCT experiment conducted at 200 °C for the nanocomposite powders (a), was accomplished at 350 °C for the MgH2 system (b). The hydrogenation/dehydrogenation kinetics for the MgH2/5 wt% metallic glass Zr70Ni20Pd10 nanocomposite and MgH2 powders as a function of the applied temperature are presented in (c) and (d), respectively. The cycle-life-time test for the end-product of the nanocomposite powders conducted at 200 °C is displayed in (e).24 | ||
Pure MgH2 showed a poor dehydrogenation behavior, this is exhibited by the clear pressure hysteresis with significant large gaps (∼17 bar) between the pressure needed for absorption (hydride formation), Pabs and the pressure required for hydride decomposition, Pdes, as presented in Fig. 17b. In addition, pure MgH2 powders obtained after 6 h of RBM time failed to release the stored hydrogen content completely, even after 12 h of desorption time (Fig. 17b). In contrast to the pure MgH2 sample, the nanocomposite powders showed excellent PCT hydrogenation/dehydrogenation curves, demonstrated by the complete hydrogen sorption/desorption event at a lower temperature (200 °C) and pressure (50 mbar to 10 bar), as shown in Fig. 16a.
At a relative low temperature and pressure, the nanocomposite sample reached a higher value of hydrogen storage capacity (5.8 wt%) when compared with pure MgH2 (4.7 wt% H2). Moreover, the plateau region for the nanocomposite sample was very flat with a negligible slope and with the absence of multistep hydrogenation/dehydrogenation, as shown in Fig. 17a. In addition, the sample succeed to achieve complete desorption through an almost flat PCT curve with a minimal difference value (∼72 mbar) between the Pabs and Pdes, as shown in Fig. 17a. Complete hydrogenation (Fig. 17c)/dehydrogenation (Fig. 17d) processes were successfully achieved with fast kinetics to charge/discharge about 6 wt% H2 at 200 °C within 1.18 min/3.8 min, respectively.24 In addition, this new nanocomposite system shows a high performance, achieving 100 continuous hydrogen charging/discharging cycles without degradation, as elucidated in Fig. 17e.
5.2 Mechanism of enhancing MgH2 kinetics upon doping with abrasive powders
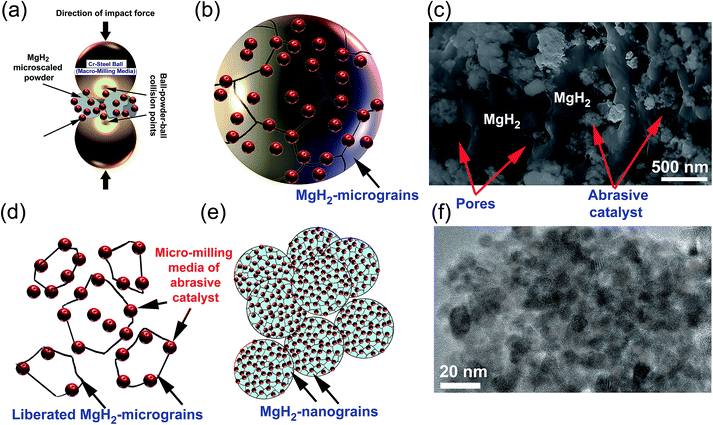
The present review article, which focuses on using selected abrasive powders of metal oxides, metal carbides, metal hydrides, and metastable Zr-based alloys, has shown that these catalytic agents are heterogeneous, in that they do not react with MgH2 to form an intermediate reactive phase with improved storage properties. Using the metallic glassy Zr70Ni20Pd10 powders, which did not undergo any structural changes or react with MgH2 up to 200 °C,24 as a typical example, we found that during the early stage of ball milling the ball-powder-ball collisions of MgH2 doped with abrasive nanopowders (micro-milling media) (Fig. 18a), led to break down of the large MgH2 powder particles and assisted the adherence of the fine powders onto the surface of the MgH2 particles (Fig. 18b). At this stage of milling, the hard nanopowders penetrated the oxide layer formed on the surfaces of the MgH2 powders to create micro-holes on their surfaces (Fig. 18c).Increasing the ball milling time led to “migration” of a large volume fraction of the abrasive milling media powders through the cavities and micro-channels created in the body of the MgH2 particles and located at their grains. Hence, they break up the large MgH2 grains along with their weak grain boundary zones (Fig. 18d) and form finer powders with a large volume fraction of nanostructured grains (Fig. 18e). As hydrogen diffusion is much faster along the grain boundaries when compared with inside the grains, the hydrogenation/dehydrogenation kinetic behaviors of MgH2 were gradually improved by increasing the number of “liberated” grains. During the last stage of ball milling, the role of the ball-powder-ball collisions in achieving further refining of the MgH2 powder particles was almost absent as the size of the powders became ultrafine (less than 1 μm). Accordingly, the final refining process was attained by the nanosized abrasive milling media, which were homogeneously distributed within MgH2 to form typical homogeneous nanocomposite powders (Fig. 18f).
5.3 Development of high performance pure MgH2 by severe plastic deformation
In spite of the beneficial effects obtained upon doping MgH2 with catalytic agents, these additives always lead to a significant decrease in the hydrogen storage capacity.91 Apart from doping MgH2 powders with catalysts, it has been experimentally demonstrated by some authors that changing the crystal structure of the stable β-tetragonal MgH2 phase to a less stable phase of γ-orthorhombic MgH2 leads to improved gas uptake/release kinetics and a decrease in the hydrogenation temperature without a drastic decrease in the storage capacity.91–93 β-to-γ phase transformations can be attained via severe plastic deformation (SPD)94 at ambient temperature using different approaches such as HEBM,95 cold rolling,96 equal channel angular pressing (ECAP),97 and high pressure torsion (HPT).98 Commonly the results of these employed techniques demonstrated that formation of a nanocrystalline phase along with introducing high intensity defects, leads to an increase of the density of the grain boundaries. The presence of these defects in the Mg lattice leads to the creation of nucleation points for hydrogenation, in which the existence of a large number of grain boundaries assists fast diffusion pathways for hydrogen.99Recently, a new metastable MgH2 nanocrystalline powder was discovered by a group at KISR.100 In that study, the as-prepared MgH2 powders were charged and sealed in a stainless steel (SUS304) tube (0.8 cm diameter and 20 cm length) inside a glove box under a helium gas atmosphere, as shown in Fig. 19a. The tube contained MgH2 powders that had undergone a severe CR process for a different number of passes (1 to 200 passes), using two-drum type manual cold rollers (11 cm wide × 5.5 cm in diameter), as displayed in Fig. 19b.
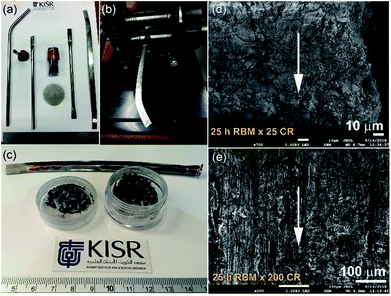 | ||
| Fig. 19 (a) The reactive ball milled MgH2 powders obtained after 25 h of HEBM under hydrogen were charged into SUS304 tubes and then cold-rolled for 200 passes (b). (c) A photograph of the powders obtained after 25 passes. FE-SEM micrographs taken at an accelerated voltage of 1 kV of MgH2 powders obtained after 25 h of RBM and then after CR for (d) 25, and (e) 200 passes.100 | ||
After 25 passes, the powders were agglomerated and formed large aggregates upon CR for 25 passes (Fig. 19c and d). After 200 passes, micro-bands with a thickness of 143 mm were developed as a result of cold working generated during the CR process (Fig. 19e). The as-prepared powders that underwent 200 CR passes were then subjected to HEBM under hydrogen gas for 50 h.
The XRD pattern of the CRed MgH2 powders obtained after 200 CR passes and then after HEBM for 50 h are displayed in Fig. 20a. Obviously, the Bragg peaks corresponding to the γ- and β-MgH2 phases completely vanished and were replaced with new Bragg peaks for a unreported phase, which appeared at scattering angles (2θ) of 35.034, 40.584, 58.758, 70.115, and 73.868 (Fig. 20a).
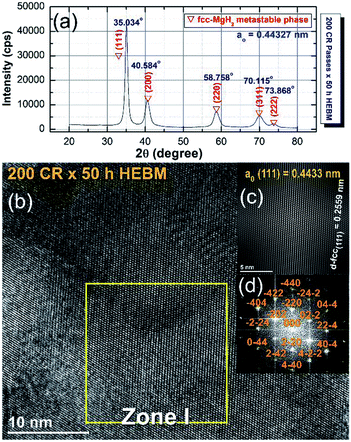 | ||
| Fig. 20 (a) XRD pattern of cold rolled MgH2 powders obtained after 200 passes and then HEBM for 50 h. (b) FE-HRTEM image; (c) filtered atomic resolution image of Zone I, and (d) FFT image of the MgH2 powders obtained after 25 h of RBM, then subsequently cold rolled for 200 passes and finally after HEBM for 50 h.100 | ||
X-ray diffraction analysis (XRD) analysis indicated that this newly discovered MgH2 phase has a face centered cubic structure (fcc) of space group, Fm![[3 with combining macron]](https://www.rsc.org/images/entities/char_0033_0304.gif) m(225). The lattice parameter (ao) for this phase, calculated from (111) was 0.44361 nm.100 The FE-HRTEM image of the powders cold rolled for 200 passes and then treated with HEBM for 50 h is shown in Fig. 20b. The image revealed a Moiré fringe image for the three related nanograins. Filtered-fringe images corresponding to Zone I are presented in Fig. 20b. The d-spacing related to fcc-MgH2 (111) was calculated and found to be 0.2559 nm, in which the corresponding ao was calculated and found to be 0.4433 nm. These values matched well with the results from the XRD analysis. The FFT image, which is displayed in Fig. 20c, was taken from Zone I and oriented to the [001] axis, and the corresponding FFT showed a spot-electron diffraction pattern related to fcc-MgH2 (111), as presented in Fig. 20d.
m(225). The lattice parameter (ao) for this phase, calculated from (111) was 0.44361 nm.100 The FE-HRTEM image of the powders cold rolled for 200 passes and then treated with HEBM for 50 h is shown in Fig. 20b. The image revealed a Moiré fringe image for the three related nanograins. Filtered-fringe images corresponding to Zone I are presented in Fig. 20b. The d-spacing related to fcc-MgH2 (111) was calculated and found to be 0.2559 nm, in which the corresponding ao was calculated and found to be 0.4433 nm. These values matched well with the results from the XRD analysis. The FFT image, which is displayed in Fig. 20c, was taken from Zone I and oriented to the [001] axis, and the corresponding FFT showed a spot-electron diffraction pattern related to fcc-MgH2 (111), as presented in Fig. 20d.
Fig. 21 displays the dehydrogenation kinetic behaviors of the cold rolled powder obtained after 200 passes and then after HEBM for 50 h (fcc-MgH2 phase). The measurements were conducted in the temperature range of 175 to 275 °C under 200 mbar without powders activation, and after activating the powders at 300 °C under 10 bar H2 (Fig. 21b). In order to maintain the crystal structure of the powders (fcc-MgH2 phase) obtained after this stage of milling, the desorption kinetic measurements were taken without activation for five individual samples (Fig. 21a). All of the samples successfully desorbed their hydrogen storage with different time scales. Generally, the fcc-MgH2 powders showed advanced dehydrogenation characteristics compared to the γ- and β-MgH2 phases.
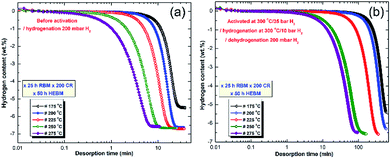 | ||
| Fig. 21 Dehydrogenation kinetics measured for 10 individual samples of MgH2 powders obtained after 25 h of RBM, and subsequently cold rolled for 200 passes and then HEBM for 50 h. The measurements were conducted under 200 mbar H2 (a) without powder activation, and (b) after activating the powders at 300 °C under 10 bar H2.100 | ||
At 175 °C, the sample desorbed ∼4 wt% H2 within 40 min (Fig. 21a). However, the powders desorbed about 6.5 wt% H2 within 22 min at 200 °C (Fig. 21a). Increasing the applied temperature to 225 and 250 °C, improved the dehydrogenation kinetics of fcc-MgH2, indicated by the short time required to desorb 6.6 wt% H2 in 17 min and 10 min, respectively (Fig. 21a). Outstanding desorption kinetics were found at 275 °C, when the sample desorbed 6.6 wt% H2 within 7 min, as elucidated in Fig. 21a. We should emphasize that the XRD patterns for the examined samples at a temperature range between 175 to 225 °C revealed the presence of Bragg peaks corresponding to the γ- and β-MgH2 phases. However, the XRD patterns for the samples examined at higher temperatures (250 and 275 °C) revealed diffraction lines for the hcp-Mg phase.
Fig. 21b displays the dehydrogenation kinetics conducted for the same samples shown in Fig. 21a, however, they were activated first at 300 °C (far above the transformation temperature of the fcc-MgH2 to γ- and β-MgH2 phases101) and under 25 bar H2. Based on this activation step condition, all of the samples lost their fcc-structure and completely transformed into γ- and β-MgH2 phases. This led to a significant reduction in the dehydrogenation kinetics, which became slow when compared with the same samples shown in Fig. 21a. For example, the sample examined at 175 °C required more than 650 min to desorb less than 5.5 wt% H2 (Fig. 21b). The two samples examined at 200 and 225 °C desorbed about 6.4 and 6.6 wt% H2 within 600 and 390 min, respectively (Fig. 21b). By comparing the necessary desorption time (100 min) for the sample examined at 275 °C to release 6.6 wt% H2 (Fig. 21b) with the time required (7 min) for the fcc-MgH2 sample (Fig. 10a) to desorb same hydrogen amount at the same temperature, we can see that the kinetics desorption of the fcc-MgH2 phase is 14 time faster than the γ- and β-MgH2 phases.
6. MgH2 for FC applications
In 2007, de Rangeo et al.102 reported the possibility of employing nanostructured MgH2 as a hydrogen storage media for a pilot reactor tank. In their study, a small-scale tank was developed and tested in different cooling conditions. At 280 °C, the system absorbed 4.9 wt% H2. The authors reported that it is essential to maintain the material below 370 °C to avoid the rapid crystal growth of Mg powders associated with a strong degradation of the kinetics of the hydriding/dehydriding reactions.102Same authors succeeded in enhancing the hydrogen sorption of MgH2, they used it in their first reactor model by mixing it with expanded natural graphite (ENG) and consolidating the powders into compacted disks.103 They reported that incorporating ENG before compression drastically improves the thermal conductivity in the direction normal to the compression axis. Moreover, the thermal conductivity increases linearly with the ENG content, and can be adjusted to fulfill the loading time requirements.103 Since then, different schools have introduced various studies focused on the design and manufacture of hydrogen reactors based on the MgH2-system.104–106
Based on the 8th Strategic Plan of KISR (2015–2020) for NAM/EBRC which concerns employing as-prepared Mg-nanocomposite powders for PEM-FC applications, we succeeded in implementing MgH2/10 wt% (8 Nb2O5/2 Ni) nanocomposite buttons in the charging of a cell-phone battery, using a homemade integrated Ti-tank/PEM-FFC system. Fig. 22 displays a summary of the experimental procedure for charging the Ti-reactor using the buttons, and Fig. 23 presents the setup of the Ti-tank/PEM-FFC integrated system. More details are presented elsewhere.17
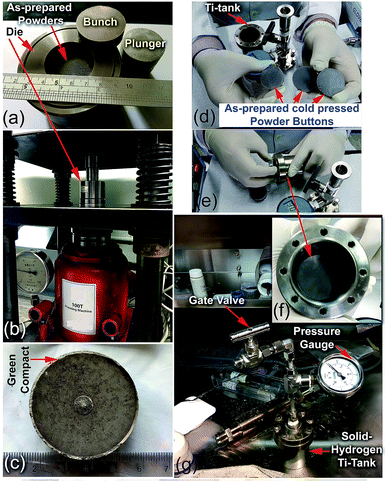 | ||
| Fig. 22 Preparation procedure used for the fabrication of the nanocomposite MgH2/8 wt% Nb2O5/2 wt% Ni disks. (a) About 30 g of the as-prepared nanocomposite powders were charged into a 3.25 mm-diameter tool steel powder die and sealed with upper/bottom bunches, and the plunger in the glove box was filled with a He gas atmosphere. The system was then subjected to an axial vertical load of 20 tons at ambient temperature for 50 h, using a 100 ton cold press (b). The as-prepared cold pressed solid-hydrogen nanocomposite system had a relative density of ∼68.7% (c). Three cold-pressed nanocomposite bulk samples with a total weight of about 87 g were placed into a high-pressure hollow vessel made of pure titanium metal (hydrogen tank) with the following dimensions: 8 cm high × 6.2 cm outer diameter × 5.4 cm inner diameter (d–f). The system was sealed with eight hexagonal bolts (hexagonal head cap screws) and connected to a high-pressure gate ball-valve with a 20 bar pressure gauge inside the glove box filled with He gas (g).17 | ||
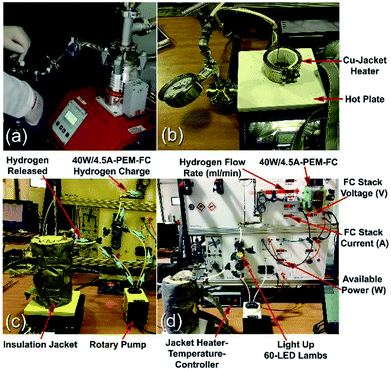 | ||
| Fig. 23 Solid-hydrogen storage tank integrated with a 40 W/4.5 A PEM-FC system. (a) The Ti-tank containing the nanocomposite disks was evacuated using a rotary/molecular pump; (b) the temperature controlled hotplate and Cu-jacket heater; (c) the Ti-tank hydrogen storage system was filled with MgH2/8 wt% Nb2O5/2 wt% Ni nanocomposite disks; and (d) the solid-hydrogen tank was coupled with a 40 W/4.5 A PEM-FC.17 | ||
The hydrogen released from the nanocomposite buttons upon heating of the storage system to 225 °C was used to feed the PEM-FC. Fig. 24a presents the experimental set up utilized for charging the battery of a cell phone device through a 5 V voltage regulator. The PEM-FC system is controlled and operated using software in which the data output corresponding to the hydrogen flow rate, voltage and current were obtained and stored. During the first few min (0.033 min) of the battery charging time, conducted at 225 °C the MgH2 powders were completely decomposed, and the pressure of the released hydrogen was saturated at a value of 20 bar, as indicated in Fig. 24c. To avoid any reaction between the Mg powders and the hydrogen gas released and stored inside the Ti-tank, the heating process for the system was immediately stopped. Then, the ball gate valve was opened and the rotary pump facilitated the succession of H2 towards the PEM-fuel cell (Fig. 25).
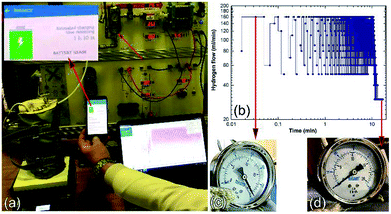 | ||
| Fig. 24 Charging of a battery for a cell phone device via a solid-hydrogen storage tank integrated with a 40 W/4.5 A PEM-FC system. (a) The hydrogen storage system filled with MgH2/8 wt% Nb2O5/2 wt% Ni nanocomposite disks coupled with 40 W/4.5 A PEM-FC to charge the battery of a cell phone device. The hydrogen flow during the cell-phone charging process is displayed in (b) as a function of the battery charging time, (c) and (d) show the hydrogen pressure of the Ti-tank at the initial and final charging stages, respectively.17 | ||
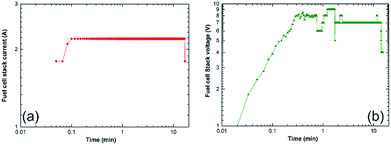 | ||
| Fig. 25 Correlation between the charging time and (a) the fuel cell-stack current, and (b) the voltage upon the charging of a cell phone battery via a solid-hydrogen storage tank integrated with 40 W/4.5 A PEM-FC system.17 | ||
The monotonical decrease of the H2 pressure inside the Ti-tank upon increasing the battery charging time implies that a continuous amount of hydrogen gas was delivered to the PEM-fuel cell. It should be mentioned that using a rotary pump led to delivery of the hydrogen gas to the fuel cell at a constant rate of ∼160 ml min−1, as shown in Fig. 24b.
7. Conclusions and closing remarks
Developing alternate energy sources has become necessary for the sustainable common future of our planet. Nowadays, invention and innovations dedicated to discovering advanced green energy systems are rapidly moving towards real applications. Accordingly, research activities related to alternative energy have recently been considered as excellent opportunities for starting promising new businesses.For a long time, hydrogen has been seriously considered to be an ideal energy carrier and it has a tremendous amount of attractive properties, making it a unique clean energy option for the future. Despite this, hydrogen does not show fast growth owing to critical issues linked to the high cost required for production and intellectual technical challenges related to the transportation and storage. Hydrogen storage, which spans both hydrogen production and hydrogen applications, plays an important role in initiating a hydrogen economy.107
Within the last three decades, this subject has received significant attention, demonstrated by the great number of intensive research activities related to this important area.107 Apart from the traditional methods of hydrogen storage, hydrogen can be successfully stored with a high gravimetric density in some light metals such as Li, Be, Na, Mg and Al. In spite of the high mass density of LiH (12.6 wt%) and BeH2 (18.2 wt%), they decompose at a very high temperature which restricts their fuel cell applications. Moreover, NaH, which releases hydrogen in a temperature range between 430 and 500 °C, has a very low storage capacity of 4.2 wt%. Although AlH3 has a good storage capacity (10 wt%) and a relatively low decomposition temperature (60–140 °C), AlH3 is not reversible. Schneemann et al.108 have recently published an important review article, discussing the potential applications of different nanostructured metal hydrides and their hydrogen storage properties.108
MgH2, with its high storage capacity (7.6 wt%), great cyclability, natural abundance, and low cost has been considered as the most suitable hydrogen storage material for fuel cell applications. Unfortunately, MgH2 has several drawbacks related to its high thermal stability, slow kinetics of hydrogenation and dehydrogenation and high apparent activation energy. All of these disadvantages restrict its immediate employment in fuel cell applications. Within the last few years, many review articles have presented and discussed the possibility of designing Mg-based nanomaterials for hydrogen storage.107–109 In 2017, a comprehensive review article published by Zhang et al. presented the recent progress achieved to improve MgH2 through catalytic agents and nanoconfinement.110
Mg and Mg2Ni were suggested 52 years ago as being suitable for use in internal combustion engines in the car industry.110 In this work, the heat generated from the exhaust gas of the vehicle was utilized as the heat necessary for releasing hydrogen.111,112 In addition, Mg-based materials, in particularly Mg2Ni alloy, have been extensively proposed for waste heat recovery and for use as thermal batteries for concentrating solar thermal power.109,113 Recently, Sheppard et al. published a very important review article discussing the potential applications of using metal hydrides, in particularly Mg-based alloys, concentrating on thermal power storage applications.114
This review article has presented the enormous efforts devoted to improving the hydrogenation and dehydrogenation behaviors of MgH2 through three strategies. The philosophy of the first strategy depends on melting metal Mg with alloying element(s) to reduce the high enthalpy change of formation for MgH2 and to enhance the kinetics. Using heavy metals such as Ni, Pd, and Nd leads to a significant reduction in the storage capacity of MgH2 with no significant improvement in the decomposition temperature.
In the second strategy, MgH2 is mechanically-doped with different types of catalyst/nanocatalysts, using HEBM under reactive hydrogen or inert gas. The catalysts used in this approach can be classified into pure metals, intermetallic compounds and alloys, metal oxides, metal/metal oxide nanocomposites, and hard refractory materials of metal carbides and nitrides. In contrast to the first strategy, doping MgH2 with some typical nanocatalysts such as Nb2O5, V2O5, Cr2O3, composites of Ni/Nb2O5, TiC, Ti0.4Cr0.15Mn0.15V0.3, TiH2, and NbH have shown outstanding beneficial effects in improving the gas uptake/release kinetics and reduction of both the hydrogenation/dehydrogenation temperature and apparent activation energy of decomposition. However, doping the hydride phase with a high volume fraction of catalytic agents (above 10 wt%) always leads to a significant degradation in the storage capacity.
The philosophy of the last strategy depends on introducing a heavy network of lattice imperfections and defects to Mg, pure MgH2, and Mg-based alloys without using any type of catalyst. This mechanical treatment regime has been successfully achieved by subjecting the powders to long-term HEBM through mechanically-induced cyclic phase transformations. β–γ and cyclic β–γ–β phase transformations are always coupled with a dramatic decrease in the grain sizes of the MgH2 powders. As hydrogen diffusion along the grain boundaries is much faster than diffusion in the side grains, the hydrogenation/dehydrogenation kinetics of MgH2 are dramatically improved upon production of such fine nanostructured grains, containing a large number of grain boundaries.
Furthermore, this work elucidated the research activities related to hydrogen storage taking place at the Kuwait Institute for Scientific Research since 2010. Like many other international laboratories in the world, we aim to develop and implement new categories of MgH2-based nanocomposites for fuel cell applications. Our strategy is dedicated to synthesizing and improving MgH2-materials based on employing RBM techniques under a hydrogen atmosphere to synthesize nanocrystalline MgH2 powders. Our results have shown that cold rolling of as-prepared milled MgH2 powders led to a superior improvement in the kinetics without drastic decreasing the storage capacity. In addition, we have employed a micro-milling media of abrasive metal oxides, metal carbides, and intermetallic compounds, as well as metastable powders for refining MgH2 grains. The nanocomposite MgH2/abrasive micro-milling powders possessed excellent hydrogenation/dehydrogenation kinetics with very long charging/discharging cyclability at rather low temperatures. We also introduced a new in situ catalytic approach for doping MgH2 powders through a single step, using a solid ball-milling media.
Conflicts of interest
There are no conflicts to declare.Acknowledgements
The author would like to express his sincere gratitude to Dr Samira A. S. Omar, the Director General of the Kuwait Institute for Scientific Research for her continuous encouragement and support. I would like also to express my very great appreciation to Dr Osamah Alsayegh, the Executive Director of the Energy and Building Research Center, Kuwait Institute for Scientific Research for his great and continuous support. I am particularly grateful for the technical support given by my colleagues, working in the Solid-State Hydrogen Storage Materials group, the Nanotechnology and Advanced Materials Program, Energy and the Building Research Center, at the Kuwait Institute for Scientific Research. The financial support received by the Kuwait Government through the Kuwait Institute for Scientific Research for purchasing the equipment used in the present work using the budget dedicated to the project led by the author (P-KISR-06-04) at the Establishing Nanotechnology Center in KISR, is highly appreciated. Appreciation is extended to the Kuwait Foundation for the Advancement of Sciences (KFAS) for the partial financial support of this study related to Project EA061C under contract number: P315-35EC-01 and Project EA078C under contract number: PR1814SP12. The financial support received from Kuwait Petroleum Corporation (KPC) for purchasing the golf cart used in the present investigation is highly appreciated.Notes and references
- International Energy Agency, Key world energy statistics, 2017, http://https://www.iea.org/publications/freepublications/publication/KeyWorld2017.pdf Search PubMed.
- Energy Information Administration (EIA), U.S. energy-related carbon dioxide emissions, 2014, U.S. Department of Energy, Washington, DC, 2015, Online at http://www.eia.gov/environment/emissions/carbon/, accessed on January 12, 2019 Search PubMed.
- R. B. Jackson, C. Le Quéré, R. M. Andrew, J. G. Canadell, G. P. Peters and J. Roy, et al., Environ. Res. Lett., 2017, 12, 110202, DOI:10.1088/1748-9326/aa9662.
- W. I. F. David, Faraday Discuss., 2011, 151, 399–414 RSC.
- P. T. Latake, P. Pawar and A. C. Ranveer, International Journal of Innovative Research and Creative Technology, 2015, 1, 333–337 Search PubMed.
- S. Maryam, Int. J. Hydrogen Energy, 2017, 42, 24927–24938 CrossRef CAS.
- G. Marbán and T. Valdés-Solís, Int. J. Hydrogen Energy, 2007, 32, 1625–1637 CrossRef.
- E. Lanzia, E. Verdolinia and I. Haščič, Energy Policy, 2011, 39, 7000–7014 CrossRef.
- S. Banerjee and A. K. Tyagi, Functional Materials Preparation, Processing and Applications, Elsevier, 1st edn, 2011, ISBN: 9780123851420 Search PubMed.
- M. Moreno-Benito, P. Agnolucci and L. G. Papageorgiou, Comput. Chem. Eng., 2017, 102, 110–127 CrossRef CAS.
- M. Sherif El-Eskandarany, H. Al-Matrouk, E. Shaban and A. Al-Duweesh, Energy, 2015, 91, 274–282 CrossRef.
- G. Walker, Solid-state hydrogen storage: Materials and Chemistry, Woodhead Publishing Limited, New York, 1st edn, 2008, ch. 1 Search PubMed.
- T. N. Veziroğlu and S. Sümer, Energy Convers. Manage., 2008, 49, 1820–1831 CrossRef.
- M. S. El-Eskandarany, Mechanical Alloying: Nanotechnology, Materials Science and Powder Metallurgy, Elsevier Inc., Oxford, 2nd edn, 2015, ch. 9 Search PubMed.
- L. Schlapbach and A. Züttel, Nature, 2001, 414, 353–358 CrossRef CAS PubMed.
- M. Sherif El-Eskandarany, E. Shaban, F. Aldakheel, A. Alkandary, M. Behbehani and M. Al-Saidi, Sci. Rep., 2018, 7, 13296, DOI:10.1038/s41598-017-13483-0 , http://www.nature.com/scientificreports, .
- M. Sherif El-Eskandarany, E. Al-Nasrallah, M. Banyan and F. Al-Ajmi, Int. J. Hydrogen Energy, 2018, 27, 23382–23396 CrossRef.
- T. Sinigaglia, F. Lewiski, M. E. S. Martins and J. C. M. Siluk, Int. J. Hydrogen Energy, 2017, 42, 24597–24611 CrossRef CAS.
- G. Walker, Solid-state hydrogen storage: Materials and chemistry, Woodhead Publishing Limited, New York, 1st edn, 2008, ch. 4 Search PubMed.
- I. P. Jain, C. Lal and A. Jain, Int. J. Hydrogen Energy, 2010, 35, 5133–5144 CrossRef CAS.
- P. Moriarty and D. A. Honnery, Int. J. Hydrogen Energy, 2010, 35, 12374–12380 CrossRef CAS.
- N. T. Stetson, S. McWhorter and C. C. Ahn, Compendium of Hydrogen Energy, ed. R. B. Gupta, A. Basile and T. N. Veziroğlu, Oxford Elsevier, 2016, ch. 1, vol. 2 Search PubMed.
- A. Züttel, Mater. Today, 2003, 6, 24–33 CrossRef.
- M. S. El-Eskandarany, Sci. Rep., 2016, 6, 26936, DOI:10.1038/srep26936.
- N. A. A. Rusman and M. Dahari, Int. J. Hydrogen Energy, 2016, 411, 12108–12126 CrossRef.
- S. Sherif, F. Barbir and T. Veziroglu, J. Sci. Ind. Res., 2003, 62, 46–63 CAS.
- L. Z. Ouyang, H. W. Dong, C. H. Peng, L. X. Sun and M. A. Zhu, Int. J. Hydrogen Energy, 2007, 32, 3929–3935 CrossRef CAS.
- R. K. Ahluwalia, T. Q. Hua and J.-K. Peng, Int. J. Hydrogen Energy, 2007, 32, 3592–3602 CrossRef CAS.
- M. Ismail, Energy, 2015, 79, 177–182 CrossRef CAS.
- S. A. Aceves, G. Petitpas, F. Espinosa-Loza, M. J. Matthews and E. Ledesma-Orozco, Int. J. Hydrogen Energy, 2013, 38, 2480–2489 CrossRef CAS.
- A. C. Dillon, K. M. Jones, T. A. Bekkedahl, C. H. Kiang, D. S. Bethune and M. J. Heben, Nature, 1997, 386, 377–379 CrossRef CAS.
- L. Angela and T. P. Yang, J. Catal., 2002, 206, 165–168 CrossRef.
- M. L. Seung, H. A. Kay, Y. H. Li, S. Gotthard and F. A. Thomas, J. Am. Chem. Soc., 2001, 123, 5059–5063 CrossRef.
- R. Balderas-Xicohténcatl, P. Schmieder, D. Denysenko, D. Volkmer and M. Hirscher, Energy Technol., 2017, 6, 510–512 CrossRef.
- T. Graham, Proc. R. Soc. London, 1868, 17, 212–220 Search PubMed.
- B. Sakintuna, F. Lamari-Darkrim and M. Hirscher, Int. J. Hydrogen Energy, 2007, 32, 1121–1140 CrossRef CAS.
- J. M. Blackman, J. W. Patrick, A. Arenillas, W. Shi and C. E. Snape, Carbon, 2006, 44, 1376–1385 CrossRef CAS.
- M. V. Lototskyy, I. Tolj, L. Pickering, C. Sita, F. Barbir and V. Yartys, Prog. Nat. Sci.: Mater. Int., 2017, 27, 3–20 CrossRef CAS.
- C. Pistidda, N. Bergemann, J. Wurr, A. Rzeszuteket, K. T. MØller and B. R. S. Hansen, et al., J. Power Sources, 2014, 270, 554–563 CrossRef CAS.
- R. Hardian, C. Pistidda, A.-L. Chaudhary, G. Capurso, G. Gizer and H. Cao, et al., Int. J. Hydrogen Energy, 2018, 43, 16738–16748 CrossRef CAS.
- M. Polanski, D. Nawra and D. Zasada, J. Alloys Compd., 2019, 776, 1029–1040 CrossRef CAS.
- J. F. Stampfer, C. E. Holley and J. F. Suttle, J. Am. Chem. Soc., 1960, 82, 3504–3508 CrossRef CAS.
- F. H. Ellinger, C. E. Holley Jr, B. B. McInteer, D. Pavone, R. M. Potter and E. Staritzky, et al., J. Am. Chem. Soc., 1955, 77, 2647–2648 CrossRef CAS.
- A. Calka, Appl. Phys. Lett., 1991, 59, 1568–1570 CrossRef CAS.
- M. Sherif El-Eskandarany, K. Sumiyama, K. Aoki and K. Suzuki, Mater. Sci. Forum, 1992, 88, 801–808 Search PubMed.
- M. Sherif El-Eskandarany, A. Alkandary, F. Aldakheel, M. Al-Saidi, F. Al-Ajmi and M. Banyan, RSC Adv., 2018, 8, 38175–38185 RSC.
- I. P. Jain, Int. J. Hydrogen Energy, 2009, 34, 7368–7378 CrossRef CAS.
- R. A. Varin, T. Czujko and Z. S. Wronski, Nanomaterials for Solid State Hydrogen Storage, Springer Science+Business Media, LLC, 1st edn, 2009, ch. 1 Search PubMed.
- C. J. Webb, J. Phys. Chem. Solids, 2015, 84, 96 CrossRef CAS.
- P. Moretto, C. Zlotea, F. Dolci, A. Amieiro, J. L. Bobet and A. Borgschulte, et al., Int. J. Hydrogen Energy, 2013, 38, 6704–6717 CrossRef CAS.
- B. Bogdanović, K. Bohmhammel, B. Christ, A. Reiser, K. Schlichte and R. Vehlen, et al., J. Alloys Compd., 1999, 282, 84–92 CrossRef.
- C. P. Camirand, Thermochim. Acta, 2004, 417, 1–4 CrossRef CAS.
- Y. Xiong, J. Ba, W. Qing and W. Jing, Journal of Plasma and Fusion Research SERIES, 2013, 10, 94–97 Search PubMed.
- T. Yamada, J. Yin and K. Tanaka, Mater. Trans., 2001, 42, 2415–2421 CrossRef CAS.
- G. Liang, J. Huot, S. Boily, A. Van Neste and R. Schulz, J. Alloys Compd., 1999, 292, 247–252 CrossRef CAS.
- A. Zaluska, L. Zaluski and J. O. Ström-Olsen, J. Alloys Compd., 1999, 288, 217–225 CrossRef CAS.
- Y. Sun, C. Shen, Q. Lai, W. Liu, D.-W. Wang, K. Francois and A. Zinsou, Energy Storage Materials, 2018, 10, 168–198 CrossRef.
- J. Chen, G. Xia, Z. Guo, Z. Huang, H. Liu and X. Yu, J. Mater. Chem. A, 2015, 3, 15843–15848 RSC.
- X. Ding, Y. Li, F. Fang, D. Sun and Q. Zhang, J. Mater. Chem. A, 2017, 5, 5067–5076 RSC.
- A. Karty, J. Grunzweig-Genossar and P. S. Rudman, J. Appl. Phys., 1979, 50, 7200–7209 CrossRef CAS.
- J. M. Boulet and N. J. Gerard, J. Less-Common Met., 1981, 89, 151–161 CrossRef.
- A. Zaluska, L. Zaluski and J. O. Ström-Olsen, J. Alloys Compd., 1999, 289, 197–206 CrossRef CAS.
- K. Dutta and O. N. Srivastava, Synthesis, J. Mater. Sci., 1993, 28, 3457–3462 CrossRef CAS.
- P. Mandal, K. Dutta, K. Ramakrishna, K. Sapru and O. N. Srivastava, J. Alloys Compd., 1992, 184, 1–9 CrossRef CAS.
- P. Wang, H. F. Zhang, B. Z. Ding and Z. Q. Hu, Acta Mater., 2001, 49, 921–926 CrossRef CAS.
- Y. Fu, M. Groll, R. Mertz and R. Kulenovic, J. Alloys Compd., 2008, 460, 607–613 CrossRef CAS.
- S. Agarwal, A. Aurora, A. Jain, I. P. Jain and A. Montone, Int. J. Hydrogen Energy, 2009, 34, 9157–9162 CrossRef CAS.
- X. B. Yu, Z. X. Yang, H. K. Liu, D. M. Grant and G. S. Walker, Int. J. Hydrogen Energy, 2010, 35, 6338–6344 CrossRef CAS.
- Z. Dehouche, H. A. Peretti, S. Hamoudia, Y. Yooc and K. Belkacemi, J. Alloys Compd., 2008, 455, 432–439 CrossRef CAS.
- C. Zhou, Z. Z. Fang, C. Ren, J. Li and J. Lu, J. Phys. Chem. C, 2013, 117, 12973–12980 CrossRef CAS.
- C. Ren, Z. Z. Fang, C. Zhou, J. Lu, Y. Ren and X. Zhang, J. Phys. Chem. C, 2014, 118, 21784–21790 Search PubMed.
- R. Vijay, R. Sundaresan, M. P. Maiya, S. Srinivasa Murthy, Y. Fu and H. P. Klein, et al., J. Alloys Compd., 2004, 384, 283–295 CrossRef CAS.
- W. Oelerich, T. Klassen and R. Bormann, J. Alloys Compd., 2001, 315, 237–242 CrossRef CAS.
- K.-F. Aguey-Zinsou, J. R. Ares Fernandez, T. Klassen and R. Bormann, Int. J. Hydrogen Energy, 2007, 32, 2400–2407 CrossRef CAS.
- N. Hanada, T. Ichikawa, S. Hino and H. Fujii, J. Alloys Compd., 2006, 420, 46–49 CrossRef CAS.
- M. O. T. da Conceição, M. C. Brum, D. S. dos Santos and M. L. Dias, J. Alloys Compd., 2013, 550, 179–184 CrossRef.
- P. Wang, A. M. Wang, H. F. Zhang, B. Z. Ding and Z. Q. Hu, J. Alloys Compd., 2000, 313, 218–223 CrossRef CAS.
- I.-H. Kwon, J.-L. Bobet, J.-S. Bae and M.-Y. Song, J. Alloys Compd., 2005, 396, 264–268 CrossRef CAS.
- Z. Dehouche, T. Klassen, W. Oelerich, J. Goyette, T. K. Bose and R. Schulz, J. Alloys Compd., 2002, 347, 319–323 CrossRef CAS.
- A. Bhatnagar, S. K. Pandey, A. K. Vishwakarma, S. Singh, V. Shukla, P. K Soni, M. A. Shaz and O. N. Srivastava, J. Mater. Chem. A, 2016, 4, 14761–14772 RSC.
- R. Gupta, F. Agresti, S. L. Russo, A. Maddalena, P. Palade and G. Principi, J. Alloys Compd., 2008, 450, 310–313 CrossRef CAS.
- M. Sherif El-Eskandarany, E. Shaban, N. Ali, F. Aldakheel and A. Alkandary, Method of synthesizing MgH2/Ni nanocomposites, US Pat. 9,828,245 B1, Nov. 28, 2017.
- M. Sherif El-Eskandarany, E. Shaban, N. Ali, F. Aldakheel and A. Alkandary, Sci. Rep., 2016, 6, 37335, DOI:10.1038/srep37335.
- M. Sherif El-Eskandarany, E. Shaban and A. Al-Shemmiri, Int. J. Hydrogen Energy, 2014, 39, 21097–21106 CrossRef.
- M. Sherif El-Eskandarany and E. Shaban, Materials, 2015, 8, 6880–6892 CrossRef PubMed.
- M. Sherif El-Eskandarany and A. Al-Hazza, Mater. Charact., 2014, 97, 92–100 CrossRef CAS.
- M. Sherif El-Eskandarany, E. Shaban and A. Alsairafi, Energy, 2016, 104, 158–170 CrossRef.
- M. Sherif El-Eskandarany, H. Al-Matrouk and E. Shaban, Int. J. Hydrogen Energy, 2015, 40, 10139–10149 CrossRef.
- M. Sherif El-Eskandarany, E. Shaban, H. Al-Matrouk, M. Behbehani, A. Alkandary and F. Aldakheel, et al., Materials Today Energy, 2017, 3, 60–71 CrossRef.
- M. Sherif El-Eskandarany, Composition for Hydrogen Storage, US Pat. 9,533,884 B1, Jan. 3, 2017.
- X. Xiao, Z. Liu, S. Saremi-Yarahmadi and D. H Gregory, Phys. Chem. Chem. Phys., 2016, 18, 10492–10498 RSC.
- K. Edalati, K. Kitabayashi, Y. Ikeda, J. Matsuda, H. Li, I. Tanaka, E. Akiba and Z. Horita, Scr. Mater., 2018, 157, 54–57 CrossRef CAS.
- C. Shen and K.-F. Aguey-Zinsou, J. Mater. Chem. A, 2017, 5, 8644–8652 RSC.
- R. Z. Valiev, R. K. Islamgaliev and I. V. Alexandrov, Prog. Mater. Sci., 2000, 45, 103–189 CrossRef CAS.
- M. S. El-Eskandarany, E. Shaban and B. Al-Halaili, Int. J. Hydrogen Energy, 2014, 39, 12727–12740 CrossRef CAS.
- S. Amira and J. Huot, J. Alloys Compd., 2012, 520, 287–294 CrossRef CAS.
- A. M. Jorge, G. F. de Lima, M. R. M. Triques, W. José Botta and T. G. Langdon, Int. J. Hydrogen Energy, 2014, 39, 3810–3821 CrossRef CAS.
- P. Vajeeston, P. Ravindran, A. Kjekshus and H. Fjellvåg, Phys. Rev. Lett., 2002, 89, 175506–175509 CrossRef CAS PubMed.
- Y. Mine, T. Tsumagari and Z. Horita, Scr. Mater., 2010, 63, 552–555 CrossRef CAS.
- M. Sherif El-Eskandarany, M. Banyan and F. Al-Ajmi, RSC Adv., 2018, 8, 32003–32008 RSC.
- P. Vajeeston, P. Ravindran, A. Kjekshus and H. Fjellvåg, Phys. Rev. Lett., 2002, 89, 175506–175509 CrossRef CAS PubMed.
- P. de Rangeo, A. Chaise, J. Charbonnier, D. Fruchart, M. Jehan and P. Marty, et al., J. Alloys Compd., 2007, 446–447, 52–57 CrossRef.
- A. Chaise, P. deRango, P. Marty, D. Fruchart, S. Miraglia and R. Olives, et al., Int. J. Hydrogen Energy, 2009, 34, 8589–8596 CrossRef CAS.
- A. Khandelwal, F. Agresti, G. Capurso, S. L. Russo and A. Maddalena, et al., Int. J. Hydrogen Energy, 2010, 35, 3565–3571 CrossRef CAS.
- G. Capurso, F. Agresti, R. S. Lo, A. Maddalena, G. Principi and A. Cavallari, et al., Int. J. Hydrogen Energy, 2011, 509S, S646–S649 Search PubMed.
- S. Garrier, C. Albin, P. De Rango, P. Marty, D. Fruchart and S. Miraglia, et al., Int. J. Hydrogen Energy, 2011, 36, 9719–9726 CrossRef CAS.
- Y. Jiaa, C. Sunc, S. Shend, J. Zoub, S. S. Maoe and X. Yaoa, Int. J. Hydrogen Energy, 2015, 44, 289–303 Search PubMed.
- A. Schneemann, J. L. White, S. Y. Kang, S. Jeong, L. F. Wan and E. S. Cho, et al., Chem. Rev., 2018, 118, 10775–10839 CrossRef CAS PubMed.
- V. A. Yarts, M. V. Lototskyy, E. Akiba, A. Albret, V. E. Antonov and J. R. Ares, et al., Int. J. Hydrogen Energy, 2019 DOI:10.1016/j.ijhydene.2018.12.212.
- J. Zhang, S. Yan and H. Qu, Int. J. Hydrogen Energy, 2018, 43(3), 1545–1565 CrossRef CAS.
- L. Schlapbach, Hydrogen in intermetallic compounds II: Surface and dynamic properties, applications, Topics in Applied Physics book series TAP, Springer, 1992, vol. 67 Search PubMed.
- J.-C. Crivello, R. V. Denys, M. Dornheim, M. Felderhoff, D. M. Grant and J. Huot, et al., Appl. Phys. A, 2016, 122, 85 CrossRef.
- J. B. von Colbe, J.-R. Ares, J. Barale, M. Baricco, C. Buckley and G. Capurso, et al., Int. J. Hydrogen Energy, 2019, 44(15), 7780 CrossRef.
- D. A. Sheppard, M. Paskevicius, T. D. Humphries, M. Felderhoff, G. Capurso and J. Bellosta von Colbe, et al., Appl. Phys. A, 2016, 122, 395 CrossRef.
| This journal is © The Royal Society of Chemistry 2019 |


