 Open Access Article
Xylopins A–F, six rare guaiane dimers with three different connecting modes from Xylopia vielana†
Yang-Guo Xie‡
a,
Rong Yan‡b,
Xianglong Zhongd,
Huang Piaob,
Ishaq Muhammada,
Xisong Keb,
Shikai Yana,
Yuanqiang Guo*e,
Hui-Zi Jin *ac and
Wei-Dong Zhang*abc
aShanghai Key Laboratory for Molecular Engineering of Chiral Drugs, School of Pharmacy, Shanghai Jiao Tong University, Shanghai 200240, China. E-mail: wdzhangy@hotmail.com; kimhz@sjtu.edu.cn; Fax: +86-21-34205989; Tel: +86-21-34205989
bInstitute of Interdisciplinary Sciences, Shanghai University of Tradictional Chinese Medicine, Shanghai 201203, China
cSchool of Pharmacy, Second Military Medical University, Shanghai, 200433, China
dDepartment of Pharmacy, Anhui University of Chinese Medicine, Hefei 320000, P. R. China
eState Key Laboratory of Medicinal Chemical Biology, College of Pharmacy, Tianjin Key Laboratory of Molecular Drug Research, Nankai University, Tianjin 300350, People's Republic of China. E-mail: victgyq@nankai.edu.cn
First published on 21st March 2019
Abstract
Six rare guaiane-type sesquiterpene dimers xylopins A–F, having three different connecting modes through two direct C–C bonds, were isolated from the roots of Xylopia vielana. Their absolute configurations were established by NOESY analysis, Cu Kα X-ray crystallography, and experimental and calculated electronic circular dichroism spectra. Flow cytometry demonstrated the fact that compound 6 arrested the cell cycle at G2 phase and concentration-dependently induced apoptosis of DU145 cells. Furthermore, the EPT2-TGC cell model, zebrafish study and western blot analysis illustrated compound 6 could induce apoptosis by efficiently inhibiting the Wnt/β-catenin signaling pathway via decreasing the expression of β-catenin.
Introduction
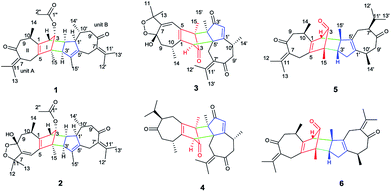
The genus Xylopia, which is one member of the family Annonaceae, whose bark and leaves are used for the treatment of irregular menstruation, rheumatism and pain.1 So far, phytochemical studies of the genus Xylopia led to the identification of nearly 80 compounds, such as flavonoids2,3 steroids,4 sesquiterpenes,4 alkaloids,5–8 diterpenes,9–11 diterpene dimers10,12,13 and sesquiterpene dimers.14,15 In a continuing search for biologically active compounds from X. vielana, six rare guaiane-type sesquiterpene dimers, having three different connecting patterns between two guaiane-type sesquiterpene, were isolated (Fig. 1). Sesquiterpene dimers from the genus Xylopia have been reported to have cytotoxicity, however, the cytotoxic mechanisms of the compounds have never been investigated.16,17 In our study, we discussed the discovery of a Wnt signaling pathway inhibitor from natural products. The Wnt/β-catenin signaling pathway is known to be associated with various diseases, such as tumorigenesis, diabetes, and schizophrenia.18 Our ongoing natural-product-based screening studies on Wnt pathways have identified and successfully isolated xylopin F (6), a unique sesquiterpene dimer, which induces apoptosis in DU145 cells by Wnt signaling pathway. Herein, we described the isolation and structural elucidation of these compounds as well as a screening study of the isolated compounds on Wnt signaling pathways.Results and discussion
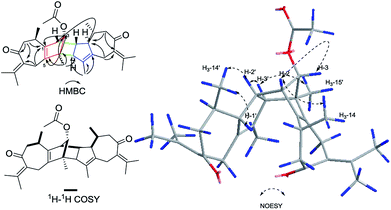
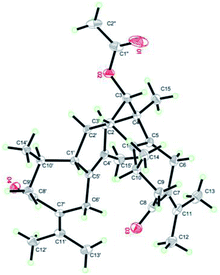
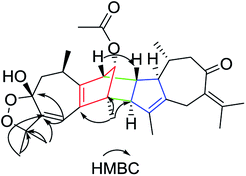
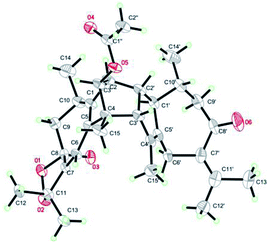
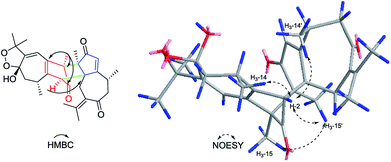
Xylopin A (1) was obtained as colorless crystals. Its molecular formula C32H42O4 was established by HR-ESI: m/z 513.2977 [M + Na]+ (calcd for C32H42O4Na+, 513.2975), containing 12 degrees of unsaturation. The 1D-NMR spectra of 1 showed 32 carbon resonances including nine methyls, four methylenes, seven methines, and 12 quaternary carbons, implying the presence of two sesquiterpene units (1A and 1B). In unit 1A, the HMBC cross-peaks from H-3 to C-1/C-5 and from H3-15 to C-3/C-4/C-5 suggested the appearance of a five-membered ring (I) (Fig. 2). Moreover, a seven-membered (II) was fused with five-membered ring (I) at C-1 and C-5 by analyses of the HMBC cross-peaks from H2-6 to C-1/C-7/C-5, from H-10 to C-1/C-8/C-9 and from H2-9 to C-1/C-8/C-10 (Fig. 2). Additionally, the HMBC cross-peaks from H3-12 to C-7/C-11 and from H3-13 to C-7/C-11 indicated that a methylethylidene group was connected to ring (II) at the C-7 (Fig. 2). On the basis of the above spectral analysis, the unit 1A was established as a guaiane unit. Similarly, unit 1B was also assigned as a guaiane unit due to the aid of key HMBC cross-peaks from H2-6′ to C-1′/C-7′/C-5′, H-10′ to C-1′/C-8′/C-9′ and H2-9′ to C-1′/C-8′/C-10′ (Fig. 2). Therefore, 1 was elucidated as a dimeric guaiane. The linkage of unit 1A and unit 1B via two direct C–C bonds (C-2 to C-2′, C-4 to C-3′) was deduced from the key HMBC cross-peaks from H3-15 to C-3′, H-2 to C-2′ and from H-1′ to C-2 (Fig. 2). Thus, the planar structure of 1 was confirmed by the above detailed analyses of NMR data. The relative configuration of 1 was deduced from the observed NOESY correlations. The key NOESY correlations of H3-14/H-2 indicated they were in the same face and assigned as β-oriented (Fig. 2), while the correlations of H-2′/H3-14′, H-1′/H3-14′ and H-3′/H3-15 placed them on the opposite side and assigned as α-oriented (Fig. 2). Finally, the absolute configuration was determined necessary to by a Cu Kα X-ray diffraction experiment and assigned as 2S, 3S, 4R, 10R, 1′R, 2′R, 3′R, 10′R (Fig. 3).Xylopin B (2) showed the [M + Na]+ peak at m/z 545.2876 by HRESI-MS (calcd 545.2874), consistent with the molecular formula C32H42O6. Comprehensive NMR data analysis of 2 displayed the presence of two guaiane units, which revealed its structural similarity to 1 except for the existence an another penta-ring at unit 2A. Interestingly, the chemical shift of C-8 (δC 102.8) and C-11 (δC 85.4) indicated that the five-membered ring involved a peroxide group between the C-8 and C-11 (Table 1). In unit 2A, the key HMBC correlation from H-6 to C-7/C-8, H3-12 to C-11/C-7 and H3-13 to C-11/C-7 verified that the five-membered ring was connected to seven-membered ring at C-7 and C-8 (Fig. 4). The two units 2A and 2B were linked through two direct C–C bonds (C-2 to C-2′, C-4 to C-3′) on the basis of the key HMBC correlation from H3-15 to C-3′, and H-2 to C-2′ (Fig. 4). The relative configuration of 2 was identical with 1 regarding with the same NOESY correlation. The stereochemistry of 2 was unambiguously determined by X-ray crystallography using Cu Kα radiation as 2S, 3S, 4R, 8S, 10R, 1′R, 2′R, 3′R, 10′R (Fig. 5).
| No. | 1 | 2 | ||
|---|---|---|---|---|
| δC | δH | δC | δH | |
| a δ in ppm; J in Hz within parentheses; measured at 125 MHz for 13C NMR and 500 MHz for 1H NMR in chloroform-d. | ||||
| 1 | 140.2 s | 146.7 s | ||
| 2 | 49.0 d | 2.60 dd (4.5, 1.9) | 50.1 d | 2.92 dd (4.6, 2.0) |
| 3 | 86.7 d | 4.21 d (2.0) | 86.0 d | 4.27 d (1.9) |
| 4 | 57.4 s | 55.5 s | ||
| 5 | 136.6 s | 131.3 s | ||
| 6 | 25.8 t | 3.14 d (17.0) | 112.2 d | 5.49 s |
| 2.70 m | ||||
| 7 | 134.5 s | 154.9 s | ||
| 8 | 203.9 s | 103.6 s | ||
| 9 | 48.1 t | 2.68 | 38.7 t | 2.10 dd (13.6, 5.7) |
| 2.54 dd (12.3, 4.5) | 1.69 t (13.1) | |||
| 10 | 35.3 d | 2.47 m | 33.2 d | 2.76 m |
| 11 | 139.8 s | 85.3 s | ||
| 12 | 22.7 q | 1.97 s | 24.7 q | 1.43 s |
| 13 | 22.8 q | 1.79 s | 27.4 q | 1.41 s |
| 14 | 20.0 q | 1.08 d (6.9) | 19.1 q | 1.24 d (7.1) |
| 15 | 14.7 q | 1.22 s | 14.7 q | 1.28 s |
| 1′ | 57.3 d | 1.64 m | 57.4 d | 1.85 m |
| 2′ | 48.0 d | 2.32 m | 48.5 d | 2.42 m |
| 3′ | 59.1 d | 2.79 d (8.0) | 58.8 d | 2.86 d (8.0) |
| 4′ | 134.6 s | 134.4 s | ||
| 5′ | 138.2 s | 138.3 s | ||
| 6′ | 28.2 t | 3.23 d (15.7) | 28.4 t | 3.23 d (15.1) |
| 2.66 dd (9.9, 7.4) | 2.61 d (15.1) | |||
| 7′ | 133.4 s | 133.1 s | ||
| 8′ | 206.1 s | 205.6 s | ||
| 9′ | 50.7 t | 2.66 dd (9.9, 7.4) | 50.9 t | 2.70 d (11.6) |
| 2.17 dd (11.4, 2.1) | 2.20 dd (11.6, 1.9) | |||
| 10′ | 41.3 d | 1.36 m | 41.2 d | 1.44 m |
| 11′ | 138.2 s | 140.4 s | ||
| 12′ | 22.3 q | 1.93 s | 22.5 q | 1.96 s |
| 13′ | 22.3 q | 1.82 s | 22.0 q | 1.83 s |
| 14′ | 21.8 q | 0.98 d (6.5) | 22.1 q | 1.04 d (6.5) |
| 15′ | 13.9 q | 1.40 d (1.9) | 13.7 q | 1.42 s |
| 1′ | 170.8 s | 170.8 s | ||
| 2′ | 21.1 q | 2.02 s | 21.6 q | 2.06 s |
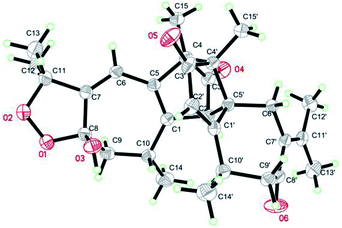
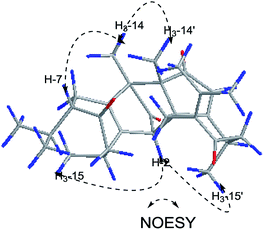
Xylopin C (3) exhibited a [M + Na]+ ion peak at m/z 515.2418 (calcd for 515.2404), with colorless crystals, ascribe to the molecular formula C30H36O6. Eight methyl groups, three methylene signals, five methines (two olefinic protons) were observed in the 1H NMR spectrum (Table 2). The NMR data of 3 were similar to those of 2, suggesting 3 showed the presence of two guaiane units but with a different linkage. In addition, the acetoxy group at C-3 in 2 was replaced by the acetate group in 3. The connection type of two units was via direct C–C bonds (C-2 to C-5′, C-4 to C-4′) due to the key HMBC correlations from H-2 to C-5, from H3-15 to C-4′ (Fig. 6). The α-orientation at H3-14, H-2, H3-15 and H3-14′ were confirmed by the NOESY correlations from H3-15/H3-15′, H-2/H3-14, H-2/H3-14′ and H-2/H3-15′ (Fig. 6). The key NOESY correlations of H-2/H3-15′ revealed that 3 was stacked arrangements of two sesquiterpene units A and B with endo-orientation. The absolute configuration of 3 was confirmed by a single-crystal X-ray diffraction analysis (2R, 4S, 8S, 10R, 4′R, 5′R, 10′R) (Fig. 7).
| No. | 3 | 4 | ||
|---|---|---|---|---|
| δC | δH | δC | δH | |
| a δ in ppm; J in Hz within parentheses; measured at 125 MHz for 13C NMR and 500 MHz for 1H NMR in chloroform-d. | ||||
| 1 | 143.4 s | 140.6 s | ||
| 2 | 55.1 d | 3.19 s | 53.9 d | 2.91 s |
| 3 | 200.7 s | 200.1 s | ||
| 4 | 54.1 s | 60.9 s | ||
| 5 | 131.2 s | 138.1 s | ||
| 6 | 110.4 d | 5.40 s | 23.2 t | 2.44 dd (13.3, 3.4) |
| 2.17 m | ||||
| 7 | 157.2 s | 59.2 d | 2.13 m | |
| 8 | 102.1 s | 213.3 s | ||
| 9 | 38.2 t | 2.00 dd (13.2, 5.8) | 46.6 t | 2.83 d (12.5) |
| 1.60 t (13.2) | 2.19 m | |||
| 10 | 31.6 d | 2.58 m | 34.8 d | 2.20 m |
| 11 | 85.6 s | 31.1 d | 1.83 m | |
| 12 | 26.9 q | 1.33 s | 20.3 q | 0.89 d (6.6) |
| 13 | 22.1 q | 1.41 s | 20.1 q | 0.88 d (6.6) |
| 14 | 17.1 q | 1.12 d (7.1) | 19.5 q | 1.07 d (6.6) |
| 15 | 7.2 q | 1.30 s | 7.9 q | 1.23 s |
| 1′ | 184.2 s | 183.5 s | ||
| 2′ | 131.2 d | 6.04 d (1.0) | 131.6 d | 6.05 s |
| 3′ | 208.8 s | 208.5 s | ||
| 4′ | 59.4 s | 54.5 s | ||
| 5′ | 57.2 s | 56.5 s | ||
| 6′ | 31.2 t | 2.59 d (15.0) | 31.2 t | 2.56 d (15.1) |
| 2.22 d (15.0) | 2.21 d (15.1) | |||
| 7′ | 131.2 s | 130.3 s | ||
| 8′ | 205.1 s | 204.3 s | ||
| 9′ | 48.1 t | 2.55 m | 49.5 t | 2.53 m |
| 10′ | 32.7 d | 2.53 m | 32.4 d | 2.43 m |
| 11′ | 146.9 s | 148.2 s | ||
| 12′ | 22.3 q | 2.06 s | 23.9 q | 2.06 s |
| 13′ | 22.4 q | 1.98 s | 23.4 q | 1.95 s |
| 14′ | 18.5 q | 1.29 d (6.0) | 19.2 q | 1.23 d (6.0) |
| 15′ | 12.1 q | 1.03 s | 13.4 q | 1.01 s |
Xylopin D (4) had the molecular formula C30H38O4 as determined by the HRESIMS at m/z 485.2670 [M + Na]+ (calcd for, 485.2662). Comprehensive interpretation of the 1D-NMR and 2D-NMR analysis of 4 were closely comparable to those of 3 except for the disappearance of the five-membered ring containing double oxygen bridge in unit 4A (Table 2). The linkage mode was consistent with 3 owing to the same key HMBC correlations. Furthermore, in NOESY spectrum, the relative configuration of H-7 was assigned as β-orientation on the basis of the correlation from H-7 to H3-15 (Fig. 8). The key NOESY correlations of H-2/H3-15′ indicated two guaiane units were endo-orientated. Thus, the absolute configuration of 4 was defined as (2R, 4S, 7S, 10R, 4′R, 5′R, 10′R) for the CD spectrum (Fig. S49†) matched well with the experimental result.
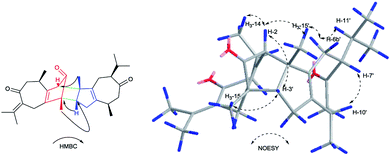
Xylopin E (5) was obtained as yellow oil. Its molecular formula C30H40O3 was established by HR-ESI: m/z 471.2880 [M + Na]+ (calcd for C30H40O3Na+, 471.2870), indicating 11 degrees of unsaturation. Careful analysis of the 13C NMR and DEPT spectrum showed 30 carbon signals, comprising eight methyls, five methylenes, six methines and 11 quaternary carbons (Table 3). Combined with 2D-NMR, 5 displayed the presence of two asymmetry guaiane units (5A and 5B). Unit 5A was highly similar with unit 1A except for the presence of the carbonyl group at C-3 instead of the acetate group, while unit 5B was in good agreement with unit 1A except for the presence of the carbonyl group at C-3. The linkage of units 5A and unit 5B via two direct C–C bonds (C-2 to C-4′, C-4 to C-3′) was deduced from the key HMBC cross-peaks from H-3′ to C-4, H3-15′ to C-2 and H3-15 to C-3′ (Fig. 9). Accordingly, the planar structure of 5 was confirmed as shown in Fig. 9. The relative configuration was determined by the NOESY experiments. The key NOESY correlations of H-2/H3-15′, H-2/H3-14, H-3′/H3-15, H-6b′/H3-15′, H-6b′/H3-11′ and H-7′/H3-10′ implied they were in the same side and assigned as β-oriented (Fig. 12). Furthermore, the key NOESY correlations of H-2/H-3′ indicated two guaiane units were endo-orientated. The absolute configuration of 5 was established from the CD spectrum and calculated ECD. The ECD spectra were calculated at the CAM-B3LYP/SVP level with the CPCM model in acetonitrile. The calculated ECD spectrum of 5 showed Cotton effects similar to those of the experimental results (Fig. S50†). Finally, the absolute configuration of 5 was assigned as 2S, 4R, 10R, 3′R, 4′S, 7′R, 10′R.
| No. | 6 | 7 | ||
|---|---|---|---|---|
| δC | δH | δC | δH | |
| a δ in ppm; J in Hz within parentheses; measured at 125 MHz for 13C NMR and 500 MHz for 1H NMR in chloroform-d. | ||||
| 1 | 141.9 s | 142.0 s | ||
| 2 | 58.1 d | 2.59 s | 58.1 d | 2.56 s |
| 3 | 203.3 s | 203.8 s | ||
| 4 | 59.3 s | 58.9 s | ||
| 5 | 135.6 s | 134.0 s | ||
| 6 | 26.5 t | 2.97 d (16.6) | 26.6 t | 3.32 d (17.0) |
| 2.80 d (16.6) | 3.05 d (17.0) | |||
| 7 | 134.1 s | 133.3 s | ||
| 8 | 213.3 s | 202.9 s | ||
| 9 | 47.5 t | 2.79 m | 48.0 t | 3.00 m |
| 2.32 dd (11.5, 4.7) | 2.44 dd (13.2, 6.6) | |||
| 10 | 33.9 d | 2.55 m | 33.9 d | 2.54 m |
| 11 | 141.7 s | 142.9 s | ||
| 12 | 23.1 q | 1.97 s | 23.2 q | 1.85 s |
| 13 | 22.6 q | 1.82 s | 23.1 q | 2.03 s |
| 14 | 20.7 q | 1.07 d (6.8) | 19.3 q | 1.06 d (6.9) |
| 15 | 11.2 q | 1.16 s | 24.1 q | 1.24 s |
| 1′ | 143.7 s | 143.9 s | ||
| 2′ | 37.2 t | 2.54 ddt (15.5, 7.8, 4.4) | 37.4 t | 2.55 d (8.7, 3.2) |
| 1.49 m | 1.42 m | |||
| 3′ | 49.8 d | 1.87 dd (9.8, 3.3) | 49.9 d | 1.88 m |
| 4′ | 59.1 s | 59.3 s | ||
| 5′ | 134.6 s | 134.6 s | ||
| 6′ | 24.2 t | 2.48 m | 26.7 t | 3.00 d (16.8) |
| 2.21 m | 2.78 d (16.8) | |||
| 7′ | 58.3 d | 2.15 m | 134.2 s | |
| 8′ | 204.7 s | 204.5 s | ||
| 9′ | 47.8 t | 3.07 m | 48.1 t | 2.77 m |
| 2.44 m | 2.57 m | |||
| 10′ | 32.9 d | 2.43 m | 32.9 d | 2.29 m |
| 11′ | 30.4 d | 1.86 m | 141.3 s | |
| 12′ | 20.1 q | 0.90 d (6.8) | 23.1 q | 2.03 s |
| 13′ | 19.2 q | 0.91 d (6.8) | 23.0 q | 1.99 s |
| 14′ | 18.9 q | 0.97 d (6.8) | 18.9 q | 0.96 d (6.9) |
| 15′ | 24.1 q | 1.22 s | 11.2 q | 1.23 s |
Xylopin F (6), was obtained as yellow oil. It gave the molecular formula C30H38O3, according to its positive HRESIMS at m/z 469.2726 [M + Na]+ (calcd for C30H38O3Na+ 469.2713). The 1D NMR data of 6 displayed 30 carbon signals, including eight CH3, five CH2, four CH and 13 quaternary carbons, which were almost identical to those of 5. The difference of 2 Da between the molecular weights of 5 and 6 suggested that 6 was dehydrogenation product of 5. This was confirmed by the upfield-shifted C-7 at δC 134.2 and C-11 at δC 141.3. The relative configuration of 6 was in good agreement with 5 due to the same NOESY cross peak. Consequently, the absolute configuration of 6 was the same as that of 5 owing to the similar CD effects (Fig. S51†) and assigned as 2S, 4R, 10R, 3′R, 4′S, 7′R, 10′R.
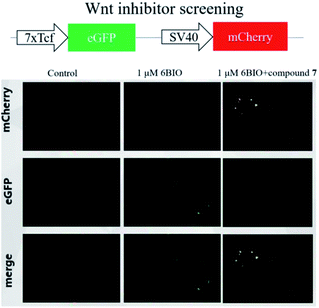
Compounds 1–6 were evaluated their inhibitory activities on Wnt signaling pathway by EPT2-TGC cell model and zebrafish study. Among these compounds, only compound 6 had an indirect effect on Wnt signaling pathway. For EPT2-TGC cell model, no significant Wnt pathway response was observed after administration of compound 6 (10, 20 μM) for 24 h. However, combined with Wnt signaling activator 6BIO (GSK3β inhibitor), the intensity of green fluorescence was decreased, which indicated compound 6 could regulate the Wnt signaling pathway (Fig. 10). For zebrafish embryo model, the embryos were treated with compound 6 and 6BIO (GSK3β inhibitor) at 6 h post-fertilization, for 48 h. The embryo's eyeless phenomenon was observed at 24 hpf (Fig. 11). The rescue rate in the 6BIO + compound 6 (20 μM) group was higher than that in the 6BIO group suggested 6 could regulate the Wnt signaling pathway (Table S1†).
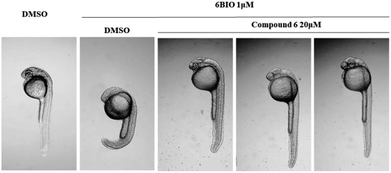 | ||
| Fig. 11 Zebrafish embryos at 6 h post fertilization (6 hpf) were treated with 6BIO (1 μM) and compound 6 (20 μM), and the eyeless phenotype was assessed 24 h later. | ||
To evaluate the inhibitory effect on human cancer cells, DU145 cells was tested for their in vitro antitumor activity using CKK-8 assays. All of the compounds with various concentrations ranging from 0.9375 μM to 30 μM were assayed independently three times. Taxol was treated as the positive control (IC50 = 1.66 μM). Compound 6 began to inhibit DU145 cells growth at 1.875 μM (IC50 = 19.5 μM), demonstrating that 6 displayed more potent cytotoxic activity on DU145 cells. However, the other compounds showed a weak inhibition against DU145 cells growth (IC50 > 30 μM). Cell apoptosis was determined using flow cytometry. As shown in Fig. 12A, DU145 cells in the G2 phase increased from 24.35% in control group to 27.76%, 31.57% and 40.87% in a concentration-dependent manner in DU145 cell lines indicated that compound 6 induced cell cycle arrest at the G2 phase. In addition, DU145 were treated with 10, 20 and 30 μM compound 6 for 24 h, and the apoptotic rates increased to 27.88%, 42.48% and 67.88%, respectively (vs. 10.63% in the control group) (Fig. 12B).
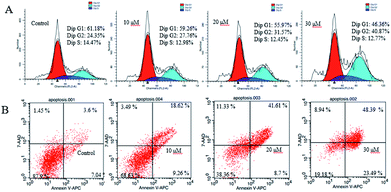 | ||
| Fig. 12 (A) Cell cycle analysis of compound 6 in DU145 cells by flow cytometry. (B) Flow cytometry analysis of apoptosis induced by compound 6 in DU145 cells. | ||
Owing to the above evidence, we tried to confirm whether compound 6 induced cell apoptosis via Wnt signaling pathway. Western blotting analysis revealed that the expression level β-catenin protein was down-regulated by compound 6 in a dose-dependent manner. In addition, compound 6 significantly increased the apoptosis-related protein expression of cleaved-parp and cleaved-caspase-3. Based on the results described above, compound 6 may induce DU145 cell apoptosis via the Wnt signaling pathway (Fig. 13).
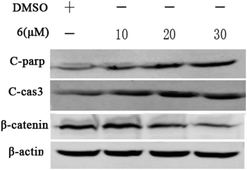 | ||
| Fig. 13 Incubating with compound 6 for 24 h, the level of protein C-parp, C-cas3, and β-catenin expression in DU145 cells was determined by western blot analysis. β-Actin was used as a control. | ||
Conclusions
In summary, six rare guaiane-type sesquiterpene dimers xylopins A–F (1–6) were isolated from the roots of X. vielana. Their structures were elucidated by extensive analyses of NMR spectroscopic data, X-ray analysis and CD spectrum. Compounds (1–6), connecting mode (C-2 to C-2′, C-4 to C-3′), (C-2 to C-5′, C-4 to C-4′), and (C-2 to C-4′, C-4 to C-3′), featuring non-spiro ring system, which enriched the structural diversity of the genus Xylopia. In the biological screening conducted, compound 6 had shown the highest cytotoxicity among the tested compounds against DU145 cells with an IC50 19.5 μM. Preliminary studies suggested compound 6 may induce apoptosis via the Wnt signaling pathway, which was due to an increase in the expression of cleaved-parp and cleaved-caspase-3 with a concomitant decrease in the expression of β-catenin. Compound 6 may be useful for the development of a Wnt signaling inhibitor to combat cancers.Experimental
General experimental procedures
HSGF254 silica gel plates (10–40 μm, Yantai, China) were major used as TLC analysis. Silica gel (100–200 mesh, Yantai, China), silica gel H (10–40 μm, Qingdao, China) and Sephadex LH-20 (Pharmacia Co. Ltd.) were utilized as column chromatography materials. The Shimadzu LC-6AD series equipped with an SPD-20 spectrophotometer using Shimadzu PRC-ODS EV0233 column was selected as the preparative HPLC. 1D and 2D NMR spectra were conducted on the Bruker Avance-500 NMR spectrometer, and chemical shifts are shown in d (ppm) with TMS as an internal reference and coupling constants were in Hz. ESIMS spectra were tested on Agilent LC/MSD Trap XCT spectrometer (Waters, USA) and HR-ESIMS on Q-TOF micro YA019 mass spectrometer (Waters, USA). Optical rotations were tested on the JASCO P-2000 polarimeter in MeOH at 20C. IR spectra were conducted on the Bruker FTIR Vector 22 spectrometer with KBr pellets.Plant material
The roots of X. vielana were collected in Fangchenggang, Guangxi province, P. R. China, in December 2016. The identification of the plant material was authenticated by identified by Associate Prof. Zhang Daigui, College of Biology and Environment Sciences, Jishou University. A voucher specimen (No. 201611MBS) has been deposited in School of Pharmacy, Shanghai Jiao Tong University.Extraction and isolation
Dried roots of X. vielana (22.3 kg) were powdered and extracted with 95% EtOH three times at room temperature and then evaporated under reduced pressure to give crude extract (764.1 g). The extract was further extracted with petroleum ether (3 L × 3), EtOAc (3 L × 3) to acquire two fractions. The PE fraction (32.4 g) was subjected to a silica gel (200–300 mesh) column chromatography, and eluted with a step gradient of PE-acetone (100![[thin space (1/6-em)]](https://www.rsc.org/images/entities/char_2009.gif) :
:![[thin space (1/6-em)]](https://www.rsc.org/images/entities/char_2009.gif) 0 to 0
0 to 0![[thin space (1/6-em)]](https://www.rsc.org/images/entities/char_2009.gif) :
:![[thin space (1/6-em)]](https://www.rsc.org/images/entities/char_2009.gif) 100 v/v) to yield ten fractions (A–J). Fraction G (4.1 g) was further isolated and eluted with PE–EtOAc (50
100 v/v) to yield ten fractions (A–J). Fraction G (4.1 g) was further isolated and eluted with PE–EtOAc (50![[thin space (1/6-em)]](https://www.rsc.org/images/entities/char_2009.gif) :
:![[thin space (1/6-em)]](https://www.rsc.org/images/entities/char_2009.gif) 1 to 10
1 to 10![[thin space (1/6-em)]](https://www.rsc.org/images/entities/char_2009.gif) :
:![[thin space (1/6-em)]](https://www.rsc.org/images/entities/char_2009.gif) 1, v/v) then got five fractions (G-1–G-5). Fraction G-1 (300.0 mg) was purified by preparative HPLC (MeOH
1, v/v) then got five fractions (G-1–G-5). Fraction G-1 (300.0 mg) was purified by preparative HPLC (MeOH![[thin space (1/6-em)]](https://www.rsc.org/images/entities/char_2009.gif) :
:![[thin space (1/6-em)]](https://www.rsc.org/images/entities/char_2009.gif) H2O, 65
H2O, 65![[thin space (1/6-em)]](https://www.rsc.org/images/entities/char_2009.gif) :
:![[thin space (1/6-em)]](https://www.rsc.org/images/entities/char_2009.gif) 35) to yield 1 (tR = 28 min, 18.2 mg) and 2 (tR = 54 min, 16.6 mg). Fraction G-3 (1.0 g) was subjected to Sephadex IL-20 eluting with (DCM
35) to yield 1 (tR = 28 min, 18.2 mg) and 2 (tR = 54 min, 16.6 mg). Fraction G-3 (1.0 g) was subjected to Sephadex IL-20 eluting with (DCM![[thin space (1/6-em)]](https://www.rsc.org/images/entities/char_2009.gif) :
:![[thin space (1/6-em)]](https://www.rsc.org/images/entities/char_2009.gif) MeOH, 30
MeOH, 30![[thin space (1/6-em)]](https://www.rsc.org/images/entities/char_2009.gif) :
:![[thin space (1/6-em)]](https://www.rsc.org/images/entities/char_2009.gif) 1), to obtain four fractions (G-3.1–3.4). Compound 4 (tR = 36 min, 18.2 mg) were acquired from fraction G-3.2 (280.0 mg) using preparative HPLC (MeOH
1), to obtain four fractions (G-3.1–3.4). Compound 4 (tR = 36 min, 18.2 mg) were acquired from fraction G-3.2 (280.0 mg) using preparative HPLC (MeOH![[thin space (1/6-em)]](https://www.rsc.org/images/entities/char_2009.gif) :
:![[thin space (1/6-em)]](https://www.rsc.org/images/entities/char_2009.gif) H2O, 70
H2O, 70![[thin space (1/6-em)]](https://www.rsc.org/images/entities/char_2009.gif) :
:![[thin space (1/6-em)]](https://www.rsc.org/images/entities/char_2009.gif) 30). Compound 5 (18.2 mg) was obtained from fraction G-3.3 (120.0 mg) by Preparative TLC (DCM
30). Compound 5 (18.2 mg) was obtained from fraction G-3.3 (120.0 mg) by Preparative TLC (DCM![[thin space (1/6-em)]](https://www.rsc.org/images/entities/char_2009.gif) :
:![[thin space (1/6-em)]](https://www.rsc.org/images/entities/char_2009.gif) MeOH, 50
MeOH, 50![[thin space (1/6-em)]](https://www.rsc.org/images/entities/char_2009.gif) :
:![[thin space (1/6-em)]](https://www.rsc.org/images/entities/char_2009.gif) 1). Fraction F (4.6 g) was chromatographed on silica gel H (400–500 mesh), eluting with PE–EtOAc (50
1). Fraction F (4.6 g) was chromatographed on silica gel H (400–500 mesh), eluting with PE–EtOAc (50![[thin space (1/6-em)]](https://www.rsc.org/images/entities/char_2009.gif) :
:![[thin space (1/6-em)]](https://www.rsc.org/images/entities/char_2009.gif) 1 to 10
1 to 10![[thin space (1/6-em)]](https://www.rsc.org/images/entities/char_2009.gif) :
:![[thin space (1/6-em)]](https://www.rsc.org/images/entities/char_2009.gif) 1), to give five subfraction (F-1–F-5). Fraction F-2 (610.9 mg) was further purified by preparative HPLC to yield 6 (15.2 mg) and 3 (8.2 mg).
1), to give five subfraction (F-1–F-5). Fraction F-2 (610.9 mg) was further purified by preparative HPLC to yield 6 (15.2 mg) and 3 (8.2 mg).
Details of new compounds
EPT2-TGC cell model
Prostate EPT2 cells were established by X. K. and K.-H. K laboratory (Shanghai University of Traditional Chinese Medicine). Lentiviral vector 7TGC together with packaging plasmids pMD2.G and pCMVR8.74 was co-transfected into 293FT cells with Lipofectamine 3000 in order to build the stable cell lines containing Wnt reporters.19 After 16 h, the culture medium was replaced with medium for cells of interest. 24 h later, the culture medium was filtered through a 0.45 μm filter and incubated with cells for 24 h. The expression of eGFP and mCherry in transduced cells was assessed by fluorescence microscopy and FACS (FACSAria; BD Biosciences). EPT2-TGC cells were seeds in 96-well plates at 8 × 10³ cell per well at 37 °C under a humidified atmosphere of 5% CO2. After 12 h, the supernatant was discarded, and the cells were treated with different compounds (10 μM) and 6BIO (GSK3β inhibitor) for 24 h.Zebrafish study
Wild type zebrafish were raised and maintained under standard conditions and treated in accordance with the guidance suggestions for the Care and Use of Laboratory Animals formulated by the Ministry of Science and Technology of China and approved by the Committee on the Ethics of Animal Experiments of East China Normal University (approval no.: F20140101). For the eyeless phenotype rescue assay, embryos at 6 hpf were cultured in 48-well plates (10 embryos per well) at 28.5 °C. The embryos were treated with the isolated compounds and 6BIO (GSK3β inhibitor) at 6 h post-fertilization, for 48 h. The egg water solution was used as blank control group, and the model control group contained 0.8 μM 6BIO. The eye development (two eyes, one eye, or no eye) was visualized using the fluorescent microscope to assess the drug sensitivity of Wnt signaling pathway.20Cell culture
Human prostate cancer cell line (DU145) was cultured in media containing 10% FBS, 100 units per mL penicillin, 100 mg mL−1 streptomycin at 37 °C in a humidified incubator in the presence of 5% CO2.Cytotoxic assay
Cytotoxic assay was measured using a Cell Counting Kit-8 (CCK-8) (Dojindo, Kumamoto, Japan) according to the manufacturer's instructions. In brief, the cells (1.0 × 10⁴ cells per well) were seeded in 96-well microplates for 24 h, added with different concentrations of compounds or 0.1% DMSO as vehicle control. After incubation 24 h, 2 μL of CCK-8 solution was added to each well for additional 1 h incubation before the absorbance was measured at 450 nm by an epoch microplate spectrophotometer.Flow cytometry analysis
DU145 cells were seeded in 6-well plates (1.0 × 10⁶ cells per well) for 24 h and then treated with compounds at dose-related concentrations or DMSO for 24 h. The treated cells were stained using Annexin V-APC/7-AAD apoptosis detection kit (MultiSciences Biotech, CA) and the cell cycle kit (MultiSciences Biotech, CA) according to the manufacturer's instructions. After incubation at room temperature for 15 min in the dark, the apoptosis and the cell cycle were immediately analyzed by flow cytometry (Becton Dickinson FACS Vantage SE, San Jose, CA, USA).21Western blot analysis
DU145 were treated with 6 for 24 h, washed twice with PBS, and lysed in lysis buffer (NP40![[thin space (1/6-em)]](https://www.rsc.org/images/entities/char_2009.gif) :
:![[thin space (1/6-em)]](https://www.rsc.org/images/entities/char_2009.gif) PMSF = 100
PMSF = 100![[thin space (1/6-em)]](https://www.rsc.org/images/entities/char_2009.gif) :
:![[thin space (1/6-em)]](https://www.rsc.org/images/entities/char_2009.gif) 1 Promega, USA) for 30 min on ice. The concentration of protein in the supernatant fractions were determined using the Pierce™ BCA Protein Assay Kit in the light of the manufacturer's instructions. Equal amounts of protein were electrophoresed using 10% SDS-polyacrylamide gel and then transferred to PVDF membranes (Bio-Rad). After blocking with 5% (w/v) non-fat milk for 1 h at RT and washing with Tris-buffered saline-Tween solution (TBST), the membranes were incubated with primary antibody for β-catenin (S33/37/T41) (rabbit, 1
1 Promega, USA) for 30 min on ice. The concentration of protein in the supernatant fractions were determined using the Pierce™ BCA Protein Assay Kit in the light of the manufacturer's instructions. Equal amounts of protein were electrophoresed using 10% SDS-polyacrylamide gel and then transferred to PVDF membranes (Bio-Rad). After blocking with 5% (w/v) non-fat milk for 1 h at RT and washing with Tris-buffered saline-Tween solution (TBST), the membranes were incubated with primary antibody for β-catenin (S33/37/T41) (rabbit, 1![[thin space (1/6-em)]](https://www.rsc.org/images/entities/char_2009.gif) :
:![[thin space (1/6-em)]](https://www.rsc.org/images/entities/char_2009.gif) 500, Cell Signaling) and or β-actin (mouse, 1
500, Cell Signaling) and or β-actin (mouse, 1![[thin space (1/6-em)]](https://www.rsc.org/images/entities/char_2009.gif) :
:![[thin space (1/6-em)]](https://www.rsc.org/images/entities/char_2009.gif) 10
10![[thin space (1/6-em)]](https://www.rsc.org/images/entities/char_2009.gif) 000, Sigma) overnight at 4 °C, followed by incubation with a anti-rabbit or a anti-mouse second antibodies for 1.5 h at RT. The membranes were washed three times with PBST and then were visualized using the Odyssey Infrared Imaging System (LI-COR, Biosciences). The cleaved parp (Lot 5625) and cleaved caspase-3 (Lot 9664) antibodies purchased from Cell Signaling Technology company.
000, Sigma) overnight at 4 °C, followed by incubation with a anti-rabbit or a anti-mouse second antibodies for 1.5 h at RT. The membranes were washed three times with PBST and then were visualized using the Odyssey Infrared Imaging System (LI-COR, Biosciences). The cleaved parp (Lot 5625) and cleaved caspase-3 (Lot 9664) antibodies purchased from Cell Signaling Technology company.
X-ray crystallography
Crystallographic data for compounds 1–3 have been deposited at the Cambridge Crystallographic Data Centre with the deposition numbers CCDC 1834120, 1840033, and 1841412 respectively.
Computational methods
Conformational searches were performed by the MOE software using the MMFF94 force field. The obtained conformers were used for geometry reoptimizations at the B3LYP/6-31G(d,p) level in the Gaussian 09 package. The ECD spectra for the optimized conformers were calculated at the CAMB3LYP/SVP level with a CPCM solvent model in acetonitrile, and the calculated ECD spectra of different conformers were simulated with a half-bandwidth of 0.3–0.4 eV. The ECD curves were extracted by SpecDis 1.6 software.22,23 The overall ECD curves of all the compounds were weighted by Boltzmann distribution after UV correction.Conflicts of interest
There are no conflicts to declare.Acknowledgements
The work was supported by Professor of Chang Jiang Scholars Program, NSFCs (81230090, 81520108030, 21472238), Shanghai Engineering Research Center for the Preparation of Bioactive Natural Products (16DZ2280200), the Scientific Foundation of Shanghai China (12401900801, 13401900103, 13401900101), the National Key Research and Development Program of China (2017YFC1700200). We are grateful to Prof. Yuanqiang Guo from Nankai University for calculated electronic circular dichroism spectra, Xisong Ke from Shanghai University of Traditional Chinese Medicine for Wnt signaling pathway screening and Zhenyu Du from School of Life Sciences, East China Normal University for zebrafish mode. We thank Prof. Lingling Li from the Instrumental Analysis Center of Shanghai Jiao Tong University for X-ray crystallographic analysis.Notes and references
- C. Kamperdick, N. M. Phuong, G. Adam and T. Van Sung, Phytochemistry, 2003, 64, 811–816 CrossRef CAS.
- I. C. Moreira, J. H. G. Lago and N. F. Roque, Alkaloid, Biochem. Syst. Ecol., 2003, 31, 535–537 CrossRef CAS.
- N. K. Nik Abdullah Zawawi, N. Ahmat, R. Ahmad, F. M. Jaafar and N. A. Ghani, Biochem. Syst. Ecol., 2012, 43, 7–9 CrossRef CAS.
- I. C. Moreira, J. H. G. Lago and N. F. Roque, Biochem. Syst. Ecol., 2005, 33, 948–951 CrossRef CAS.
- Y. Nishiyama, M. Moriyasu, M. Ichimaru, K. Iwasa, A. Kato, S. G. Mathenge, P. B. Chalo Mutiso and F. D. Juma, Phytochemistry, 2004, 65, 939–944 CrossRef CAS PubMed.
- Y. G. Guo, Y. H. Ding, G. J. Wu, S. L. Zhu, Y. F. Sun, S. K. Yan, F. Qian, H. Z. Jin and W. D. Zhang, Fitoterapia, 2018, 127, 96–100 CrossRef CAS PubMed.
- E. V. Costa, L. M. Dutra, A. Nepel and A. Barison, Biochem. Syst. Ecol., 2013, 51, 331–334 CrossRef CAS.
- Y. Nishiyama, M. Moriyasu, M. Ichimaru, K. Iwasa, A. Kato, S. G. Mathenge, P. B. Chalo Mutiso and F. D. Juma, Phytochemistry, 2006, 67, 2671–2675 CrossRef CAS PubMed.
- C. M. Hasan, T. M. Healey and P. G. Waterman, Phytochemistry, 1982, 21, 1365–1368 CrossRef CAS.
- J. A. Takahashi, M. A. D. Boaventura, J. de Carvalho Bayma and O. Alaíde B, Frutoic acid, Phytochemistry, 1995, 40, 607–609 CrossRef CAS.
- I. C. Moreira, N. F. Roque and J. H. G. Lago, Biochem. Syst. Ecol., 2006, 34, 833–837 CrossRef CAS.
- C. M. Hasan, T. M. Healey and P. G. Waterman, Phytochemistry, 1985, 24, 192–194 CrossRef CAS.
- D. Martins, L. Hamerski, S. A. V. Alvarenga and N. d. F. Roque, Phytochemistry, 1999, 51, 813–817 CrossRef CAS.
- Y. G. Xie, Y. G. Guo, G. J. Wu, S. L. Zhu, T. F. Cheng, Y. Zhang, S. K. Yan, H. Z. Jin and W. D. Zhang, Org. Biomol. Chem., 2018, 16, 8408–8412 RSC.
- Y. L. Zhang, X. W. Zhou, X. B. Wang, L. Wu, M. H. Yang, J. Luo, Y. Yin, J. G. Luo and L. Y. Kong, Org. Lett., 2017, 19, 3013–3016 CrossRef CAS PubMed.
- V. Kuete, L. P. Sandjo, A. T. Mbaveng, M. Zeino and T. Efferth, Phytomedicine, 2015, 22, 1247–1254 CrossRef CAS PubMed.
- R. P. C. Ferraz, G. M. B. Cardoso, T. B. da Silva, J. Fontes, A. Prata, A. A. Carvalho, M. O. Moraes, C. Pessoa, E. V. Costa and D. P. Bezerra, Food Chem., 2013, 141, 196–200 CrossRef CAS PubMed.
- T. Shono, N. Ishikawa, K. Toume, M. A. Arai, H. Masu, T. Koyano, T. Kowithayakorn and M. Ishibashi, J. Nat. Prod., 2016, 79, 2083–2088 CrossRef CAS PubMed.
- Y. Qu, A. M. Oyan, R. Liu, Y. Hua, J. Zhang, R. Hovland, M. Popa, X. Liu, K. A. Brokstad and R. Simon, Cancer Res., 2013, 73, 7090–7100 CrossRef CAS PubMed.
- Y. Qu, N. Gharbi, X. Yuan, J. R. Olsen, P. Blicher, B. Dalhus, K. A. Brokstad, B. Lin, A. M. Oyan, W. Zhang, K. H. Kalland and X. Ke, Proc. Natl. Acad. Sci. U. S. A., 2016, 113, 9339–9344 CrossRef CAS PubMed.
- H. Chen, B. Y. Chen, C. T. Liu, Z. Zhao, W. H. Shao, H. Yuan, K. J. Bi, J. Y. Liu, Q. Y. Sun and W. D. Zhang, Eur. J. Med. Chem., 2014, 83, 307–316 CrossRef CAS PubMed.
- J. Xu, Q. Zhang, M. Wang, Q. Ren, Y. Sun, D. Q. Jin, C. Xie, H. Chen, Y. Ohizumi and Y. Guo, J. Nat. Prod., 2014, 77, 2182–2189 CrossRef CAS PubMed.
- J. Xu, Y. Sun, M. Wang, Q. Ren, S. Li, H. Wang, X. Sun, D. Q. Jin, H. Sun, Y. Ohizumi and Y. Guo, J. Nat. Prod., 2015, 78, 1563–1569 CrossRef CAS PubMed.
Footnotes |
| † Electronic supplementary information (ESI) available. CCDC 1834120, 1840033 and 1841412. For ESI and crystallographic data in CIF or other electronic format see DOI: 10.1039/c9ra00347a |
| ‡ These authors contributed equally. |
| This journal is © The Royal Society of Chemistry 2019 |

