DOI:
10.1039/C9RA00397E
(Paper)
RSC Adv., 2019,
9, 10473-10485
Adsorption characteristics and inhibition effect of two Schiff base compounds on corrosion of mild steel in 0.5 M HCl solution: experimental, DFT studies, and Monte Carlo simulation†
Received
16th January 2019
, Accepted 17th March 2019
First published on 4th April 2019
Abstract
In this work, we report the synthesis of two Schiff bases of substituted gallic acid derivatives via amidation reaction and their characterization using 1H-NMR spectroscopy to study their inhibition performance on the aggressive attack of HCl on mild steel (MS). The inhibitive performance was examined using chemical (weight loss) and electrochemical (Tafel and EIS) test methods. The results indicate that these derivatives significantly suppress the dissolution rate of mild steel via adsorption phenomena, which correlates to the Langmuir adsorption model. Tafel data display the mixed-type properties of these compounds and EIS results show that increasing Schiff base concentration not only leads to delaying the charge transfer (Rct) of iron from 26.4 ohm cm−2 to 227.7 ohm cm−2 but also decreases the capacitance of the adsorbed double layer (Cdl) from 8.58 (F cm−2) × 10−5 to 2.55 (F cm−2) × 10−5. The inhibition efficiency percentage reaches the peak (90%) at optimum concentration of 250 ppm. The Monte Carlo simulations confirm the adsorption ability of the as-prepared compounds on the Fe (1 1 0) crystal. The SEM/EDX results revealed the presence of a protective film on the mild steel sample.
1. Introduction
The metal deterioration is an inevitable process and considered the most serious problem that has a detrimental influence on the production rate because it directly affects the industrial equipment. As a consequence of its superb mechanical properties, mild steel is widely utilized as constructional material in many industrial purposes such as petroleum industry, power plants, and cooling towers. However, it is highly susceptibility to corrosion in aggressive hostile media, especially in acidic medium.1,2 Typically, hydrochloric acid solutions are used mainly for cleaning purposes such as pickling, descaling, etching of metal, and acidizing operations.3 These reasons have compelled the researchers to do numerous scientific studies in an attempt to improve the resistance of metals. Due to their unique properties and low-cost, corrosion inhibitors have proven to be the most convenient technique for protecting metals by enhancing their capability to resist the corrosion process, compared to other methods (i.e., coatings, alloying elements, and plastic deformations).2–4 There has been a great development in the efficiency of organic compounds containing heteroatoms as corrosion inhibitors for steel in acidic media.5–8 The adsorption of these compounds on the metal surface takes place through the electron donor atoms such as N, S, P, O, and double/triple bonds or aromatic rings.9–12 The introduction of these atoms in heterocyclic compounds gives rise to high corrosion inhibiting properties by affording electrons to interact with the metal or alloy surface in acidic solutions. When both of these features (heteroatoms and π-bonds) are combined in a molecular structure, the inhibition performance can be boosted.13,14 The inhibiting effect of these organic inhibitor compounds can be accounted for due to their interactions with the metal surface via the adsorption process (i.e., physically (electrostatic attraction) or chemically (bond formation)).15–17 It has been shown that Schiff bases exhibit higher inhibition performance compared to their building units (i.e., aldehydes and amines) and this can be attributed to the presence of azomethine group (–CH![[double bond, length as m-dash]](https://www.rsc.org/images/entities/char_e001.gif) N–) in the molecules, which results from the condensation of a primary amine and a ketone/aldehyde. Recently, several Schiff base compounds have been investigated as effective acid corrosion inhibitors.18–24 The popularity of these compounds as corrosion inhibitors is attributed to ease of their synthesis from economical materials and their low toxicity.25,26 Generally, the effectiveness of a compound to reduce the rate of corrosion depends mainly on its ability to adsorb on the metal surface.27,28 The selection of efficient anti-corrosion compound is mostly dependent on the experimental information, which is based on their electron donating property. At the present time, the theoretical approaches are used to ascertain the applicability of experimental approaches by comparing the empirical and the quantum results.29 Thus, the present work reports the synthesis of two new Schiff base compounds, namely, N-(2-((Z)-2-(benzylideneamino)ethylamino)ethyl)-3,4,5-trihydroxybenzamide (Bz) and N-(2-((Z)-2-(3-methoxy-4-hydroxybenzylideneamino)ethylamino)ethyl)-3,4,5-trihydroxybenzamide (VA) (see Fig. 1) to investigate their inhibition effect as acid corrosion inhibitors for (MS) in 0.5 M HCl at 298 K, and to study the consequence of –OH and –OCH3 substitution groups on their protection abilities. Furthermore, some quantum chemical parameters (i.e., EHOMO, ELUMO, and ΔE) were calculated to check the correlation between the as-synthesized molecular structures and their inhibition efficacy.
N–) in the molecules, which results from the condensation of a primary amine and a ketone/aldehyde. Recently, several Schiff base compounds have been investigated as effective acid corrosion inhibitors.18–24 The popularity of these compounds as corrosion inhibitors is attributed to ease of their synthesis from economical materials and their low toxicity.25,26 Generally, the effectiveness of a compound to reduce the rate of corrosion depends mainly on its ability to adsorb on the metal surface.27,28 The selection of efficient anti-corrosion compound is mostly dependent on the experimental information, which is based on their electron donating property. At the present time, the theoretical approaches are used to ascertain the applicability of experimental approaches by comparing the empirical and the quantum results.29 Thus, the present work reports the synthesis of two new Schiff base compounds, namely, N-(2-((Z)-2-(benzylideneamino)ethylamino)ethyl)-3,4,5-trihydroxybenzamide (Bz) and N-(2-((Z)-2-(3-methoxy-4-hydroxybenzylideneamino)ethylamino)ethyl)-3,4,5-trihydroxybenzamide (VA) (see Fig. 1) to investigate their inhibition effect as acid corrosion inhibitors for (MS) in 0.5 M HCl at 298 K, and to study the consequence of –OH and –OCH3 substitution groups on their protection abilities. Furthermore, some quantum chemical parameters (i.e., EHOMO, ELUMO, and ΔE) were calculated to check the correlation between the as-synthesized molecular structures and their inhibition efficacy.
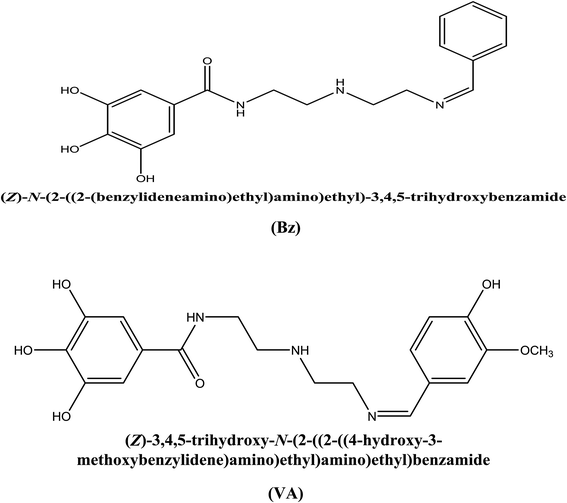 |
| | Fig. 1 Structures of the studied Schiff bases' inhibitor. | |
2. Experimental
2.1. General procedure for inhibitor preparation
The studied compounds were synthesized via substitution reaction of the ester of gallic acid (gallic acid 97.5%, Sigma-Aldrich Co.) with diamine (N1-(2-aminoethyl)ethane-1,2-diamine) (Merck, 99%) in the molar ratio of 1![[thin space (1/6-em)]](https://www.rsc.org/images/entities/char_2009.gif) :
:![[thin space (1/6-em)]](https://www.rsc.org/images/entities/char_2009.gif) 1, and then the product was reacted with substituted benzaldehyde (Alfa Aesar, 97%) in ethanol (Fisher Scientific, 99.8%) solutions in the molar ratio 1
1, and then the product was reacted with substituted benzaldehyde (Alfa Aesar, 97%) in ethanol (Fisher Scientific, 99.8%) solutions in the molar ratio 1![[thin space (1/6-em)]](https://www.rsc.org/images/entities/char_2009.gif) :
:![[thin space (1/6-em)]](https://www.rsc.org/images/entities/char_2009.gif) 1 to form the related Schiff-base, as reported elsewhere.18,19 The product was allowed to cool before crystallization in ethanol. The preparation process of (Bz) and (VA) compounds is shown in Scheme 1 and their molecular structures were characterized by 1H-NMR spectroscopy.
1 to form the related Schiff-base, as reported elsewhere.18,19 The product was allowed to cool before crystallization in ethanol. The preparation process of (Bz) and (VA) compounds is shown in Scheme 1 and their molecular structures were characterized by 1H-NMR spectroscopy.
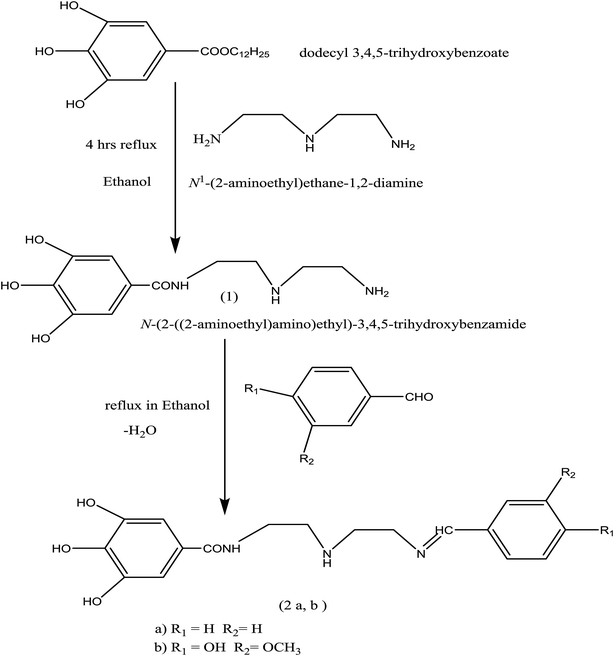 |
| | Scheme 1 Synthetic route for the preparation of (Bz) and (VA) Schiff bases. | |
2.2. Materials and solutions
The corrosion measurements were executed using cylindrical (MS) specimens with the chemical composition of (wt%) 0.019% P, 0.246% Si, 0.47% Mn, 0.167% C, 0.018% S, and the remainder Fe. (MS) samples were polished before each test with emery paper of fine grain size (grade 400 to 2000), then washed with distilled water, and finally dried at room temperature. Analytical grade HCl (37%) was diluted in distilled water to 0.5 M HCl. To ensure the solubility of (Bz) and (VA), a stock solution of 20![[thin space (1/6-em)]](https://www.rsc.org/images/entities/char_2009.gif) :
:![[thin space (1/6-em)]](https://www.rsc.org/images/entities/char_2009.gif) 80 ratio of ethanol
80 ratio of ethanol![[thin space (1/6-em)]](https://www.rsc.org/images/entities/char_2009.gif) :
:![[thin space (1/6-em)]](https://www.rsc.org/images/entities/char_2009.gif) water was prepared. Different concentrations (0–250 ppm) from the stock solution were prepared in 0.5 M HCl.
water was prepared. Different concentrations (0–250 ppm) from the stock solution were prepared in 0.5 M HCl.
2.3. Spectral data for (Bz) and (VA) compounds
1H-NMR (500 MHz, DMSO-D6) shows characteristic peaks for (VA) as a representative sample (Fig. S1†), δ (ppm): 9.730 (d, 1H, Ar–C![[H with combining low line]](https://www.rsc.org/images/entities/b_i_char_0048_0332.gif) –OH, phenolic–OH), 8.446 (s, 1H, CH
–OH, phenolic–OH), 8.446 (s, 1H, CH![[double bond, length as m-dash]](https://www.rsc.org/images/entities/char_e001.gif) N), 6.802 (s, 2H, Ar–H), 7.288–7.349 (m, 4H, benzylideneamino nucleus), 3.769–4.066 (t, 2H, Ar–CH–N–C
N), 6.802 (s, 2H, Ar–H), 7.288–7.349 (m, 4H, benzylideneamino nucleus), 3.769–4.066 (t, 2H, Ar–CH–N–C![[H with combining low line]](https://www.rsc.org/images/entities/b_i_char_0048_0332.gif) 2–C
2–C![[H with combining low line]](https://www.rsc.org/images/entities/b_i_char_0048_0332.gif) 2), 2.417–2.493 (t, 2H, CH2–C
2), 2.417–2.493 (t, 2H, CH2–C![[H with combining low line]](https://www.rsc.org/images/entities/b_i_char_0048_0332.gif) 2–NH–C
2–NH–C![[H with combining low line]](https://www.rsc.org/images/entities/b_i_char_0048_0332.gif) 2–CH2), 3.769 (s, 3H, Ar–OC
2–CH2), 3.769 (s, 3H, Ar–OC![[H with combining low line]](https://www.rsc.org/images/entities/b_i_char_0048_0332.gif) 3).
3).
2.4. Corrosion measurements
2.4.1. Weight loss measurements. The inhibition effect of the prepared (VA) and (Bz) compounds on (MS) corrosion in 0.5 M HCl solution was scrutinized in the concentration range from 25 to 250 ppm at 298 K. This method enables us to directly assess the inhibition performance. The weight loss test solutions were made in a 200 mL vessel. The abraded (MS) coupons used were cut into 5 cm × 1.5 cm × 0.1 cm dimensions and the immersion time was 6 h at 298 K. The average weight of the (MS) sheets was determined in the blank and the inhibitor solutions.
2.4.2. Electrochemical measurements. GAMRY 3000 potentiostat/galvanostat/ZRA was used to carry out the electrochemical measurements. A pyrex glass cell containing three-electrode inlets with saturated calomel electrode (SCE), graphite electrode, and (MS) electrode with exposed surface area of 0.384 cm2 used as the reference, auxiliary, and working electrodes, respectively, was used to study the electrochemical parameters of mild steel in the absence and presence of the prepared Schiff bases at 298 K at the steady state potential of the working electrode. The EIS measurements were done in the frequency domain from 100 kHz to 0.1 Hz with 10 mV signal amplitude and the EIS parameters were fitted by the Gamry Echem analyst (5.61) software. The Tafel measurements were also performed within the potential window of ±250 mV versus free corrosion potential with a scan rate 1 mV s−1.
2.5. SEM/EDX study
FEI NOVA NANOSEM 450 instrument was used to study the surface morphology of the (MS) sheet before and after treatment with optimum concentration (250 ppm) of (VA) compound for 6 h.30,31 The surface morphology (smoothness and roughness) is displayed by the SEM images and the chemical composition of the exposed layer of mild steel surface was examined by EDX.
2.6. Computational studies
BIOVIA Materials Studio (6.0) software from Accelrys, Inc. was used in the computational study. The geometry optimization process of (VA) and (Bz) was done in both gas and solution phase by DMol3 module with Perdew and Wang (LDA) exchange–correlation functional and DND-3.5 basis set. The DFT calculations were carried out using the optimized inhibitor structures without changing the settings. The calculated parameters include the electron density, dipole moment, and FMO (i.e., the highest occupied molecular orbitals (HOMOs) and the lowest unoccupied molecular orbitals (LUMOs)).
3. Results and discussion
3.1. Potentiodynamic polarization measurements
The cathodic and anodic corrosion reactions of (Bz) and (VA) at 298 K in 0.5 M HCl in inhibitor free and inhibitor solutions on the (MS) electrode have been studied by the potentiodynamic polarization method after executing the OCP test and reaching the steady state potential, as shown in Fig. S2.† The obtained polarization profiles are presented in Fig. 2a and b. Based on the observation by Ferreira et al.,32 when the shift in the corrosion potential is greater than ±85 mV vs. the corrosion potential of the uninhibited sample, the inhibitor is considered as a cathodic or anodic type, but when the shift is within ±85 mV the inhibitor is considered as a mixed type. In our study, the addition of (VA) or (Bz) in 0.5 M HCl solution significantly suppressed the Tafel branches, and the displacement in the corrosion potential was less than ±85 mV, suggesting that the prepared Schiff base compounds can be classified as mixed-type inhibitors.33 The electrochemical parameters such as corrosion potential (Ecorr), cathodic (βc) and anodic (βa) Tafel slopes, corrosion current density (icorr), polarization resistance (Rp), surfaces coverage (θ), corrosion rate (CR), and the inhibition efficiency percentage (η%) were calculated from the Tafel plots and are tabulated in Table 1 using the following equations.| |
 | (1) |
| | |
Rp = βa × βc/2.303icorr(βa + βc)
| (2) |
| | |
η% = (1 − iinh/iuninh) × 100
| (3) |
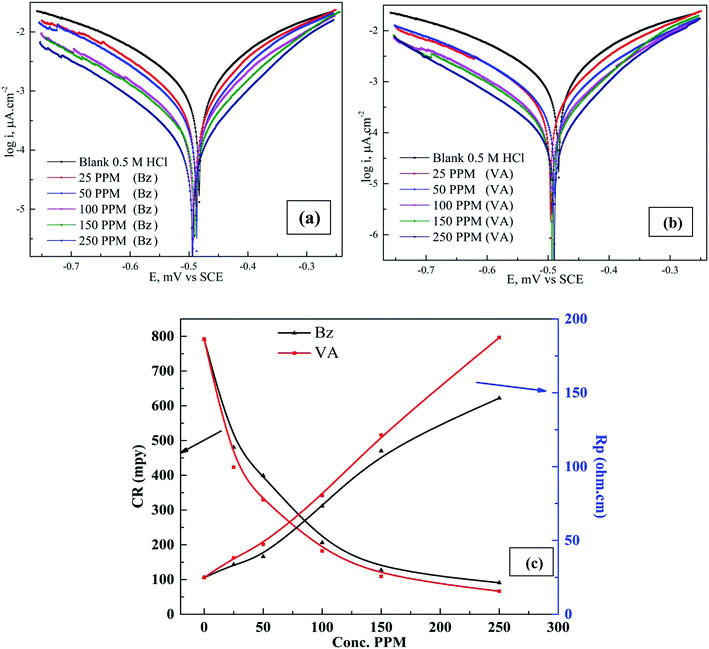 |
| | Fig. 2 Polarization curves for mild steel in 0.5 M HCl in the absence and presence of different concentrations of (Bz) (a) and (VA) (b) at 298 K. (c) Variation of the corrosion rate (CR, mpy) and polarization resistance versus inhibitor concentration (ppm). | |
Table 1 Polarization parameters of the MS at various concentrations of the BZ and VA in 0.5 M HCl and the corresponding inhibition efficiency at 298 K
| |
Conc. (ppm) |
−Ecorr (mV) |
icorr (μA cm−2) |
−βc (mV dec−1) |
βa (mV dec−1) |
Rp (ohm cm) |
CR (mpy) |
θ |
IEpot (%) |
| Blank |
0.00 |
484 |
1730 |
221.7 |
179.1 |
24.87 |
791.87 |
— |
— |
| BZ |
25 |
488 |
1050 |
178.5 |
150.2 |
33.73 |
480.62 |
0.3931 |
39.31 |
| 50 |
487 |
872 |
170.2 |
145.7 |
39.09 |
399.14 |
0.4960 |
49.60 |
| 100 |
493 |
450 |
172 |
136 |
73.28 |
205.98 |
0.7399 |
73.99 |
| 150 |
490 |
278 |
167 |
123 |
110.63 |
127.25 |
0.8393 |
83.93 |
| 250 |
494 |
198 |
152 |
119 |
146.37 |
90.63 |
0.8855 |
88.55 |
| VA |
25 |
496 |
924 |
185.7 |
145.2 |
38.29 |
422.94 |
0.4659 |
46.59 |
| 50 |
489 |
720 |
173.2 |
143.5 |
47.33 |
329.56 |
0.5838 |
58.38 |
| 100 |
494 |
398 |
158.2 |
138 |
80.41 |
182.18 |
0.7699 |
76.99 |
| 150 |
493 |
238 |
151.9 |
118.5 |
121.45 |
108.94 |
0.8624 |
86.24 |
| 250 |
490 |
145.2 |
144.7 |
110.5 |
187.37 |
66.46 |
0.9161 |
91.61 |
The values of (icorr) were calculated by the extrapolation of the linear portions of the Tafel branches to the corresponding (Ecorr). The observation of the data revealed that the corrosion current density and the rate of corrosion decline in the presence of the investigated compounds compared to the blank solution, indicating that these inhibitors are adsorbed on the (MS) surface and retarded its dissolution process in the acidic media (Fig. 2c). Also, these compounds reduce the anodic reaction of mild steel (Fe → Fe2+ + 2e−) and retard the H+ reduction on the cathodic sites (2H+ + 2e− → H2) compared to the inhibitor free sample. Furthermore, the similar shape of the Tafel curves imply that the inhibition mechanism in the presence of the tested inhibitors is activation-controlled.34 The (icorr) values are quite less in the presence of the inhibitors (189 μA cm−2 for Bz and 145.2 μA cm−2 for Bz) compared to that for the blank sample (1730 μA cm−2) and the maximum inhibition (88.5% and 91.61%) at the concentration of 250 ppm for Bz and VA, respectively, which suggest that these compounds mitigate the acid corrosion of (MS) and protect it. The higher inhibition efficiency for (VA) compared to (Bz) compound may be attributed to the presence of one more substituted group (–OH and –OCH3) of high electron donation ability in the structure of the (VA) molecule that favors the adsorption (see Fig. 1). According to Omanović et al.,35 the size of the adsorbed molecules potentially affects the inhibition efficiency. Thus, a molecule with larger size has better adsorption properties.
3.2. Electrochemical impedance study (EIS)
EIS measurements are used to confirm the aforesaid electrochemical behavior and to study the characteristic capacitive properties at the (MS)/solution interface. Fig. 3a and b represents the Nyquist and Bode plots of the (MS) sample in 0.5 M HCl in the absence and presence of different concentrations of (Bz) and (VA), after executing OCP test and reaching the steady state potential as shown in Fig. S2.† The recorded Nyquist plots gave the similar appearance, suggesting that the addition of (Bz) or (VA) into the corrosive medium inhibited the (MS) corrosion without affecting the mechanism.36 The Nyquist plots are characterized by only single semicircles at low frequency, indicating that the corrosion process is under charge transfer control.37 The higher values of (n) (Table 2) for the inhibitor sample compared to the blank one indicate that the inhibitor increases the surface homogeneity by adsorption. The corresponding Bode (log![[thin space (1/6-em)]](https://www.rsc.org/images/entities/char_2009.gif) Z vs. log
Z vs. log![[thin space (1/6-em)]](https://www.rsc.org/images/entities/char_2009.gif) F) and phase angle plots obtained for the (MS) electrode immersed in 0.5 M HCl with and without different concentrations of the inhibitors are displayed in Fig. 3c and d. As seen from these figures, at the low frequency region, an increase in the absolute impedance |Z| could be observed. This increase confirms the higher inhibition performance obtained at high concentration, which is related to the adsorption of these compounds on the (MS) surface and blocking its active sites. Also, the shift of the phase angle values to the negative direction further indicates that these compounds act mainly by forming a protective film over the (MS) surface.38 The capacity of the double layer (Cdl) and the inhibition efficiency (η%) are determined from the following equation:39
F) and phase angle plots obtained for the (MS) electrode immersed in 0.5 M HCl with and without different concentrations of the inhibitors are displayed in Fig. 3c and d. As seen from these figures, at the low frequency region, an increase in the absolute impedance |Z| could be observed. This increase confirms the higher inhibition performance obtained at high concentration, which is related to the adsorption of these compounds on the (MS) surface and blocking its active sites. Also, the shift of the phase angle values to the negative direction further indicates that these compounds act mainly by forming a protective film over the (MS) surface.38 The capacity of the double layer (Cdl) and the inhibition efficiency (η%) are determined from the following equation:39| | |
f(−Z‖max) = 1/(2πCdlRct)
| (4) |
| | |
η% = (Rct(inh) − Rct)/Rct(inh) × 100
| (5) |
where Rct(inh) and Rct are the charge transfer resistance values in the presence and absence of the inhibitor, respectively. The comparison of the experimental EIS data recorded for (BZ) and (VA) in the presence of 250 ppm reference to the blank is shown in Fig. 4a and b. The good fitted data was obtained using the equivalent circuit given inset, where Rs is the solution resistance, Rct is the charge transfer resistance, and Cdl is the double layer capacitance, and are recorded in Table 2. The EIS parameters calculated using this circuit reveal that the value of the charge transfer resistance (Rct) increases with the addition of the inhibitors compared to that of the blank solution, whereas (Cdl) values show the opposite trend. This phenomena may be either due to the desorption of water molecules from the surface of mild steel or the adsorption of the inhibitor on the metal surface.40,41 The corrosion inhibition efficiency of the investigated inhibitors follows the sequence: (VA) > (BZ) with the values of 85.42% and 88.52% at the optimum concentration. This observed behavior using EIS matches with that of the polarization data. The greater inhibition efficiency of (VA) is linked to the electron donating effect of the methoxy (–OCH3) and hydroxyl (–OH) groups attached to aromatic ring (cf. Fig. 1), which increase the electron density on the benzene ring that in turn inhibits the corrosion rate.
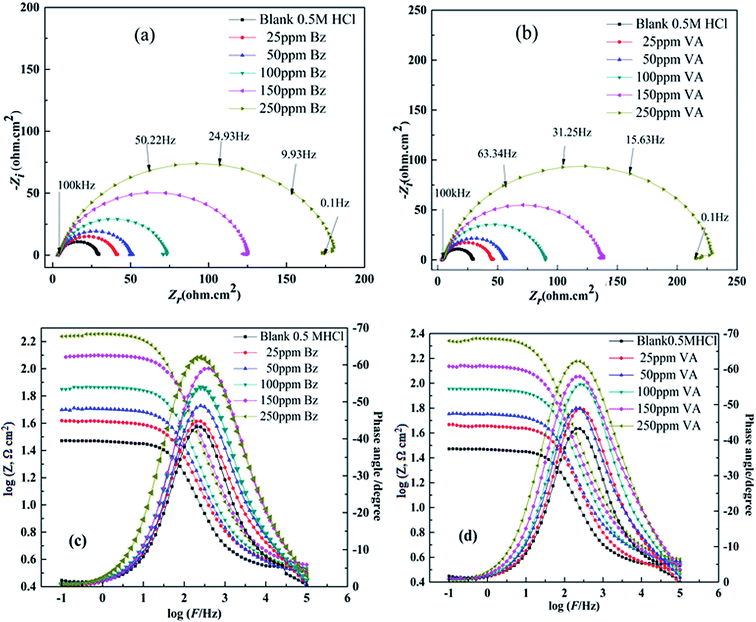 |
| | Fig. 3 Nyquist and Bode diagrams for mild steel in 0.5 M HCl in the absence and presence of various concentrations of (Bz) (a and c) and (VA) (b and d) at 298 K. | |
Table 2 EIS parameters for the corrosion of mild steel in 0.5 M HCl at various concentrations of the Bz and VA at 298 K
| Inh. |
Conc. (ppm) |
Rs (ohm cm2) |
Rct (ohm cm−2) |
CPE |
Cdl (F cm−2) × 10−5 |
θ |
IEimp (%) |
| Y0sn (Ω−1 cm−2) |
n |
| Blank |
0.00 |
3.50 |
26.14 |
219.7 × 10⁻⁶ |
0.846 |
8.58 |
— |
— |
| Bz |
25 |
3.548 |
38.37 |
221.4 × 10⁻⁶ |
0.827 |
8.16 |
0.3189 |
31.89 |
| 50 |
3.468 |
48.13 |
136.1 × 10⁻⁶ |
0.838 |
5.14 |
0.4568 |
45.68 |
| 100 |
3.727 |
70.53 |
86.59 × 10⁻⁶ |
0.868 |
3.987 |
0.6292 |
62.92 |
| 150 |
3.85 |
123 |
61.02 × 10⁻⁶ |
0.866 |
2.86 |
0.7874 |
78.74 |
| 250 |
3.62 |
179.3 |
52.19 × 10⁻⁶ |
0.879 |
2.74 |
0.8542 |
85.42 |
| VA |
25 |
3.34 |
42.44 |
140.7 × 10⁻⁶ |
0.845 |
5.49 |
0.384 |
38.4 |
| 50 |
3.85 |
52.5 |
87.1 × 10⁻⁶ |
0.859 |
3.59 |
0.502 |
50.2 |
| 100 |
3.88 |
87.17 |
69.74 × 10⁻⁶ |
0.850 |
2.83 |
0.7022 |
70.22 |
| 150 |
4.049 |
135.8 |
60.07 × 10⁻⁶ |
0.855 |
2.65 |
0.8075 |
80.75 |
| 250 |
4.161 |
227.7 |
51.14 × 10⁻⁶ |
0.865 |
2.55 |
0.8852 |
88.52 |
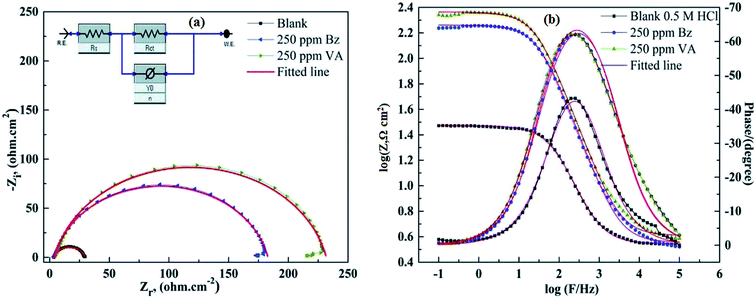 |
| | Fig. 4 (a and b) Fitted Nyquist and Bode EIS plots; (dotted) and their fittings (solid lines) for MS in 0.5 M HCl in the absence and presence of optimum concentration of (Bz) and (VA) at 298 K. The electrochemical equivalent circuit used to fit the impedance spectra (inset). | |
3.3. Weight loss measurements
As a conventional evaluation technique, the weight loss method is usually used to evaluate the inhibition performance of an investigated inhibitor. The corrosion rate (Cr) and the inhibition efficiency (IE%) values were calculated by using the equations:| |
 | (6) |
| |
 | (7) |
where (S) is the surface area of the (MS) specimen (cm2), (d) is the iron density (7.85 g cm−3), (t) is the dipping time (h), and (Cr)a and (Cr)p are the corrosion rates of the steel specimens in 0.5 M HCl solution in the absence and presence of the investigated inhibitors, respectively. The measured values are listed in Table 3 and also represented in Fig. S3† with the relevant standard deviation error bars. It can be noted that the inhibition property increases upon increasing the concentration of these compounds and maximum inhibition is 87% at 250 ppm for (VA). This is attributed to the adsorption of more inhibitor molecules on the (MS) surface, which help to block the active sites exposed to the corrosion attack.42,43 It is worth mentioning that further increase in the inhibitor concentration shows minor change in the percentage of inhibition, which is due to the fact that at 250 ppm a saturated film was formed above the (MS) surface.
Table 3 Gravimetric results of mild steel in 0.5 M HCl at different concentrations of Bz and VA at 6 h immersion and 298 K
| |
Conc. (ppm) |
Cr (mpy) |
Sd. dev |
IEWL (%) |
| Blank (0.5M HCl) |
00 |
1880.543 |
±14.538 |
— |
| Bz |
25 |
1282.5 |
±7.104 |
31.8 |
| 50 |
970.224 |
±13.024 |
48.41 |
| 100 |
586.128 |
±10.483 |
68.83 |
| 150 |
458.624 |
±8.197 |
75.61 |
| 250 |
289.5 |
±7.353 |
84.61 |
| VA |
25 |
1124.2 |
±12.19 |
40.22 |
| 50 |
829.271 |
±10.413 |
55.9 |
| 100 |
471.016 |
±10.56 |
74.95 |
| 150 |
355.318 |
±6.242 |
81.11 |
| 250 |
241.381 |
±5.367 |
87.16 |
3.4. Adsorption isotherm
Adsorption isotherm is an effective way to discuss the adsorption mechanism of the (MS)/inhibitors interaction and is described by two main types, namely, physical and chemical adsorption. This depends on the charge of the metal, the chemical structure of the investigated compound, and the aggressiveness of the electrolyte.
The Langmuir model shows the most suitable isotherm to fit and describe the adsorption behavior of the studied inhibitors compared to other adsorption models (Frumkin, Freundlich, and Temkin) and consequently, it is considered to best describe the adsorption of (Bz) and (VA) on the mild steel surface (see Fig. 5). The Langmuir model is given by eqn (8).44,45
| |
 | (8) |
where
Cinh and
Kads are the concentration of the investigated inhibitors and the equilibrium constant for the adsorption–desorption processes occurring on the metal surface, respectively, and (
θ) is the (MS) surface coverage calculated from the electrochemical techniques. The plot of
C vs. C/
θ shows a straight fitting line with the slope and correlation coefficient values close to 1 (
Fig. 5). Also, the fitted data of both (potentiodynamic polarization, EIS, and weight loss) the measurements are correlated. (
Kads) represents the adsorption/desorption values and is calculated from the standard free energy of adsorption (Δ
Goads) by
eqn (9):
44,46,47| |
ΔGoads = −RT![[thin space (1/6-em)]](https://www.rsc.org/images/entities/char_2009.gif) ln(Kads × Csolvent) ln(Kads × Csolvent)
| (9) |
where
Csolvent is the molar concentration of water in the solution expressed in ppm (10
6 ppm),
T is the absolute temperature, and
R is the universal gas constant. The thermodynamic parameters for the adsorption process of the tested inhibitors are given in Table S1.
† The negative values of the standard free energy of adsorption indicate that the (
Bz) and (
VA) molecules adsorb spontaneously on the surface of (MS). Also, the higher
Kads values indicate strong adsorption property and thus, better inhibition property.
48 The order of
Kads values is (
VA) > (
Bz). Generally, the absolute values of Δ
Goads around (−20 kJ mol
−1) or less negative values indicate electrostatic interaction (
i.e., physisorption). However, those around −40 kJ mol
−1 or more negative values indicate charge sharing and bond formation (chemisorption).
49 Though there is little difference between the Δ
Goads values, it is still in between −20 and −40 kJ mol
−1 (−24.99 kJ mol
−1). This reveals that both (
Bz) and (
VA) are adsorbed on the (MS) surface both by chemical and physical processes with a remarkable power of physical adsorption.
50,51
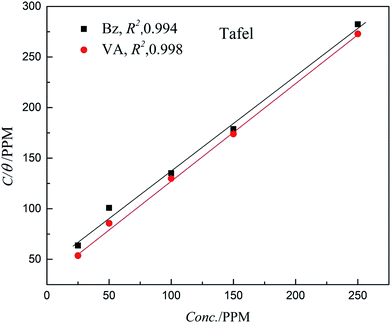 |
| | Fig. 5 Langmuir adsorption isotherm plots for (Bz) and (VA) adsorption on the MS surface. | |
3.5. SEM-EDX investigations
The morphological changes that occurred on the (MS) surface were studied in different cases (i.e., polished surface, treated with and without (blank) inhibitor) and are shown in Fig. 6A–C. The results revealed a smooth mild steel surface in Fig. 6A, which is free from the pits, characteristic of the polished surface. On the other hand, the (MS) surface appeared to be corroded and full of pits and cavities after immersion in 0.5 M HCl without being treated with (VA) compound for 6 h (Fig. 6B), which indicated the extreme aggression of corrosion agents such as H+ and Cl−.52 However, in the presence of 250 ppm of (VA) (Fig. 6C), a large surface area of the metal appears to be free from the corrosion product compared to the blank sample, and shows a smooth protective layer. This indicates the inhibition action of the tested inhibitor. Simultaneously, the EDX spectrum shows the chemical structure of the exposed metal surface and for the polished sheet (Fig. 7A) which shows the good surface properties compared to the blank sample (inhibitor free), in which the oxygen signal appears due to the exposure to 0.5 M HCl acid (Fig. 7B). However, by adding 250 ppm of (VA) to the medium, the Fe peak is considerably suppressed with respect to the blank sample (Fig. 7C) in addition to the appearance of the N peak that confirm the formation of the protective inhibitor. These surface analysis observations are in agreement with the previous literature reports.53–55
 |
| | Fig. 6 SEM for the mild steel surface: (A) polished sample, (B) sample immersed in 0.5 M HCl without inhibitor, (C) sample immersed in 0.5 M HCl with 250 ppm of VA inhibitor. | |
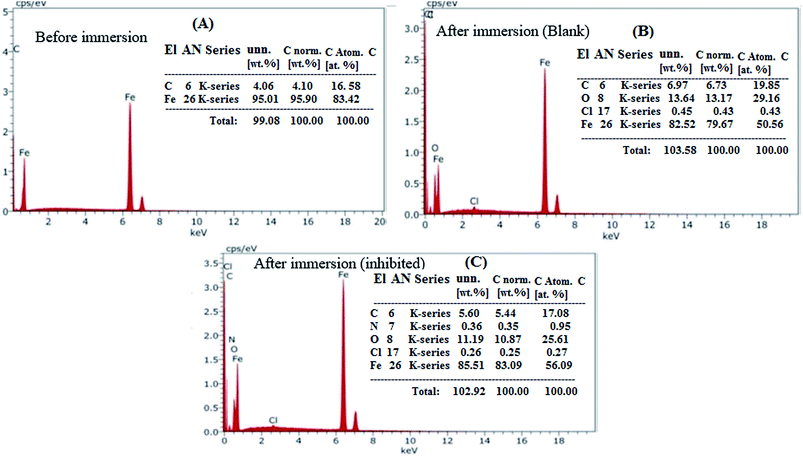 |
| | Fig. 7 EDX for the mild steel surface: (A) polished sample, (B) sample immersed in 0.5 M HCl acid solution without inhibitor, (C) sample immersed in 0.5 M HCl acid solution with 250 ppm of VA inhibitor. | |
3.6. Inhibition mechanism
The Schiff bases are effective corrosion inhibitors for different metals and alloys in acidic environments. The inhibition mechanism of the corrosion inhibitors strongly depends on the adsorption mechanism, which is governed by several factors including the chemical structure of the inhibitors. The essential aspect of the Schiff Bases as corrosion inhibitors is the existence of the C![[double bond, length as m-dash]](https://www.rsc.org/images/entities/char_e001.gif) N group, pi electrons in the aromatic rings, and various functional groups that interact with the metal surface. It was confirmed that the presence of various functional groups including –OCH3, –OH, phenyl, benzene, and NH in different orientations are responsible for efficient adsorption. In the investigated Schiff Bases in the present study, VA has two electron donation groups (–OCH3, –OH) that increase its ability to adsorb on the mild steel surface. The inhibition efficiency of the prepared Schiff bases of different substituted groups can be explained with the help of Hammett substituent constant (σ) values of the substituents attached to the aromatic ring of the aldehyde moiety (vanillin and benzaldehyde). VA contains meta-OCH3 (methoxy) group that has σ value (in positive, i.e., +0.12) and para-OH (hydroxyl) substituent that has σ value (in negative, i.e., −0.37), and the net σ value is −0.25, which is an indicative that the substituted groups increase the electron donation ability of VA compared to non-substituted inhibitor molecule Bz that has zero value of Hammett substituent constant, i.e., +0.00.56–58 Therefore, the inhibition efficiency of VA is greater than BZ. Fig. 8 displays the schematic representation of adsorption of the VA molecules over the mild steel surface via electrostatic attraction between the protonated VA and negatively charged sites of the MS surface and the electron pair transfer between VA and the vacant 3d orbital of Fe.
N group, pi electrons in the aromatic rings, and various functional groups that interact with the metal surface. It was confirmed that the presence of various functional groups including –OCH3, –OH, phenyl, benzene, and NH in different orientations are responsible for efficient adsorption. In the investigated Schiff Bases in the present study, VA has two electron donation groups (–OCH3, –OH) that increase its ability to adsorb on the mild steel surface. The inhibition efficiency of the prepared Schiff bases of different substituted groups can be explained with the help of Hammett substituent constant (σ) values of the substituents attached to the aromatic ring of the aldehyde moiety (vanillin and benzaldehyde). VA contains meta-OCH3 (methoxy) group that has σ value (in positive, i.e., +0.12) and para-OH (hydroxyl) substituent that has σ value (in negative, i.e., −0.37), and the net σ value is −0.25, which is an indicative that the substituted groups increase the electron donation ability of VA compared to non-substituted inhibitor molecule Bz that has zero value of Hammett substituent constant, i.e., +0.00.56–58 Therefore, the inhibition efficiency of VA is greater than BZ. Fig. 8 displays the schematic representation of adsorption of the VA molecules over the mild steel surface via electrostatic attraction between the protonated VA and negatively charged sites of the MS surface and the electron pair transfer between VA and the vacant 3d orbital of Fe.
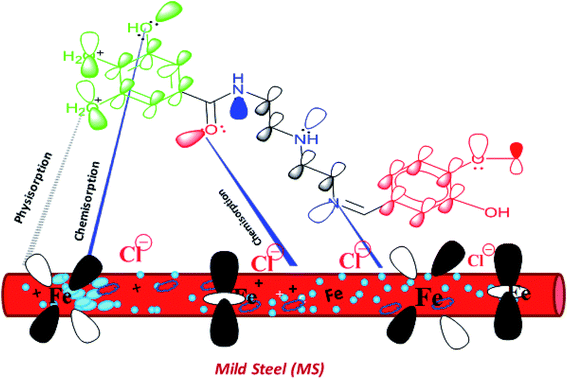 |
| | Fig. 8 Suggested model of adsorption of the VA inhibitor on mild steel in 0.5 M HCl. | |
3.7. Computational indices
The most stable forms of the synthesized (VA) and (Bz) compounds are seen in Fig. 9, where the electron density is saturated all over of their molecules. In organic chemistry, the stability of the inhibitor molecule is mainly dependent on the energy of its filled orbitals (EHOMO) and empty orbitals (ELUMO), where (HOMOs) designate the regions of the highest electron density that are more prone to donate electrons and bond to the metal surface unlike the (LUMOs) sites that can host electrons from the d-orbitals of the mild steel (see Fig. 9).59,60 The stability of the inhibitor molecule was calculated by eqn (10). Also, the ionization potential (I) and electron affinity (A) are related to the absolute electronegativity (χ) and the absolute chemical hardness (η) by the following eqn (11)–(14):61| |
 | (13) |
| |
 | (14) |
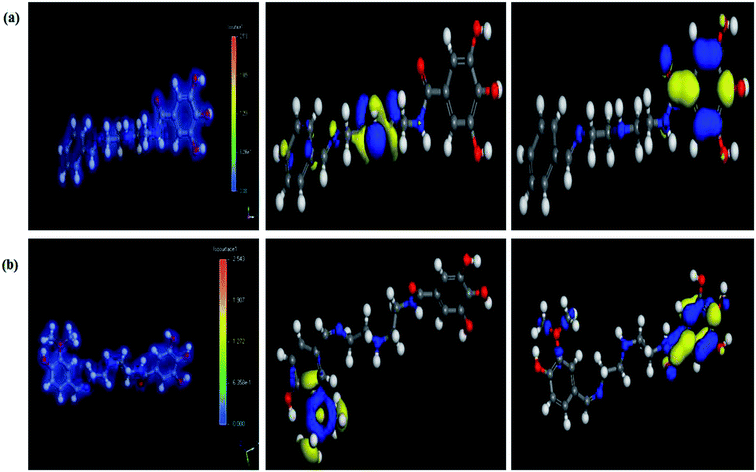 |
| | Fig. 9 The total electron distribution (left), HOMO (middle), and LUMO (right) for the synthesized compounds. (a) (Bz), (b) (VA). | |
The quantum indices such as the magnitudes of A and I were found to have an essential role in assessing the performance of the synthesized Schiff bases, where the lower (I) values indicate the higher ability of the inhibitor molecule to offer electrons to mild steel surface. Similarly, the high values of (A) encourage the inhibitor to host the accepted electrons from the substrate surface. The calculated quantum chemical parameters obtained for the most stable form of the synthesized compounds are listed in Table 4. Basically, the low energy values (ΔE) mean good inhibition property because the energy required to remove the electron from the filled HOMO inhibitor orbital will be decreased to an extent where it will be easy for the 3d orbitals of iron to accept the electron from the inhibitor molecule; also, the anti-bonding inhibitor orbital (ELUMO) will be minimized so that it can accept electrons from the filled Fe 4s or 3d orbitals. The larger the energy gap, the harder the molecule will be, while the smaller the (ΔE) value, the more likely is the molecule to be soft. Hard molecules are generally less active compared to soft ones.60 Table 4 shows that the synthesized (VA) and (Bz) have ΔE values increasing in the order: (Bz) (3.164, 3.167 eV) ˃ (VA) (2.978, 2.984 eV), which refers to the high complex stability of the [Fe–(VA)] and thus, a high corrosion inhibition performance.62 Thus, from the above quantum indices, it is predicted that the compound (VA) has the ability to provide more protection to mild steel surface than (Bz). The fraction of the electron transfer (ΔN) in between the metal surface and organic compounds is calculated from eqn (12):
| |
 | (15) |
where the global hardness, the electronegativity of iron and the prepared molecules are
ηFe,
χFe and
ηinh,
χinh, respectively.
χFe = 7 eV mol
−1 and
ηFe = 0 eV mol
−1 were used.
63 In this study, the electrons are transferred from the inhibitors (
i.e.,
VA,
Bz) to the (MS) surface because Δ
N > 0 (Δ
N ≈ 0.58), whereas the opposite would happen if Δ
N < 0. Compound (
VA) has higher Δ
N value than (
Bz). In consequence, the (
VA) inhibitor has the highest possibility to donate the electron to the mild steel surface and hence, has the highest corrosion protection capability.
64 The dipole moment (
μ) is another index used to measure the probability of bond formation. The use of (
μ) values to correlate the experimental results for the inhibition performance often disputed. One of the contending opinion is that higher the dipole moment values, lower is the inhibition efficiency, which means that the lower value of (
μ) will help the inhibitor molecules to accumulate on the mild steel surface, while the other view suggests that the increase in the dipole–dipole interactions between the inhibitor and substrate surface will enhance the inhibition performance.
65 The calculated (
μ) values in this study are in agreement with the second opinion, where (
VA) is better than (
Bz). The discussed quantum parameters are in agreement with the theoretical approach.
Table 4 Quantum chemical parameters of the investigated compounds
| Compound |
EHOMO (eV) |
ELUMO (eV) |
ΔE (eV) |
A (eV) |
χ (eV) |
I (eV) |
η (eV) |
ΔN |
μ (debye) |
| Gas phase |
| (Bz) |
−4.774 |
−1.609 |
3.164 |
1.609 |
3.191 |
4.774 |
1.582 |
1.2032 |
6.693 |
| (VA) |
−4.692 |
−1.719 |
2.978 |
1.719 |
3.206 |
4.692 |
1.486 |
1.2762 |
4.556 |
![[thin space (1/6-em)]](https://www.rsc.org/images/entities/char_2009.gif) |
| Solution phase |
| (Bz) |
−4.943 |
−1.775 |
3.167 |
1.775 |
3.359 |
4.943 |
1.583 |
1.1494 |
10.595 |
| (VA) |
−4.900 |
−1.916 |
2.984 |
1.916 |
3.408 |
4.900 |
1.492 |
1.2036 |
5.165 |
3.8. Monte Carlo simulation
The molecular simulation using the Monte Carlo (MC) method is a very helpful tool in the prediction of the interaction and adsorption phenomena of the inhibitor molecules with the substrate surface.66 Herein, the most stable configuration of (VA) and (Bz) molecules were mounted on Fe (110) surface, where the cleavage plane (h, k, l) (i.e., 110) is the most stable for the iron crystal.67 The MC study was performed by the adsorption locator modules using the simulated annealing run for 3 consecutive cycles with 10![[thin space (1/6-em)]](https://www.rsc.org/images/entities/char_2009.gif) 000 steps for each. The force field was set to COMPASS with ultrafine quality of the energy calculation. Fig. 10 shows the modes of adsorption of (VA) and (Bz) in both the side and top views on the Fe (110) crystal. The output data from the simulation method is mainly in terms of energy indices including:
000 steps for each. The force field was set to COMPASS with ultrafine quality of the energy calculation. Fig. 10 shows the modes of adsorption of (VA) and (Bz) in both the side and top views on the Fe (110) crystal. The output data from the simulation method is mainly in terms of energy indices including:
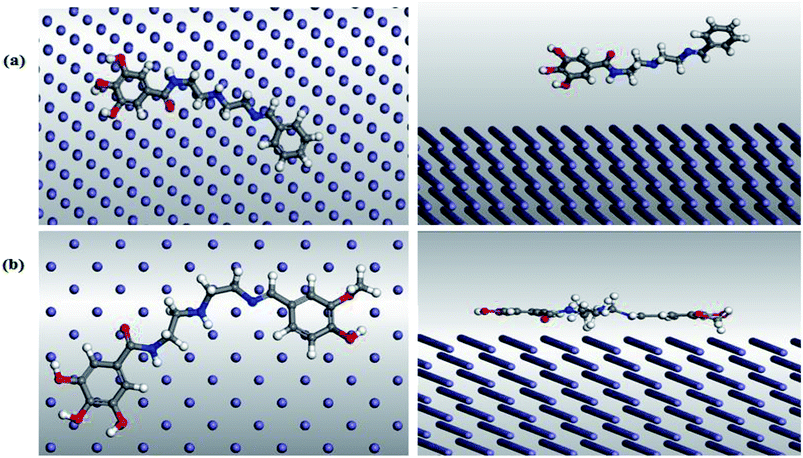 |
| | Fig. 10 Top (left) and side (right) views of the adsorption mode of (a) (Bz) and (b) (VA) on mild steel (1 1 0) surface. | |
• The total energy (Etot), which equals the summation of the internal and the adsorption energy of the adsorbate.
• The adsorption energy (Eads) refers to the energy released when the inhibitor molecule (adsorbate) is relaxed on the mild steel surface (substrate) and the equal rigid adsorption energy plus the deformation energy.
• The rigid adsorption energy (Erigid) is the released (or required) energy when the unrelaxed adsorbate components are adsorbed on the substrate.
• The deformation energy (Edef) indicates the energy released when the adsorbed inhibitor components are relaxed on the mild steel surface.
Table 5 illustrates that the adsorption energy of (VA) compound is higher than (Bz) compound, which indicates a more stabilized and stronger interaction between the mild steel surface and the (VA) molecule and thus, better inhibition efficiency. Furthermore, Erigid proceeds in the following order: (VA) > (Bz), revealing that the adsorption tendency before optimization proceeds in the same order, which coincides with the experimental results.
Table 5 The output energies calculated by Monte Carlo simulation for (Bz) and (VA) on Fe (110)
| Compound |
Total energy (kJ mol−1) |
Adsorption energy (kJ mol−1) |
Rigid adsorption energy (kJ mol−1) |
Deformation energy (kJ mol−1) |
(dEads/dNi) (kJ mol−1) |
| (Bz) |
−194.93 |
−505.07 |
−188.03 |
−317.04 |
−505.07 |
| (VA) |
−207.23 |
−597.11 |
−213.33 |
−383.77 |
−597.11 |
4. Conclusions
• The synthesized Schiff bases compounds act as efficient acid corrosion inhibitors and their inhibition efficiencies are in a concentration dependent manner.
• Polarization measurements show that (Bz) and (VA) compounds act as mixed-type inhibitors.
• The experimental and theoretical data support that the inhibition efficiency of VA is better than Bz.
• The adsorption of the Schiff base compounds on the MS occurs by chemical and physical interactions with the predominance of physical adsorption and correlate to Langmuir adsorption model.
• The surface morphology studied by SEM supports that a film of the VA was formed on the MS sheet.
Conflicts of interest
There are no conflicts of interest to declare
Acknowledgements
The authors gratefully thank the Egyptian Petroleum Research Institute for its support.
References
- A. Singh, I. Ahamad, V. Singh and M. A. Quraishi, J. Solid State Electrochem., 2011, 15, 1087–1097 CrossRef CAS.
- E. Gutierrez, J. A. Rodríguez, J. Cruz-Borbolla, J. G. Alvarado-Rodríguez and P. Thangarasu, Corros. Sci., 2016, 108, 23–35 CrossRef CAS.
- G. Schmitt, Br. Corros. J., 1984, 19, 165–176 CrossRef CAS.
- U. Leon-Silva, M. Nicho, J. González-Rodríguez, J. Chacón-Nava and V. Salinas-Bravo, J. Solid State Electrochem., 2010, 14, 1089–1100 CrossRef CAS.
- V. N. Banu, S. Rajendran and S. S. Kumaran, J. Alloys Compd., 2016, 675, 139–148 CrossRef.
- M. Bouklah, B. Hammouti, A. Aouniti and T. Benhadda, Prog. Org. Coat., 2004, 49, 225–228 CrossRef CAS.
- A. Popova, M. Christov, S. Raicheva and E. Sokolova, Corros. Sci., 2004, 46, 1333–1350 CrossRef CAS.
- L. M. Vračar and D. Dražić, Corros. Sci., 2002, 44, 1669–1680 CrossRef.
- A. Al-Sabagh, N. El Basiony, S. Sadeek and M. Migahed, Desalination, 2018, 437, 45–58 CrossRef CAS.
- M. Behpour, S. Ghoreishi, N. Mohammadi, N. Soltani and M. Salavati-Niasari, Corros. Sci., 2010, 52, 4046–4057 CrossRef CAS.
- A. Patru Samide and I. Bibicu, Surf. Interface Anal., 2008, 40, 944–952 CrossRef.
- R. Solmaz, Corros. Sci., 2010, 52, 3321–3330 CrossRef CAS.
- H. El Sayed, S. Elsaeed, H. Ashour, E. Zaki and H. El Nagy, J. Mol. Struct., 2018, 1168, 106–114 CrossRef.
- M. C. Li, L. L. Jiang, W. Q. Zhang, Y. H. Qian, S. Z. Luo and J. N. Shen, J. Solid State Electrochem., 2007, 11, 1319–1325 CrossRef CAS.
- A. A. Abd-Elaal, N. Elbasiony, S. M. Shaban and E. Zaki, J. Mol. Liq., 2018, 249, 304–317 CrossRef CAS.
- M. Behpour, S. Ghoreishi, N. Soltani and M. Salavati-Niasari, Corros. Sci., 2009, 51, 1073–1082 CrossRef CAS.
- R. Prabhu, T. Venkatesha, A. Shanbhag, G. Kulkarni and R. Kalkhambkar, Corros. Sci., 2008, 50, 3356–3362 CrossRef CAS.
- M. Gopiraman, N. Selvakumaran, D. Kesavan and R. Karvembu, Prog. Org. Coat., 2012, 73, 104–111 CrossRef CAS.
- H. M. A. El-Lateef, A. M. Abu-Dief and M. A. Mohamed, J. Mol. Struct., 2017, 1130, 522–542 CrossRef.
- H. M. A. El-Lateef, A. M. Abu-Dief and B. E.-D. M. El-Gendy, J. Electroanal. Chem., 2015, 758, 135–147 CrossRef.
- H. M. A. El-Lateef, A. M. Abu-Dief, L. H. Abdel-Rahman, E. C. Sañudo and N. Aliaga-Alcalde, J. Electroanal. Chem., 2015, 743, 120–133 CrossRef.
- M. Lashgari, M.-R. Arshadi and S. Miandari, Electrochim. Acta, 2010, 55, 6058–6063 CrossRef CAS.
- M. Migahed, M. EL-Rabiei, H. Nady and E. Zaki, J. Mol. Struct., 2018, 1159, 10–22 CrossRef CAS.
- A. O. Yüce and G. Kardaş, Corros. Sci., 2012, 58, 86–94 CrossRef.
- S. Elsaeed, H. El Sayed, H. Ashour, E. Zaki, E. Khamis and H. El Nagy, RSC Adv., 2018, 8, 37891–37904 RSC.
- S. Issaadi, T. Douadi, A. Zouaoui, S. Chafaa, M. Khan and G. Bouet, Corros. Sci., 2011, 53, 1484–1488 CrossRef CAS.
- H. Ashassi-Sorkhabi, B. Shabani, B. Aligholipour and D. Seifzadeh, Appl. Surf. Sci., 2006, 252, 4039–4047 CrossRef CAS.
- S. Şafak, B. Duran, A. Yurt and G. Türkoğlu, Corros. Sci., 2012, 54, 251–259 CrossRef.
- M. Migahed, M. EL-Rabiei, H. Nady, A. Elgendy, E. Zaki, M. Abdou and E. Noamy, Journal of Bio-and Tribo-Corrosion, 2017, 3, 31 CrossRef.
- X. Wang, H. Yang and F. Wang, Corros. Sci., 2010, 52, 1268–1276 CrossRef CAS.
- F. El-Hajjaji, M. Messali, M. M. de Yuso, E. Rodríguez-Castellón, S. Almutairi, T. J. Bandosz and M. Algarra, J. Colloid Interface Sci., 2019, 541, 418–424 CrossRef CAS PubMed.
- E. Ferreira, C. Giacomelli, F. Giacomelli and A. Spinelli, Mater. Chem. Phys., 2004, 83, 129–134 CrossRef CAS.
- M. Migahed, A. Al-Sabagh, E. Khamis and E. Zaki, J. Mol. Liq., 2015, 212, 360–371 CrossRef CAS.
- J. Aljourani, K. Raeissi and M. Golozar, Corros. Sci., 2009, 51, 1836–1843 CrossRef CAS.
- S. Omanović and M. Metikoš-Huković, Solid State Ionics, 1995, 78, 69–78 CrossRef.
- Q. Zhang and Y. Hua, Electrochim. Acta, 2009, 54, 1881–1887 CrossRef CAS.
- A. Singh, V. K. Singh and M. Quraishi, Arabian J. Sci. Eng., 2013, 38, 85–97 CrossRef CAS.
- P. Sakunthala, S. S. Vivekananthan, M. Gopiraman, N. Sulochana and A. R. Vincent, J. Surfactants Deterg., 2013, 16, 251–263 CrossRef CAS.
- S. A. Umoren, M. M. Solomon, U. M. Eduok, I. B. Obot and A. U. Israel, J. Environ. Chem. Eng., 2014, 2, 1048–1060 CrossRef CAS.
- C. Verma, E. Ebenso, I. Bahadur, I. Obot and M. Quraishi, J. Mol. Liq., 2015, 212, 209–218 CrossRef CAS.
- C. Verma, M. Quraishi and A. Singh, J. Mol. Liq., 2015, 212, 804–812 CrossRef CAS.
- Y. Feng, S. Chen, W. Guo, Y. Zhang and G. Liu, J. Electroanal. Chem., 2007, 602, 115–122 CrossRef CAS.
- L. Li, Q. Qu, W. Bai, F. Yang, Y. Chen, S. Zhang and Z. Ding, Corros. Sci., 2012, 59, 249–257 CrossRef CAS.
- H. M. A. El-Lateef, V. Abbasov, L. Aliyeva, E. Qasimov and I. Ismayilov, Mater. Chem. Phys., 2013, 142, 502–512 CrossRef.
- W. Mohamed and A. M. Abu-Dief, J. Phys. Chem. Solids, 2018, 116, 375–385 CrossRef CAS.
- L. H. Abdel-Rahman, A. M. Abu-Dief, M. Abd-El Sayed and M. M. Zikry, J. Chem. Mater. Res., 2016, 8, 8–22 Search PubMed.
- L. Abdel-Rahman, B. Al-Farhan, A. Abu-Dief and M. Zikry, Archives in Chemical Research, 2016, 1, 1–10 Search PubMed.
- N. Soltani, M. Behpour, E. Oguzie, M. Mahluji and M. Ghasemzadeh, RSC Adv., 2015, 5, 11145–11162 RSC.
- F. M. Donahue and K. Nobe, J. Electrochem. Soc., 1965, 112, 886–891 CrossRef CAS.
- H. Fan, S. Li, Z. Zhao, H. Wang, Z. Shi and L. Zhang, Corros. Sci., 2011, 53, 4273–4281 CrossRef CAS.
- A. Singh, S. Mohapatra and B. Pani, J. Ind. Eng. Chem., 2016, 33, 288–297 CrossRef CAS.
- M. Mobin and M. Rizvi, Carbohydr. Polym., 2017, 160, 172–183 CrossRef CAS PubMed.
- E. B. Ituen, M. M. Solomon, S. A. Umoren and O. Akaranta, J. Pet. Sci. Eng., 2019, 174, 984–996 CrossRef CAS.
- S. A. El Wanees, N. ElBasiony, A. Al-Sabagh, M. Alsharif, S. A. El Haleem and M. Migahed, J. Mol. Liq., 2017, 248, 943–952 CrossRef.
- A. Al-Sabagh, M. Migahed, S. Sadeek and N. El Basiony, Egypt. J. Pet., 2018, 27, 811–821 CrossRef.
- A. Mishra, C. Verma, H. Lgaz, V. Srivastava, M. Quraishi and E. E. Ebenso, J. Mol. Liq., 2018, 251, 317–332 CrossRef CAS.
- V. S. Sastri, Green corrosion inhibitors: theory and practice, John Wiley & Sons, 2012 Search PubMed.
- S. Papavinasam, Uhlig's corrosion handbook, 2011, pp. 1021–1032 Search PubMed.
- F. El-Taib Heakal, S. K. Attia, S. A. Rizk, M. A. Abou Essa and A. E. Elkholy, J. Mol. Struct., 2017, 1147, 714–724 CrossRef CAS.
- K. Khaled, J. Solid State Electrochem., 2009, 13, 1743–1756 CrossRef CAS.
- L. H. Abdel-Rahman, M. S. S. Adam, A. M. Abu-Dief, H. Moustafa, M. T. Basha, A. S. Aboraia, B. S. Al-Farhan and H. E. S. Ahmed, Appl. Organomet. Chem., 2018, 32, e4527 CrossRef.
- E. E. Oguzie, C. K. Enenebeaku, C. O. Akalezi, S. C. Okoro, A. A. Ayuk and E. N. Ejike, J. Colloid Interface Sci., 2010, 349, 283–292 CrossRef CAS PubMed.
- A. Y. Musa, A. A. H. Kadhum, A. B. Mohamad and M. S. Takriff, Mater. Chem. Phys., 2011, 129, 660–665 CrossRef CAS.
- H. Ju, Z.-P. Kai and Y. Li, Corros. Sci., 2008, 50, 865–871 CrossRef CAS.
- P. Singh, E. E. Ebenso, L. O. Olasunkanmi, I. B. Obot and M. A. Quraishi, J. Phys. Chem. C, 2016, 120, 3408–3419 CrossRef CAS.
- M. Rahmati and H. Modarress, J. Mol. Struct. THEOCHEM, 2009, 901, 110–116 CrossRef CAS.
- Z. Zhang, N. Tian, X. Huang, W. Shang and L. Wu, RSC Adv., 2016, 6, 22250–22268 RSC.
Footnote |
| † Electronic supplementary information (ESI) available. See DOI: 10.1039/c9ra00397e |
|
| This journal is © The Royal Society of Chemistry 2019 |
Click here to see how this site uses Cookies. View our privacy policy here.  Open Access Article
 *a,
Amr. Elgendya,
H. Nadyb,
M. A. Migaheda and
E. G. Zaki
 a
a
![[double bond, length as m-dash]](https://www.rsc.org/images/entities/char_e001.gif) N–) in the molecules, which results from the condensation of a primary amine and a ketone/aldehyde. Recently, several Schiff base compounds have been investigated as effective acid corrosion inhibitors.18–24 The popularity of these compounds as corrosion inhibitors is attributed to ease of their synthesis from economical materials and their low toxicity.25,26 Generally, the effectiveness of a compound to reduce the rate of corrosion depends mainly on its ability to adsorb on the metal surface.27,28 The selection of efficient anti-corrosion compound is mostly dependent on the experimental information, which is based on their electron donating property. At the present time, the theoretical approaches are used to ascertain the applicability of experimental approaches by comparing the empirical and the quantum results.29 Thus, the present work reports the synthesis of two new Schiff base compounds, namely, N-(2-((Z)-2-(benzylideneamino)ethylamino)ethyl)-3,4,5-trihydroxybenzamide (Bz) and N-(2-((Z)-2-(3-methoxy-4-hydroxybenzylideneamino)ethylamino)ethyl)-3,4,5-trihydroxybenzamide (VA) (see Fig. 1) to investigate their inhibition effect as acid corrosion inhibitors for (MS) in 0.5 M HCl at 298 K, and to study the consequence of –OH and –OCH3 substitution groups on their protection abilities. Furthermore, some quantum chemical parameters (i.e., EHOMO, ELUMO, and ΔE) were calculated to check the correlation between the as-synthesized molecular structures and their inhibition efficacy.
N–) in the molecules, which results from the condensation of a primary amine and a ketone/aldehyde. Recently, several Schiff base compounds have been investigated as effective acid corrosion inhibitors.18–24 The popularity of these compounds as corrosion inhibitors is attributed to ease of their synthesis from economical materials and their low toxicity.25,26 Generally, the effectiveness of a compound to reduce the rate of corrosion depends mainly on its ability to adsorb on the metal surface.27,28 The selection of efficient anti-corrosion compound is mostly dependent on the experimental information, which is based on their electron donating property. At the present time, the theoretical approaches are used to ascertain the applicability of experimental approaches by comparing the empirical and the quantum results.29 Thus, the present work reports the synthesis of two new Schiff base compounds, namely, N-(2-((Z)-2-(benzylideneamino)ethylamino)ethyl)-3,4,5-trihydroxybenzamide (Bz) and N-(2-((Z)-2-(3-methoxy-4-hydroxybenzylideneamino)ethylamino)ethyl)-3,4,5-trihydroxybenzamide (VA) (see Fig. 1) to investigate their inhibition effect as acid corrosion inhibitors for (MS) in 0.5 M HCl at 298 K, and to study the consequence of –OH and –OCH3 substitution groups on their protection abilities. Furthermore, some quantum chemical parameters (i.e., EHOMO, ELUMO, and ΔE) were calculated to check the correlation between the as-synthesized molecular structures and their inhibition efficacy.
![[thin space (1/6-em)]](https://www.rsc.org/images/entities/char_2009.gif) :
:![[thin space (1/6-em)]](https://www.rsc.org/images/entities/char_2009.gif) 1, and then the product was reacted with substituted benzaldehyde (Alfa Aesar, 97%) in ethanol (Fisher Scientific, 99.8%) solutions in the molar ratio 1
1, and then the product was reacted with substituted benzaldehyde (Alfa Aesar, 97%) in ethanol (Fisher Scientific, 99.8%) solutions in the molar ratio 1![[thin space (1/6-em)]](https://www.rsc.org/images/entities/char_2009.gif) :
:![[thin space (1/6-em)]](https://www.rsc.org/images/entities/char_2009.gif) 1 to form the related Schiff-base, as reported elsewhere.18,19 The product was allowed to cool before crystallization in ethanol. The preparation process of (Bz) and (VA) compounds is shown in Scheme 1 and their molecular structures were characterized by 1H-NMR spectroscopy.
1 to form the related Schiff-base, as reported elsewhere.18,19 The product was allowed to cool before crystallization in ethanol. The preparation process of (Bz) and (VA) compounds is shown in Scheme 1 and their molecular structures were characterized by 1H-NMR spectroscopy.
![[thin space (1/6-em)]](https://www.rsc.org/images/entities/char_2009.gif) :
:![[thin space (1/6-em)]](https://www.rsc.org/images/entities/char_2009.gif) 80 ratio of ethanol
80 ratio of ethanol![[thin space (1/6-em)]](https://www.rsc.org/images/entities/char_2009.gif) :
:![[thin space (1/6-em)]](https://www.rsc.org/images/entities/char_2009.gif) water was prepared. Different concentrations (0–250 ppm) from the stock solution were prepared in 0.5 M HCl.
water was prepared. Different concentrations (0–250 ppm) from the stock solution were prepared in 0.5 M HCl.
![[H with combining low line]](https://www.rsc.org/images/entities/b_i_char_0048_0332.gif) –OH, phenolic–OH), 8.446 (s, 1H, CH
–OH, phenolic–OH), 8.446 (s, 1H, CH![[double bond, length as m-dash]](https://www.rsc.org/images/entities/char_e001.gif) N), 6.802 (s, 2H, Ar–H), 7.288–7.349 (m, 4H, benzylideneamino nucleus), 3.769–4.066 (t, 2H, Ar–CH–N–C
N), 6.802 (s, 2H, Ar–H), 7.288–7.349 (m, 4H, benzylideneamino nucleus), 3.769–4.066 (t, 2H, Ar–CH–N–C![[H with combining low line]](https://www.rsc.org/images/entities/b_i_char_0048_0332.gif) 2–C
2–C![[H with combining low line]](https://www.rsc.org/images/entities/b_i_char_0048_0332.gif) 2), 2.417–2.493 (t, 2H, CH2–C
2), 2.417–2.493 (t, 2H, CH2–C![[H with combining low line]](https://www.rsc.org/images/entities/b_i_char_0048_0332.gif) 2–NH–C
2–NH–C![[H with combining low line]](https://www.rsc.org/images/entities/b_i_char_0048_0332.gif) 2–CH2), 3.769 (s, 3H, Ar–OC
2–CH2), 3.769 (s, 3H, Ar–OC![[H with combining low line]](https://www.rsc.org/images/entities/b_i_char_0048_0332.gif) 3).
3).

![[thin space (1/6-em)]](https://www.rsc.org/images/entities/char_2009.gif) Z vs. log
Z vs. log![[thin space (1/6-em)]](https://www.rsc.org/images/entities/char_2009.gif) F) and phase angle plots obtained for the (MS) electrode immersed in 0.5 M HCl with and without different concentrations of the inhibitors are displayed in Fig. 3c and d. As seen from these figures, at the low frequency region, an increase in the absolute impedance |Z| could be observed. This increase confirms the higher inhibition performance obtained at high concentration, which is related to the adsorption of these compounds on the (MS) surface and blocking its active sites. Also, the shift of the phase angle values to the negative direction further indicates that these compounds act mainly by forming a protective film over the (MS) surface.38 The capacity of the double layer (Cdl) and the inhibition efficiency (η%) are determined from the following equation:39
F) and phase angle plots obtained for the (MS) electrode immersed in 0.5 M HCl with and without different concentrations of the inhibitors are displayed in Fig. 3c and d. As seen from these figures, at the low frequency region, an increase in the absolute impedance |Z| could be observed. This increase confirms the higher inhibition performance obtained at high concentration, which is related to the adsorption of these compounds on the (MS) surface and blocking its active sites. Also, the shift of the phase angle values to the negative direction further indicates that these compounds act mainly by forming a protective film over the (MS) surface.38 The capacity of the double layer (Cdl) and the inhibition efficiency (η%) are determined from the following equation:39


![[thin space (1/6-em)]](https://www.rsc.org/images/entities/char_2009.gif) ln(Kads × Csolvent)
ln(Kads × Csolvent)

![[double bond, length as m-dash]](https://www.rsc.org/images/entities/char_e001.gif) N group, pi electrons in the aromatic rings, and various functional groups that interact with the metal surface. It was confirmed that the presence of various functional groups including –OCH3, –OH, phenyl, benzene, and NH in different orientations are responsible for efficient adsorption. In the investigated Schiff Bases in the present study, VA has two electron donation groups (–OCH3, –OH) that increase its ability to adsorb on the mild steel surface. The inhibition efficiency of the prepared Schiff bases of different substituted groups can be explained with the help of Hammett substituent constant (σ) values of the substituents attached to the aromatic ring of the aldehyde moiety (vanillin and benzaldehyde). VA contains meta-OCH3 (methoxy) group that has σ value (in positive, i.e., +0.12) and para-OH (hydroxyl) substituent that has σ value (in negative, i.e., −0.37), and the net σ value is −0.25, which is an indicative that the substituted groups increase the electron donation ability of VA compared to non-substituted inhibitor molecule Bz that has zero value of Hammett substituent constant, i.e., +0.00.56–58 Therefore, the inhibition efficiency of VA is greater than BZ. Fig. 8 displays the schematic representation of adsorption of the VA molecules over the mild steel surface via electrostatic attraction between the protonated VA and negatively charged sites of the MS surface and the electron pair transfer between VA and the vacant 3d orbital of Fe.
N group, pi electrons in the aromatic rings, and various functional groups that interact with the metal surface. It was confirmed that the presence of various functional groups including –OCH3, –OH, phenyl, benzene, and NH in different orientations are responsible for efficient adsorption. In the investigated Schiff Bases in the present study, VA has two electron donation groups (–OCH3, –OH) that increase its ability to adsorb on the mild steel surface. The inhibition efficiency of the prepared Schiff bases of different substituted groups can be explained with the help of Hammett substituent constant (σ) values of the substituents attached to the aromatic ring of the aldehyde moiety (vanillin and benzaldehyde). VA contains meta-OCH3 (methoxy) group that has σ value (in positive, i.e., +0.12) and para-OH (hydroxyl) substituent that has σ value (in negative, i.e., −0.37), and the net σ value is −0.25, which is an indicative that the substituted groups increase the electron donation ability of VA compared to non-substituted inhibitor molecule Bz that has zero value of Hammett substituent constant, i.e., +0.00.56–58 Therefore, the inhibition efficiency of VA is greater than BZ. Fig. 8 displays the schematic representation of adsorption of the VA molecules over the mild steel surface via electrostatic attraction between the protonated VA and negatively charged sites of the MS surface and the electron pair transfer between VA and the vacant 3d orbital of Fe.


![[thin space (1/6-em)]](https://www.rsc.org/images/entities/char_2009.gif)
![[thin space (1/6-em)]](https://www.rsc.org/images/entities/char_2009.gif) 000 steps for each. The force field was set to COMPASS with ultrafine quality of the energy calculation. Fig. 10 shows the modes of adsorption of (VA) and (Bz) in both the side and top views on the Fe (110) crystal. The output data from the simulation method is mainly in terms of energy indices including:
000 steps for each. The force field was set to COMPASS with ultrafine quality of the energy calculation. Fig. 10 shows the modes of adsorption of (VA) and (Bz) in both the side and top views on the Fe (110) crystal. The output data from the simulation method is mainly in terms of energy indices including:


